Modern studies increasingly
employ image processing methods, enabled by advances in various computer vision
technologies. These techniques provide essential tools for analyzing
experimental flow visualization data, including schlieren,
shadowgraph, and photographic images. One of the significant problems detailed
in [1] is to investigate simultaneously the evolution of discontinuous flows in
a rectangular shock tube channel using high-speed imaging techniques to capture
dynamic flow behavior. Complementing this experimental approach, a specialized
code system for image processing was developed to address shock wave detection
and tracking in high-speed experimental imagery. Further advancements include a
modified background-oriented schlieren (BOS) image
processing method [2], which was specifically designed to mitigate inaccuracies
when analyzing millimeter-scale objects. This method, applied to thermal
airflow imaging at controlled temperatures, incorporates critical steps such as
background subtraction, object reconstruction, filtering, and edge detection.
The study also explores shock wave dynamics, including distortion of a wave
front and instability formation. Additionally, a computational method for shock
wave detection in two-dimensional viscous and inviscid flows on Cartesian grids
was introduced in [3]. This approach enables precise shock identification
within viscous flow fields while providing a robust representation of shock
structures.
The most commonly used methods
of optical flow visualization include schlieren and
shadow imaging, which allow achieving observation of density gradients in
transparent media with high resolution. This gives possibilities of obtaining a
quantitative and qualitative representation of the flow structure [4].
Similarly, methods combining schlieren imaging with
optical flow and Navier–Stokes-based reconstructions
have enabled accurate temperature field recovery in high-speed jets [5].
Traditional image processing methods such as edge detection and Hough
transforms have been successfully applied to identify and track coherent flow
structures such as oblique and bow shocks in shadowgraph sequences [6]. These
classical computer vision approaches, also based on Canny edge detection and
morphological operations, provide interpretability and require minimal training
data, but require extensive algorithmic tuning and post-processing to extract
physical parameters. More recent advances use machine learning and deep neural networks
to automate object detection and classification in complex flow fields.
Convolutional neural networks (CNNs), especially modern architectures such as
YOLOv8 and VGG16, have demonstrated high accuracy in detecting shockwaves,
plumes, and particle structures in shadowgraph images [7], enabling scaling and
real-time analysis of large experimental datasets.
Further progress has been made
through physics-informed and hybrid approaches that integrate domain knowledge
into data-driven models. For instance, physics-oriented constraints derived
from fluid continuity and optical equations have been incorporated into optical
flow frameworks to improve motion estimation in turbulent flows visualized by
shadowgraphy [8], while physics-informed neural networks (PINNs)
have shown promise in reconstructing hypersonic inlet flows from limited data
[9]. These approaches bridge the gap between pure data-driven models and
first-principles physics, enhancing both accuracy and generalizability. Despite
these advances, challenges remain in handling low-contrast features, weak
reflected waves, and highly dynamic flow structures—particularly in shock tube
experiments where disturbance shadows exhibit high gradient continuity and low
image quality [10]. Innovative cascaded feature extraction pipelines and
line-scanning techniques have begun to address these issues, demonstrating
sub-5% error in velocity estimation and robustness in low-resolution conditions
[11].
In the present
paper we proposed the image processing techniques for extracting information of
the shape of the discharge plasma area from the experimental schlieren
images. The study of a flow dynamics under the
influence of a discharge was supported by both experimental and numerical data.
The discharge effect on the flow characteristics is clearly manifested in the
high-speed flow, where it was shown that changes in the adiabatic index of the
discharge-generated plasma, due to the degree of ionization and the degree of
nonequilibrium, along with the thermal effects, directly
affect the standoff of the bow shock wave (BSW) and aerodynamic characteristics
such as the drag force [12]. The extraction of the data of source geometry from
experimental images and their embedding into numerical simulations was done
with the use of a partially automated image processing method that extracts the
real geometry about the plasma glow region boundary and incorporates it into
the Navier–Stokes solver for a more accurate
reconstruction of the flow field [13]. This approach allows realistic modeling
of plasma flow control, increasing the accuracy of the modeling and providing
better correlation with experimental observations. Compared to detectors based
on, for example, convolutional neural networks such as YOLOv8 or VGG16, the
proposed threshold-based method is simple and deterministic and focuses not on
data, but on physical principles in the first place. It does not require
labeled training data, retains the direct interpretability of the extracted
geometry of the plasma boundary, and remains applicable to limited sets of
experimental images. Neural network-based approaches assume large labeled sets
of experimental images to automatically solve the problem on new images, while
the proposed approach is designed to transfer physically significant source
geometry directly to a numerical solver with a significantly limited amount of
data, therefore, a direct correct comparison of the two approaches in this
problem seems difficult.
The experiments were conducted
using an experimental setup based on a shock tube. Fig. 1 shows the
schematic of the gas-dynamic circuit. Here, 1 is the high-pressure chamber, 2
is the low-pressure chamber, 3 is the measuring block, 4 is the supersonic
nozzle, 5 are the optical windows, 6 is power supply to the electrodes, 7 is
the working chamber, 8 is the aerodynamic model with electrodes, 9 is the
damping tank, 10 is the nozzle inlet slit, 11 is the inlet cross-section, 12 is
the diaphragm unit, and 13 is the exhaust channel. The working chamber 7 is
attached to the end of the low-pressure chamber 2 and consists of a flat,
symmetric supersonic nozzle 4 with a wall inclination angle of 11° relative to
the axis. On the nozzle axis, at a distance of 23 cm from the inlet, a model
(8) is placed, shaped as a semi-cylinder with a rounded front part of 1.5 cm
radius and a length of 3.8 cm. A gas compressed in the shock tube, with
stagnation parameters, enters the nozzle, generating a supersonic flow in the
region around the model.
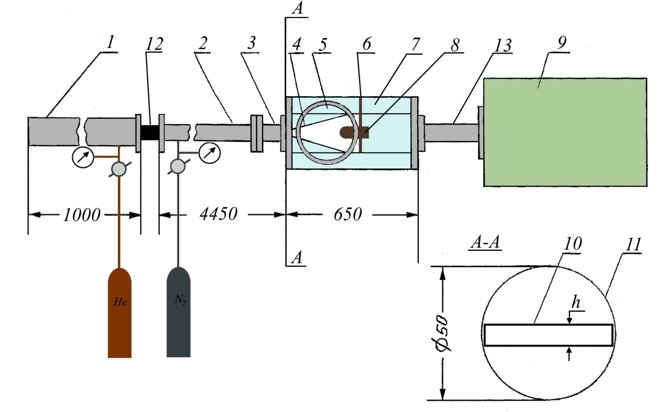
Fig. 1. Experimental setup scheme.
Flow visualization was performed using a schlieren system (Fig. 2) illuminated by
a semiconductor laser with electron-beam pumping, producing light pulses with a
duration of 30 ns. The laser beam illuminates an entrance slit positioned at
the focal distance from the input lens. The parallel beam passes through the
region around the model via optical windows. After traversing the flow field,
the beam is focused by an output lens onto the plane of a knife edge,
subsequently illuminating the sensor of a Canon EOS 300D digital camera. The
camera lens is adjusted to provide a sharp image of the model while fully
capturing the laser illumination without clipping. The knife edge blocks half
of the focused slit image, creating a dimmed background around the model on the
camera sensor. During supersonic flow, density gradients associated with shock
waves and other flow discontinuities refract the laser light, altering its
propagation path. This refracted light is either blocked by or passes above the
knife edge, resulting in regions of reduced or enhanced brightness compared to
the background.
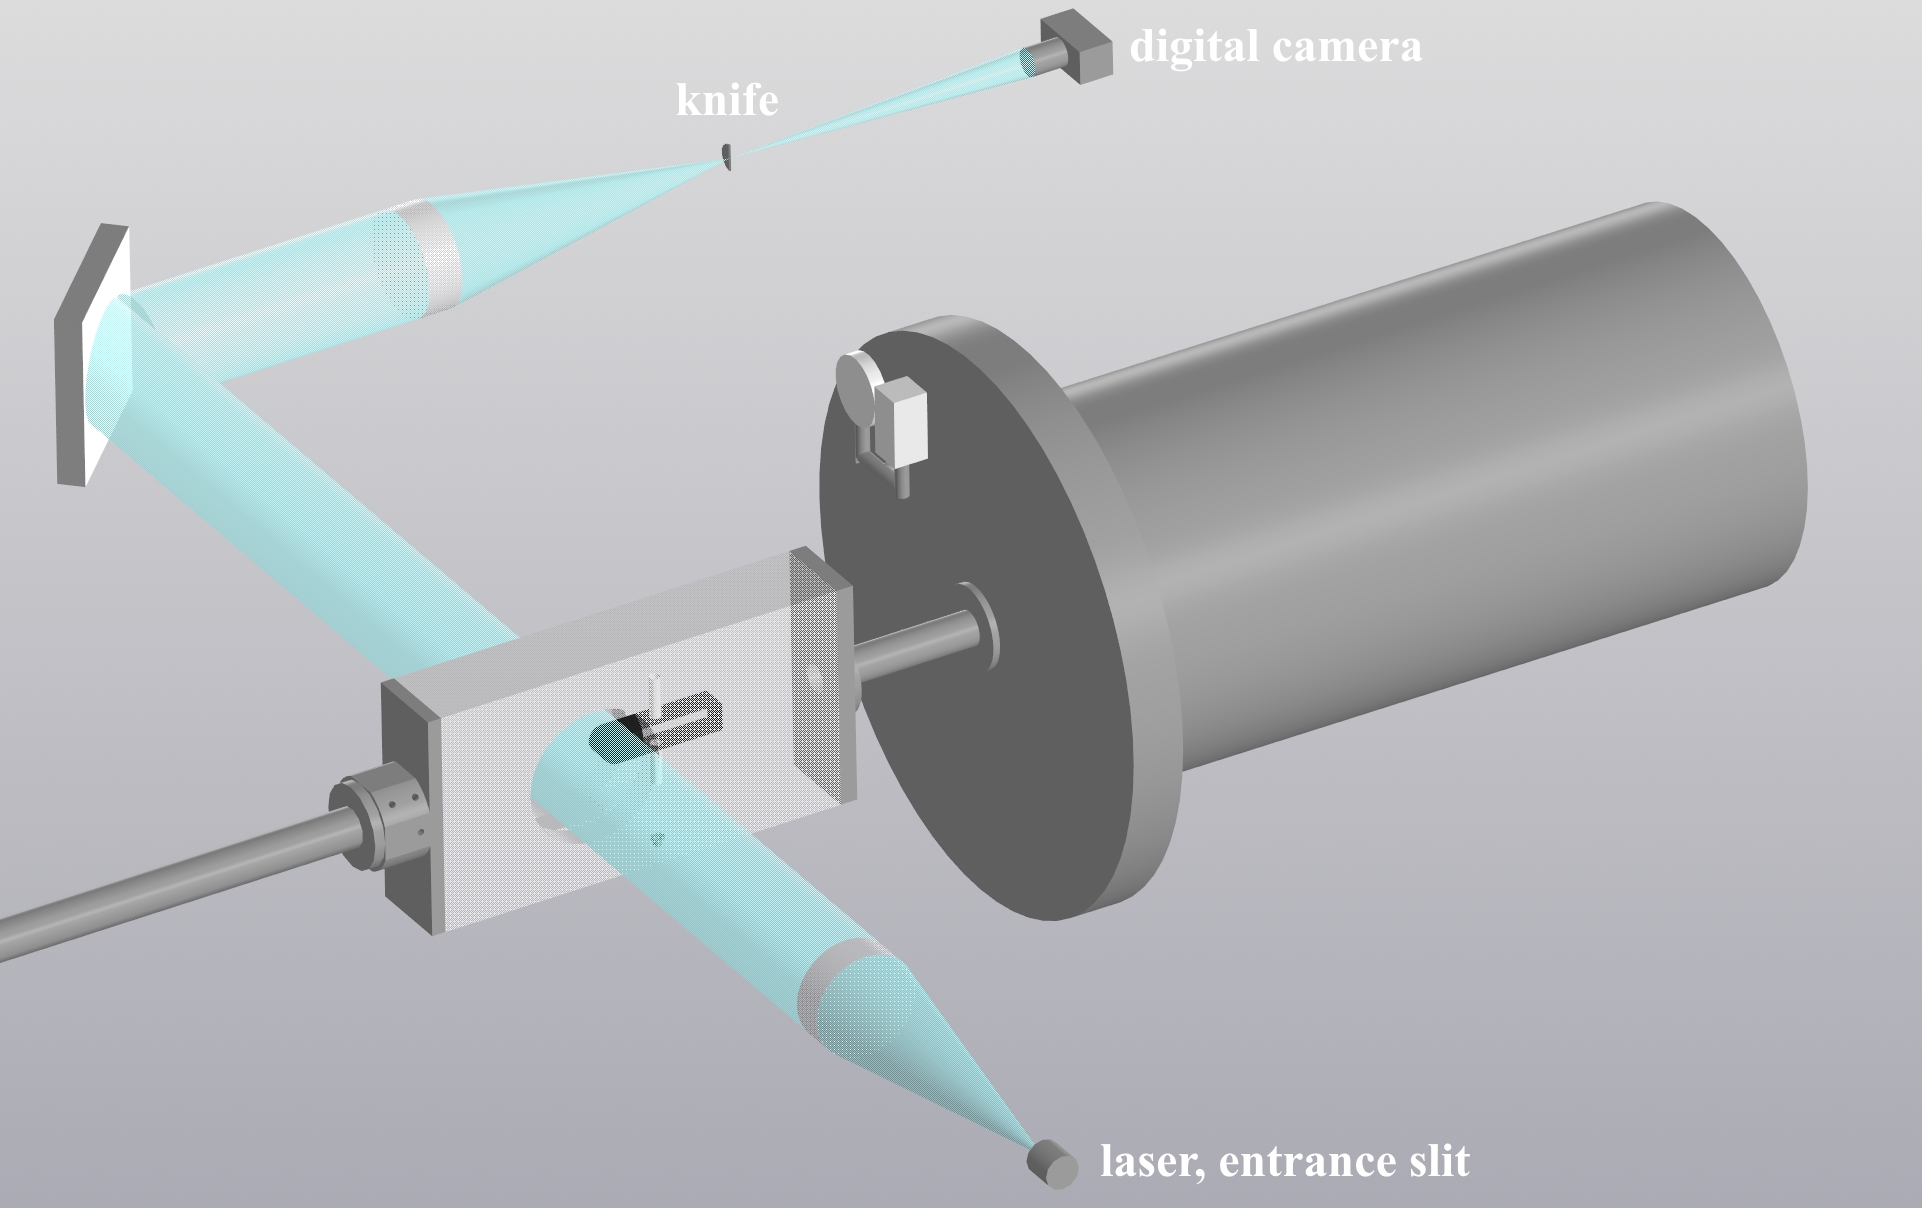
Fig. 2. Schlieren flow visualization diagram of the model.
As a result, the
BSW formed during supersonic flow over the model is clearly visualized as
distinct bright or dark features in the captured images.
To influence the position of
the bow shock wave, a gas discharge was organized at the leading edge of the
body, creating a plasma zone near the body. The main obstacle to obtaining
high-quality schlieren images was the intense
self-emission of the plasma. To reduce this effect, an optical filter was used,
transmitting light within the wavelength band of the laser emission at 656 nm,
and a narrow collimator was placed in front of the knife edge. On the other
hand, the plasma's own glow made it possible to refine the shape of the impact
area during further image processing. From the flow images obtained in
different experiments, the distance d along the nozzle axis from the
model’s nose to the detached shock wave was determined, and the variation of
the BSW position was analyzed depending on the controlled flow conditions.
A photograph of the working
chamber with the supersonic nozzle and the installed model inside is shown in
Fig. 3.
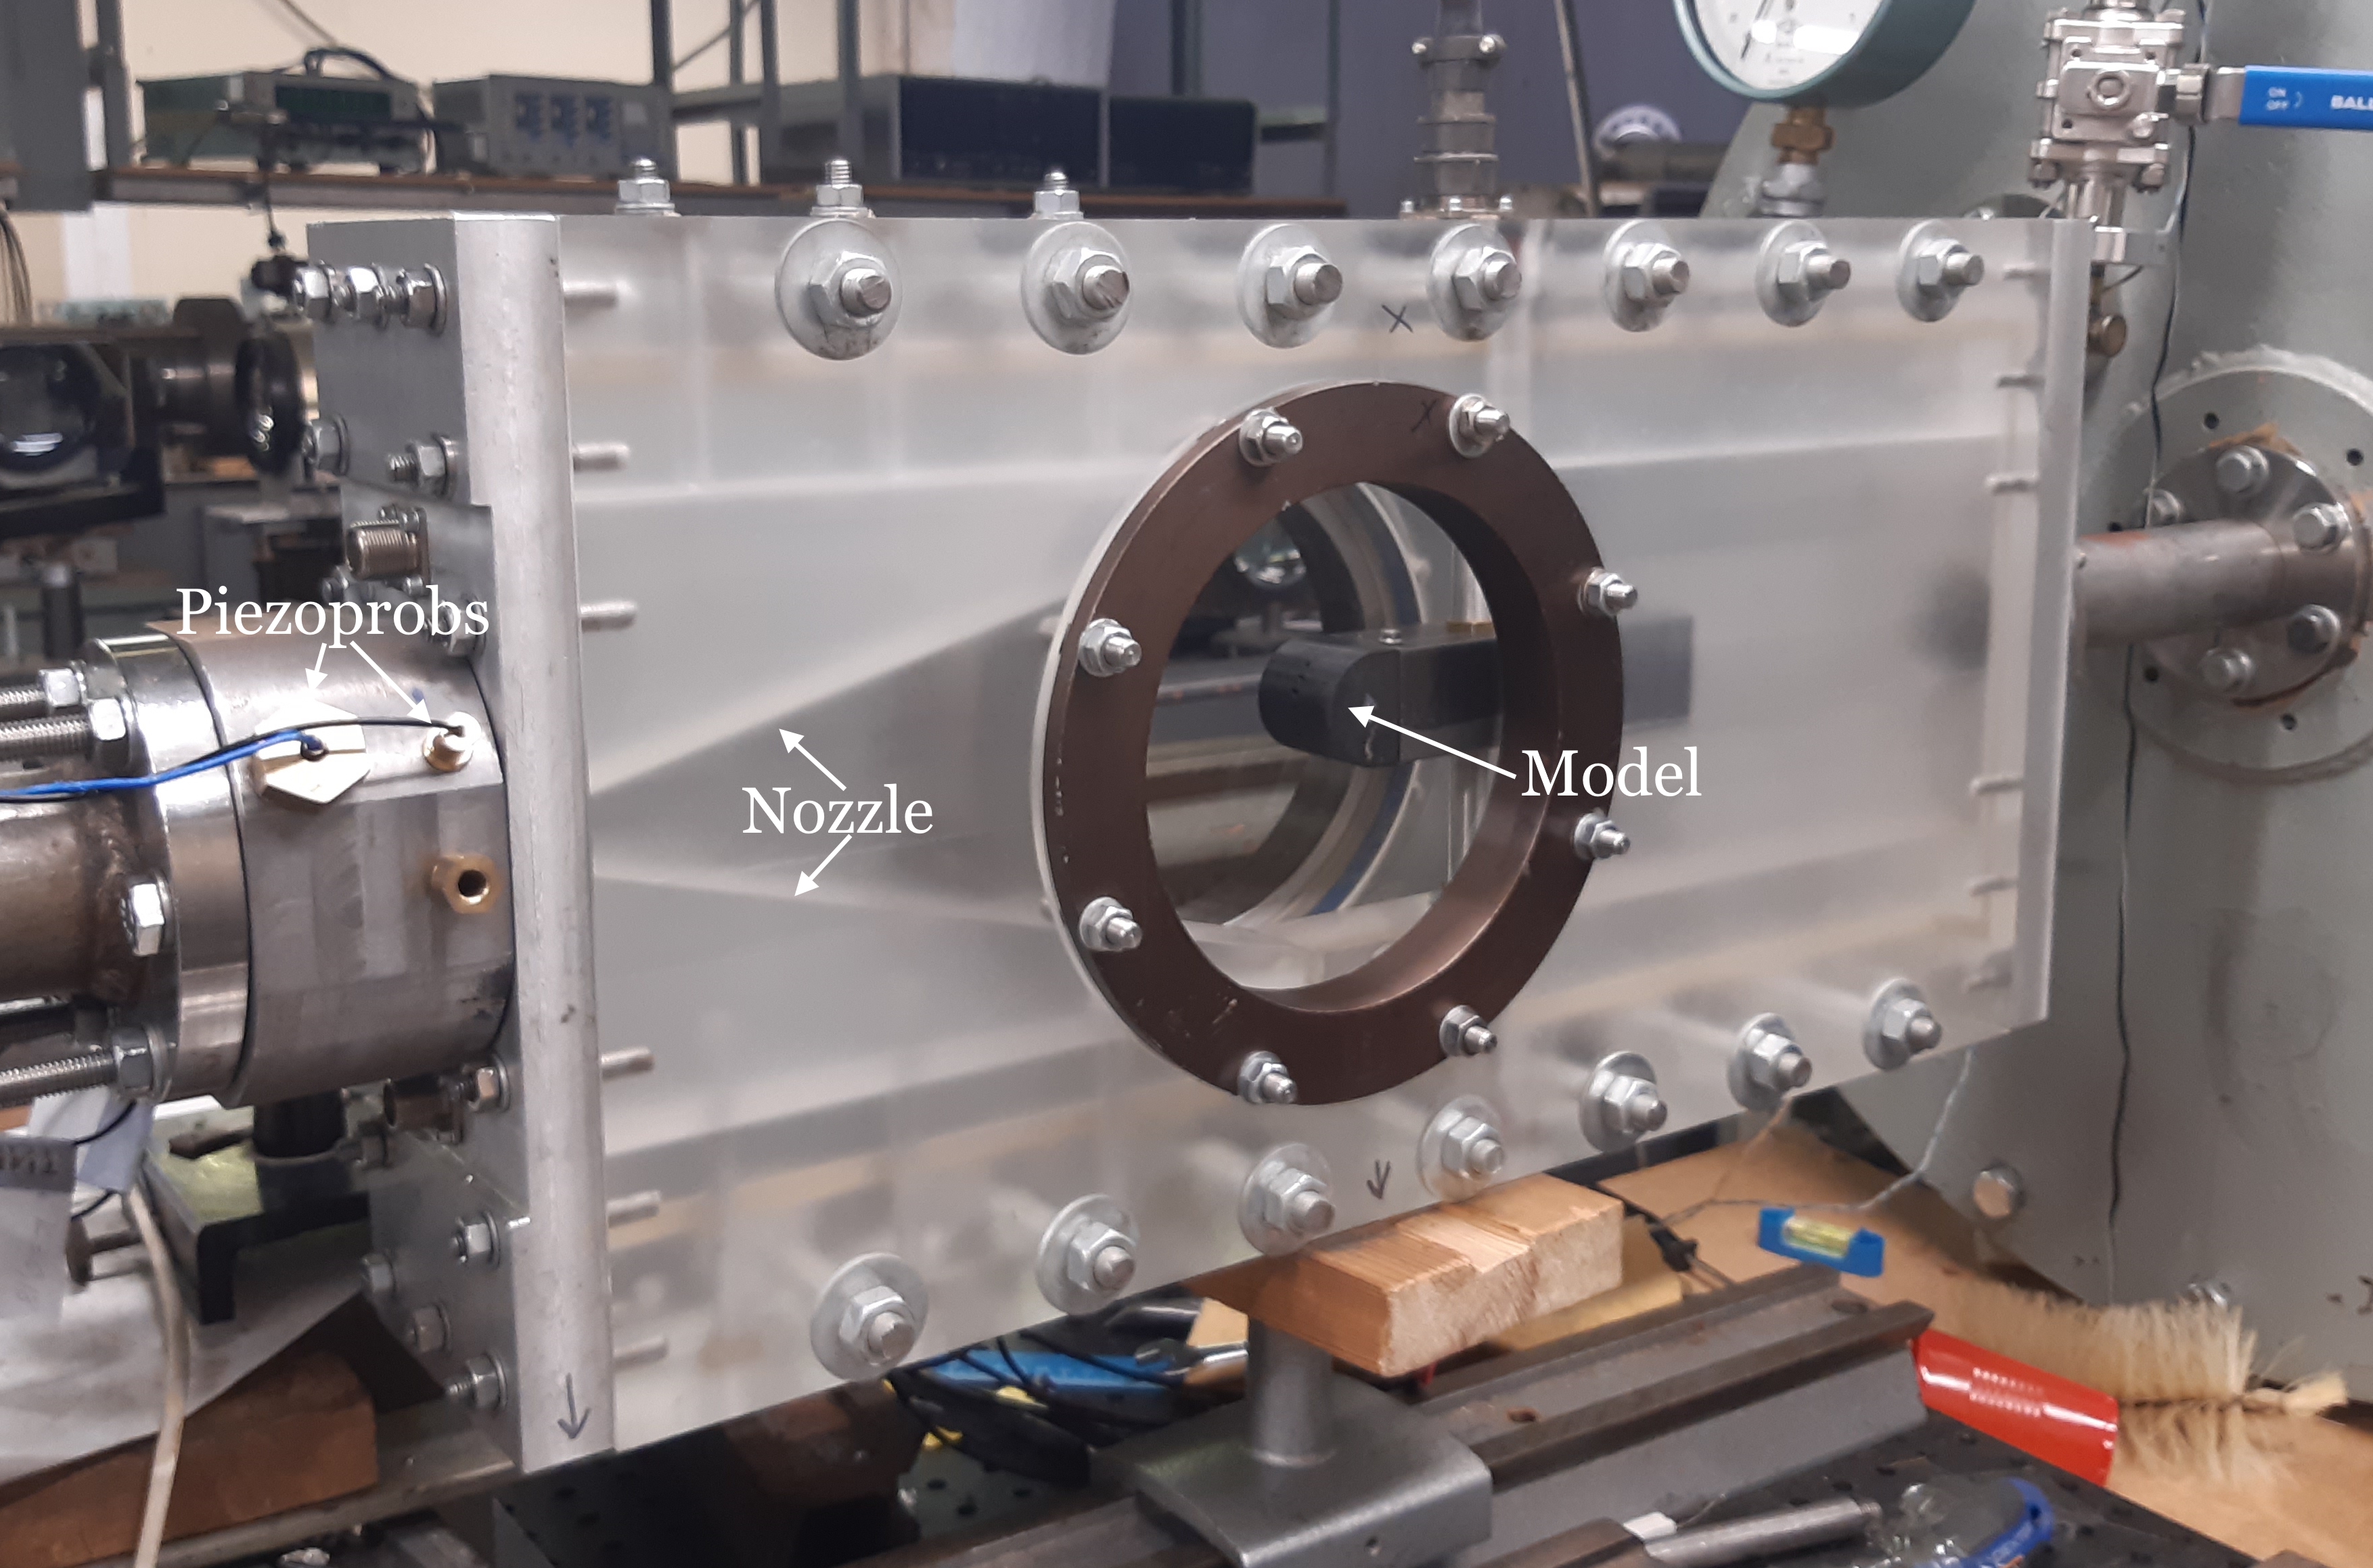
Fig. 3. Photo of the working camera.
The image
processing algorithm starts with an input image (Fig. 4, left), which is
pre-processed using Gaussian filtering to reduce high-frequency noise and
smooth the image while preserving important flow features such as shock fronts.
Afterwards, the image is normalized to enhance contrast and ensure a uniform
intensity distribution across the entire data. The filtered image is then
converted to grayscale to simplify further processing, since intensity
variations in the luminance channel contain the main information about the flux
density gradients. Next, auxiliary constructions are performed based on the
assumption of axial symmetry of the problem (Fig. 4, center).
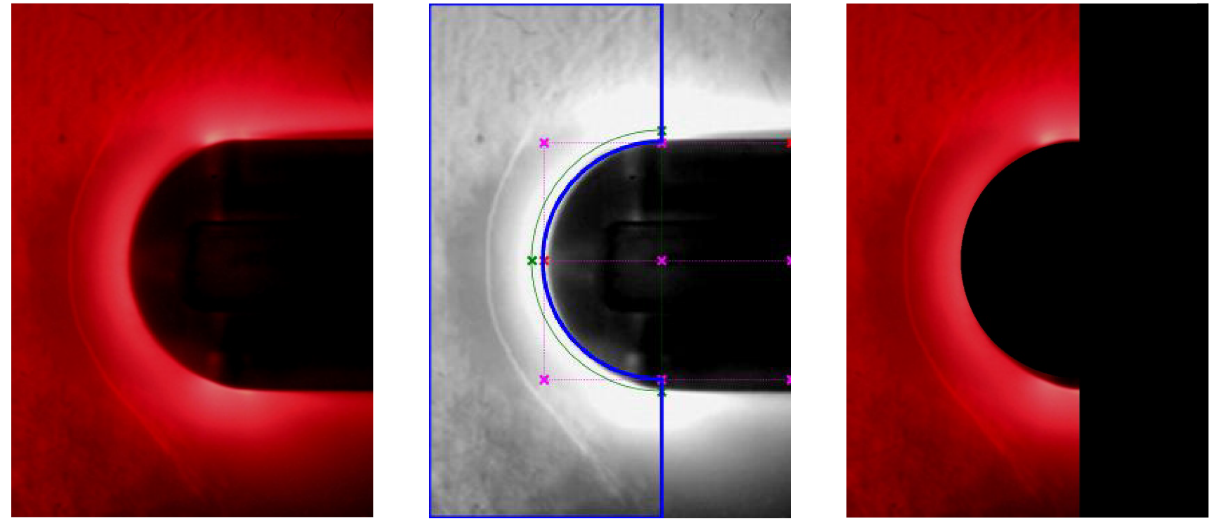
Fig. 4. Experimental image pre-processing
Finally, a region of interest
(ROI) is extracted from the processed grayscale image, containing information
about the area around the aerodynamic model and the inferred location of shock
wave structures, which reduces the computational load and minimizes
interference from irrelevant background areas (Fig. 4, right).
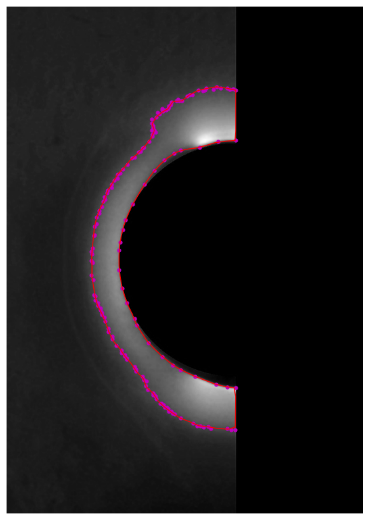
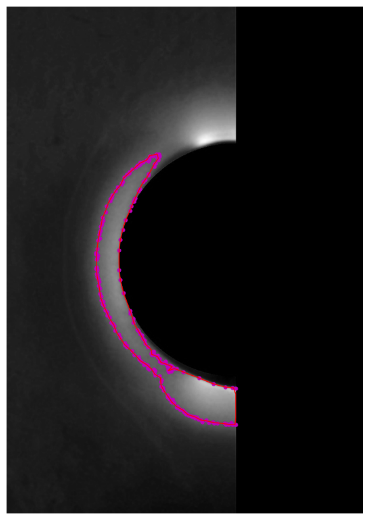
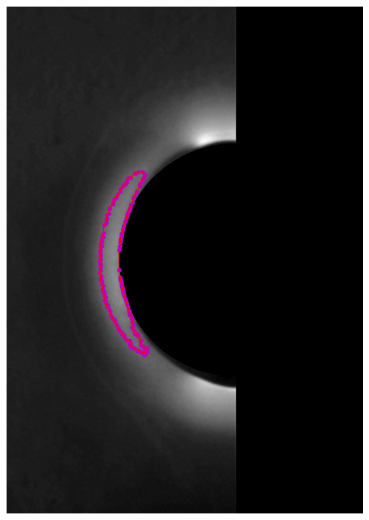
Fig. 5. Extracting the source region boundary (red line) based on the threshold value
The resulting contours
describing the boundary of the plasma source region are sensitive to the choice
of threshold, as shown in Fig. 5, which shows the effects of using
thresholds of 80% (Fig. 5, left), 85% (Fig. 5, center), and 90%
(Fig. 5, right), respectively. These thresholds are defined with respect
to the intensity distribution in the grayscale image. For example, a threshold
set at 85% corresponds to the intensity value above which the brightest 15% of
the pixels are located. This adaptive thresholding
approach provides robust boundary detection by focusing on the most significant
density gradients in the flow, such as shock fronts, while filtering out
low-contrast noise or background variations. The optimal threshold is selected
based on visual inspection and compliance with the expected physical
structures, providing an accurate representation of the flow features under
different experimental conditions. The thresholds of 80%, 85% and 90% in Fig. 5
are included as an illustration of the variability of the approach for the
reconstructed boundary of the plasma region. For the considered experimental
frame used for contour plotting, the values of the source area ranged from
approximately 0.118 at 82% to 0.096 at 85% in dimensionless units. At 86%, the
area drops to 0.042, which indicates fragmentation of the selected luminosity
region. The Otsu threshold value, excluding the low-intensity background,
shifted to intensity levels 122-131, which corresponds to approximately the
82-85% percentile of the central area of interest. Thus, the threshold close to
85% was maintained as a physically reasonable compromise between suppressing
weak background luminosity and maintaining the expected shape of the plasma
source.
A numerical simulation of
high-speed flow around an aerodynamic body under the influence of a discharge
plasma region was carried out by solving two-dimensional Navier–Stokes
equations for a viscous heat-conducting gas (xenon). The main goal of
the modeling was to study the influence of localized energy deposition on the
position of the BSW formed in front of the model. The schematic of the
statement of problem for the numerical simulations is presented in Fig. 6.
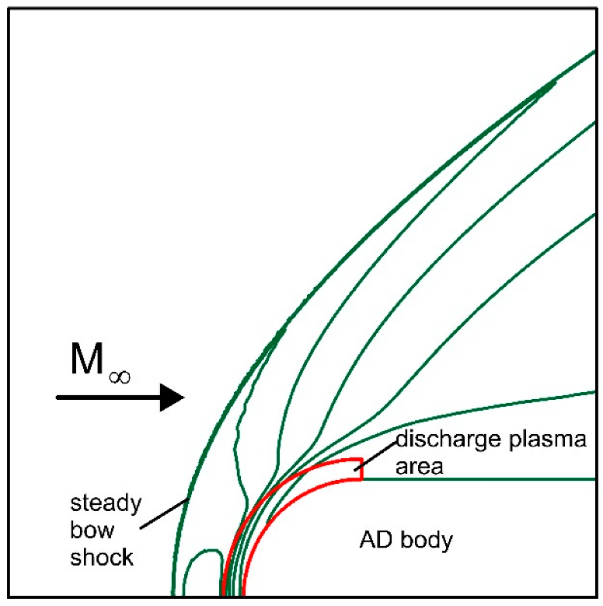
Fig. 6. Sketch of the computational domain
The plasma region created by
the discharge was modeled as a steady zone of the increased characterized by
the specific discharge power q (power per unit of mass), and changed
thermodynamic properties, in particular, the variable adiabatic index (γ),
which depends on degree of ionization and degree on nonequilibrium. The approach takes into account
increased ionization and temperature in the flow due to both shock compression
and the action of the discharge, where the latter is introduced as a term of
the volumetric energy source in the energy equation (see details of the
statement of numerical problem in [12]). Comparative analysis of the numerical
results with experimental schlieren images [12] for
moderate discharge parameters (I≤915 A, q<214) revealed
good agreement between the position and shape of the BSW on the symmetry axis,
which confirmed the reliability of the numerical model in predicting the main
characteristics of a high-speed flow.
In the present study, the
extracted boundaries of the discharge created plasma zone were introduced into
the numerical algorithm which provided a more accurate
simulation of the impact of the plasma region and made it possible to simulate
high-energy discharges (I~1200A, q=550).
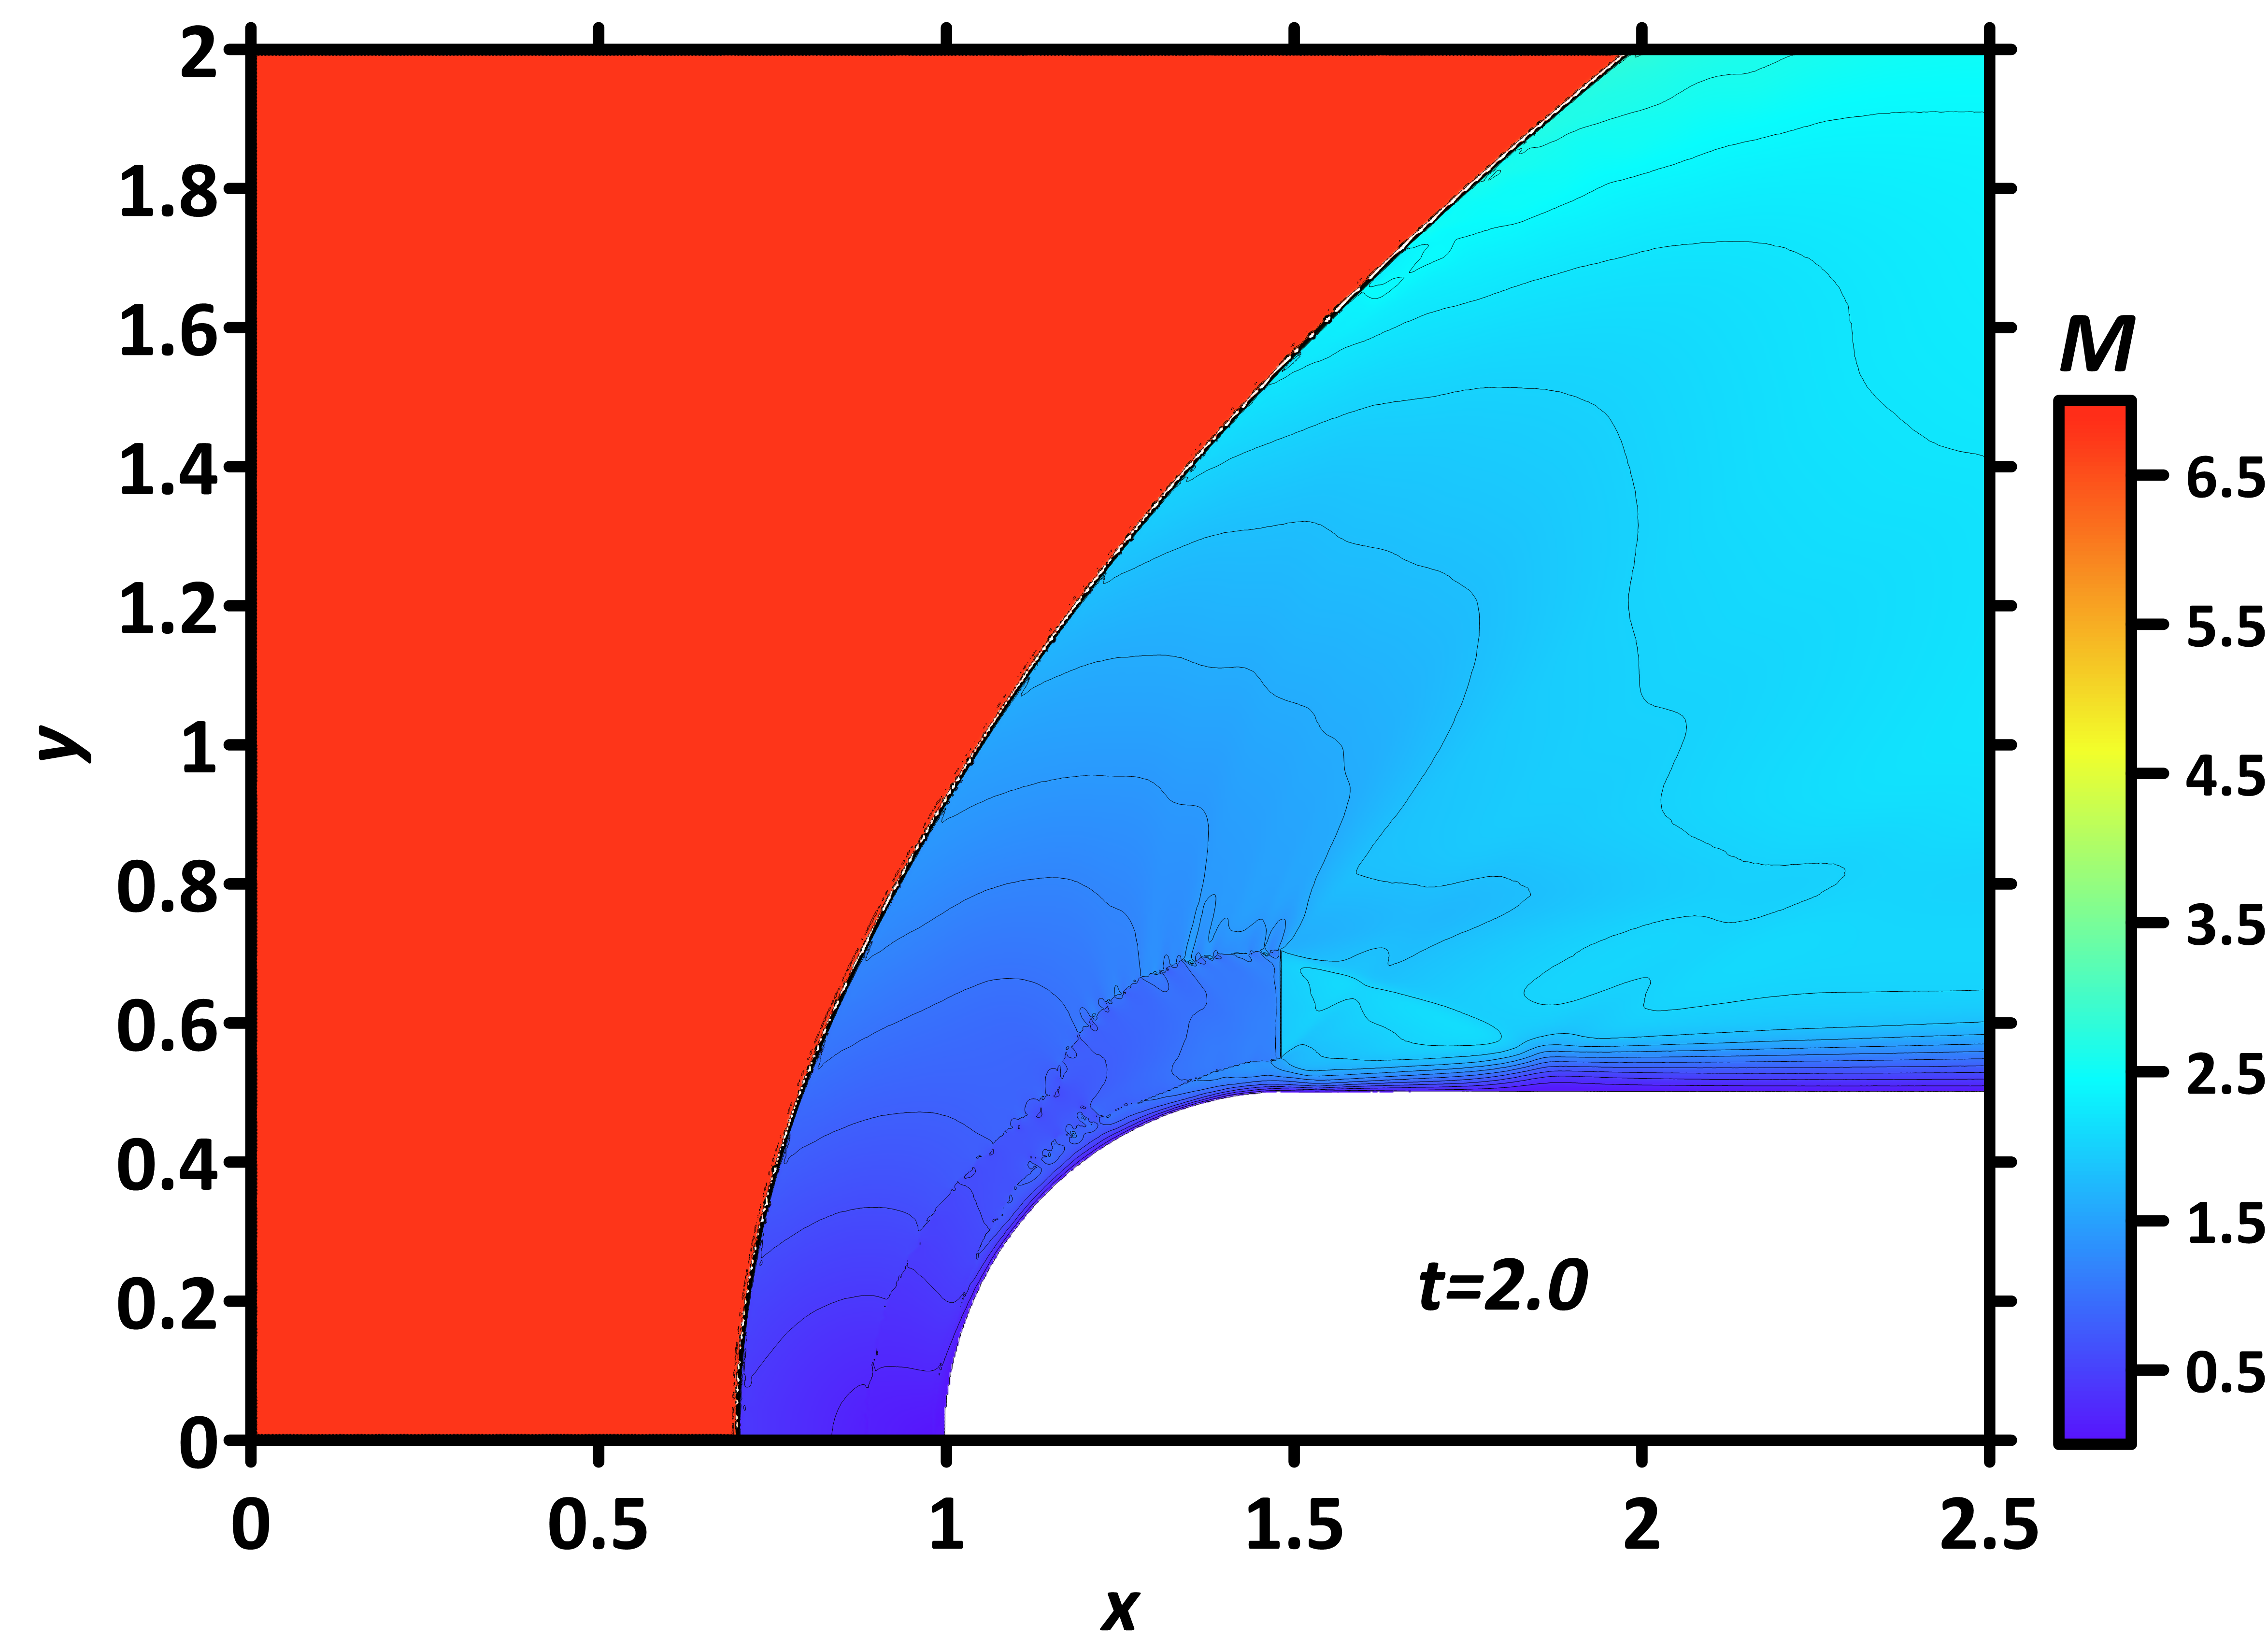
The computational domain (Fig.
6), defined by the parameters 0 < x < 2.5 and 0 < y < 2.0, was discretized on a structured grid with a node size of 2500 ×2000, which provides sufficient resolution of the flow gradient structure. The
governing equations were solved in conservative divergence form [12] using a
special computational code based on complex conservative difference schemes of
second order accuracy in both space and time [14]. The numerical scheme uses a
five-point Lax-type stencil on a shifted uniform grid, where both the primary
conservative variables (density, momentum, energy) and their first spatial
derivatives with respect to x and y are treated as independent
unknowns and reconstructed simultaneously. It was implemented in the
FlowView code package [15]. The curved boundary of the
aerodynamic body is embedded into a rectangular computational grid using
specially constructed approximations that use fractional cells (1/4, 1/2, 3/4)
adjacent to the full cells, ensuring strict conservation of mass, momentums and
energy in the entire computational domain, including the near-wall regions. The
grid convergence tests are described in [12]. The determining parameters of the oncoming flow and normalizing coefficients are presented in
Table 1.
Table 1. Determining parameters of the oncoming flow and normalizing coefficients
|
Parameter
|
Dimensional value
|
Non-dimensional value
|
Normalizing value
|
|
Freestream Mach number M∞
|
|
6.8
|
|
|
Adiabatic index in oncoming flow γ∞
|
|
1.217
|
|
|
Reynolds number Re
|
|
4558.9
|
|
|
Prandtl number Pr
|
|
0.623
|
|
|
Freestream gas density ρ∞
|
0.040793 kg/m3
|
1.0
|
ρn=ρ∞
|
|
Freestream gas pressure p∞
|
3.1×10³ Pa
|
1.0
|
pn=p∞
|
|
Freestream gas temperature T∞
|
1200 K (926.85 °C)
|
1.0
|
Tn=T∞
|
|
Body’s diameter D
|
3×10⁻² m
|
1.0
|
ln=D
|
|
Freestream gas velocity u∞
|
2067.96 m/s
|
7.502
|
un=(pn/ρn)1/2=275.668 m/s
|
|
Time t
|
|
1.0
|
tn=ln/un=108.827 μs
|
|
Specific power in the plasma region q
|
384.06×10⁶ kW/kg
|
550
|
qn=pn/(ρntn)=0.698299×106 kW/kg
|
|
Adiabatic index in the plasma region γs
|
|
1.31
|
|
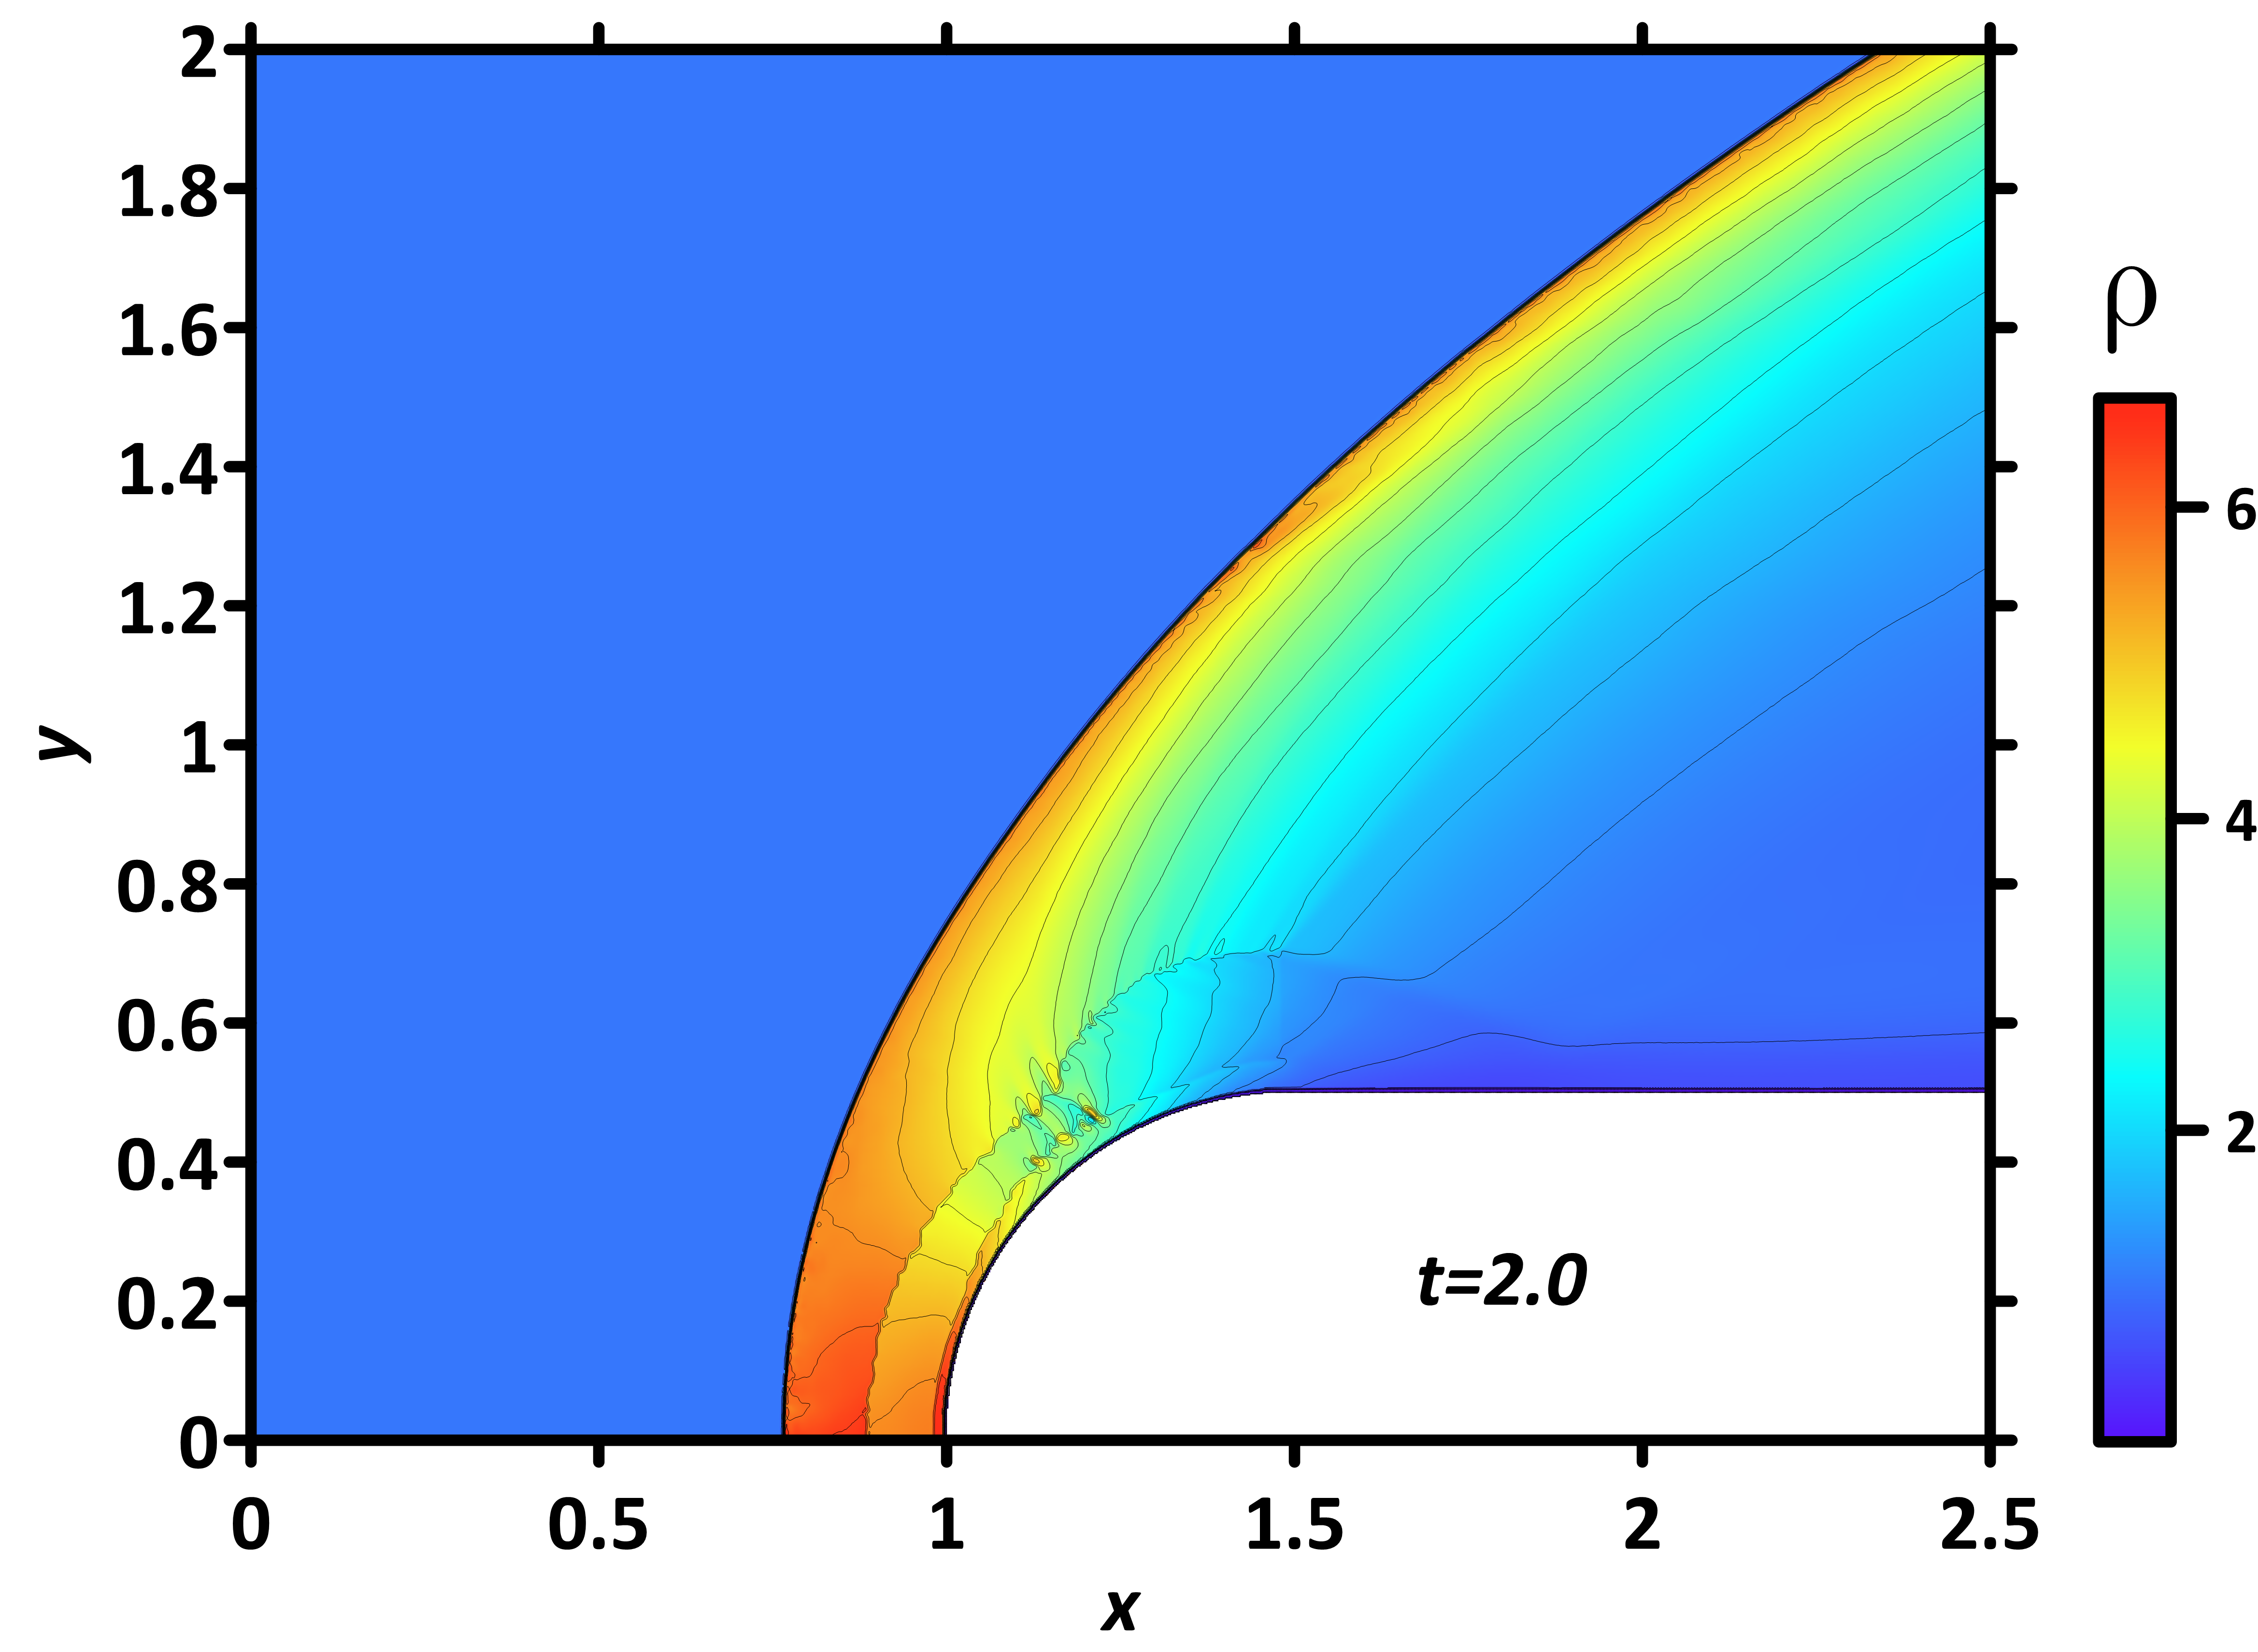
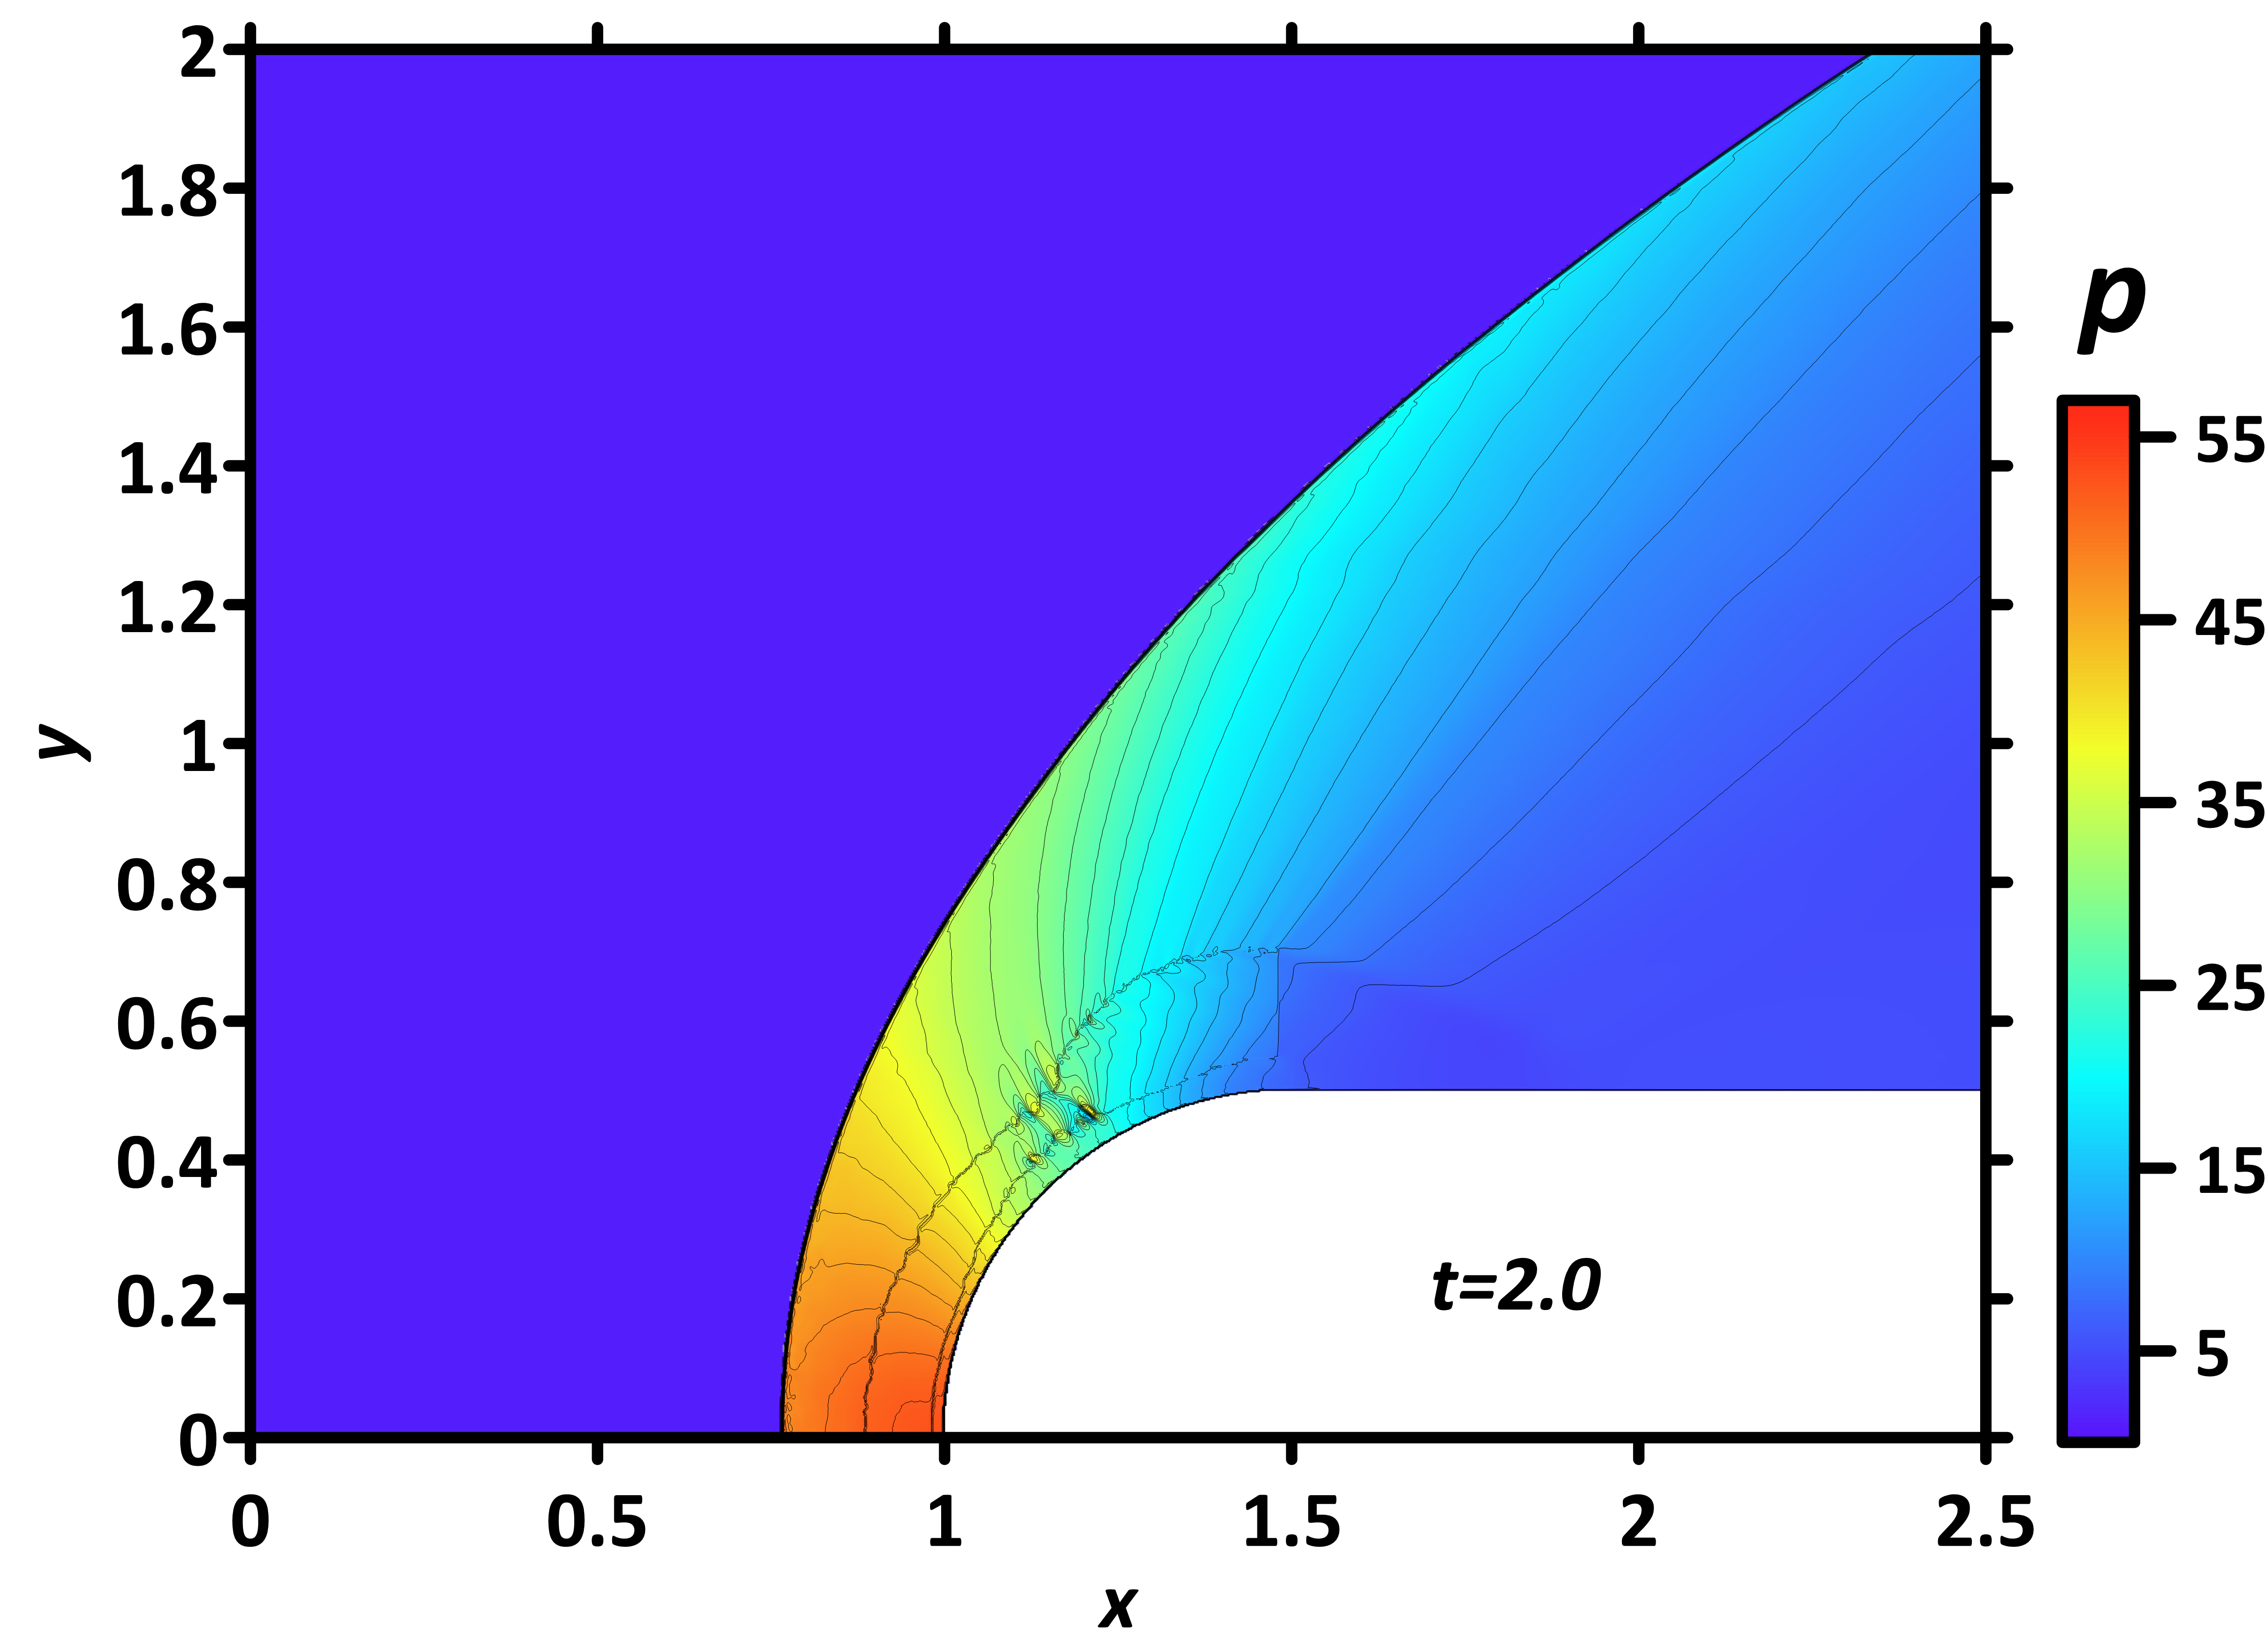
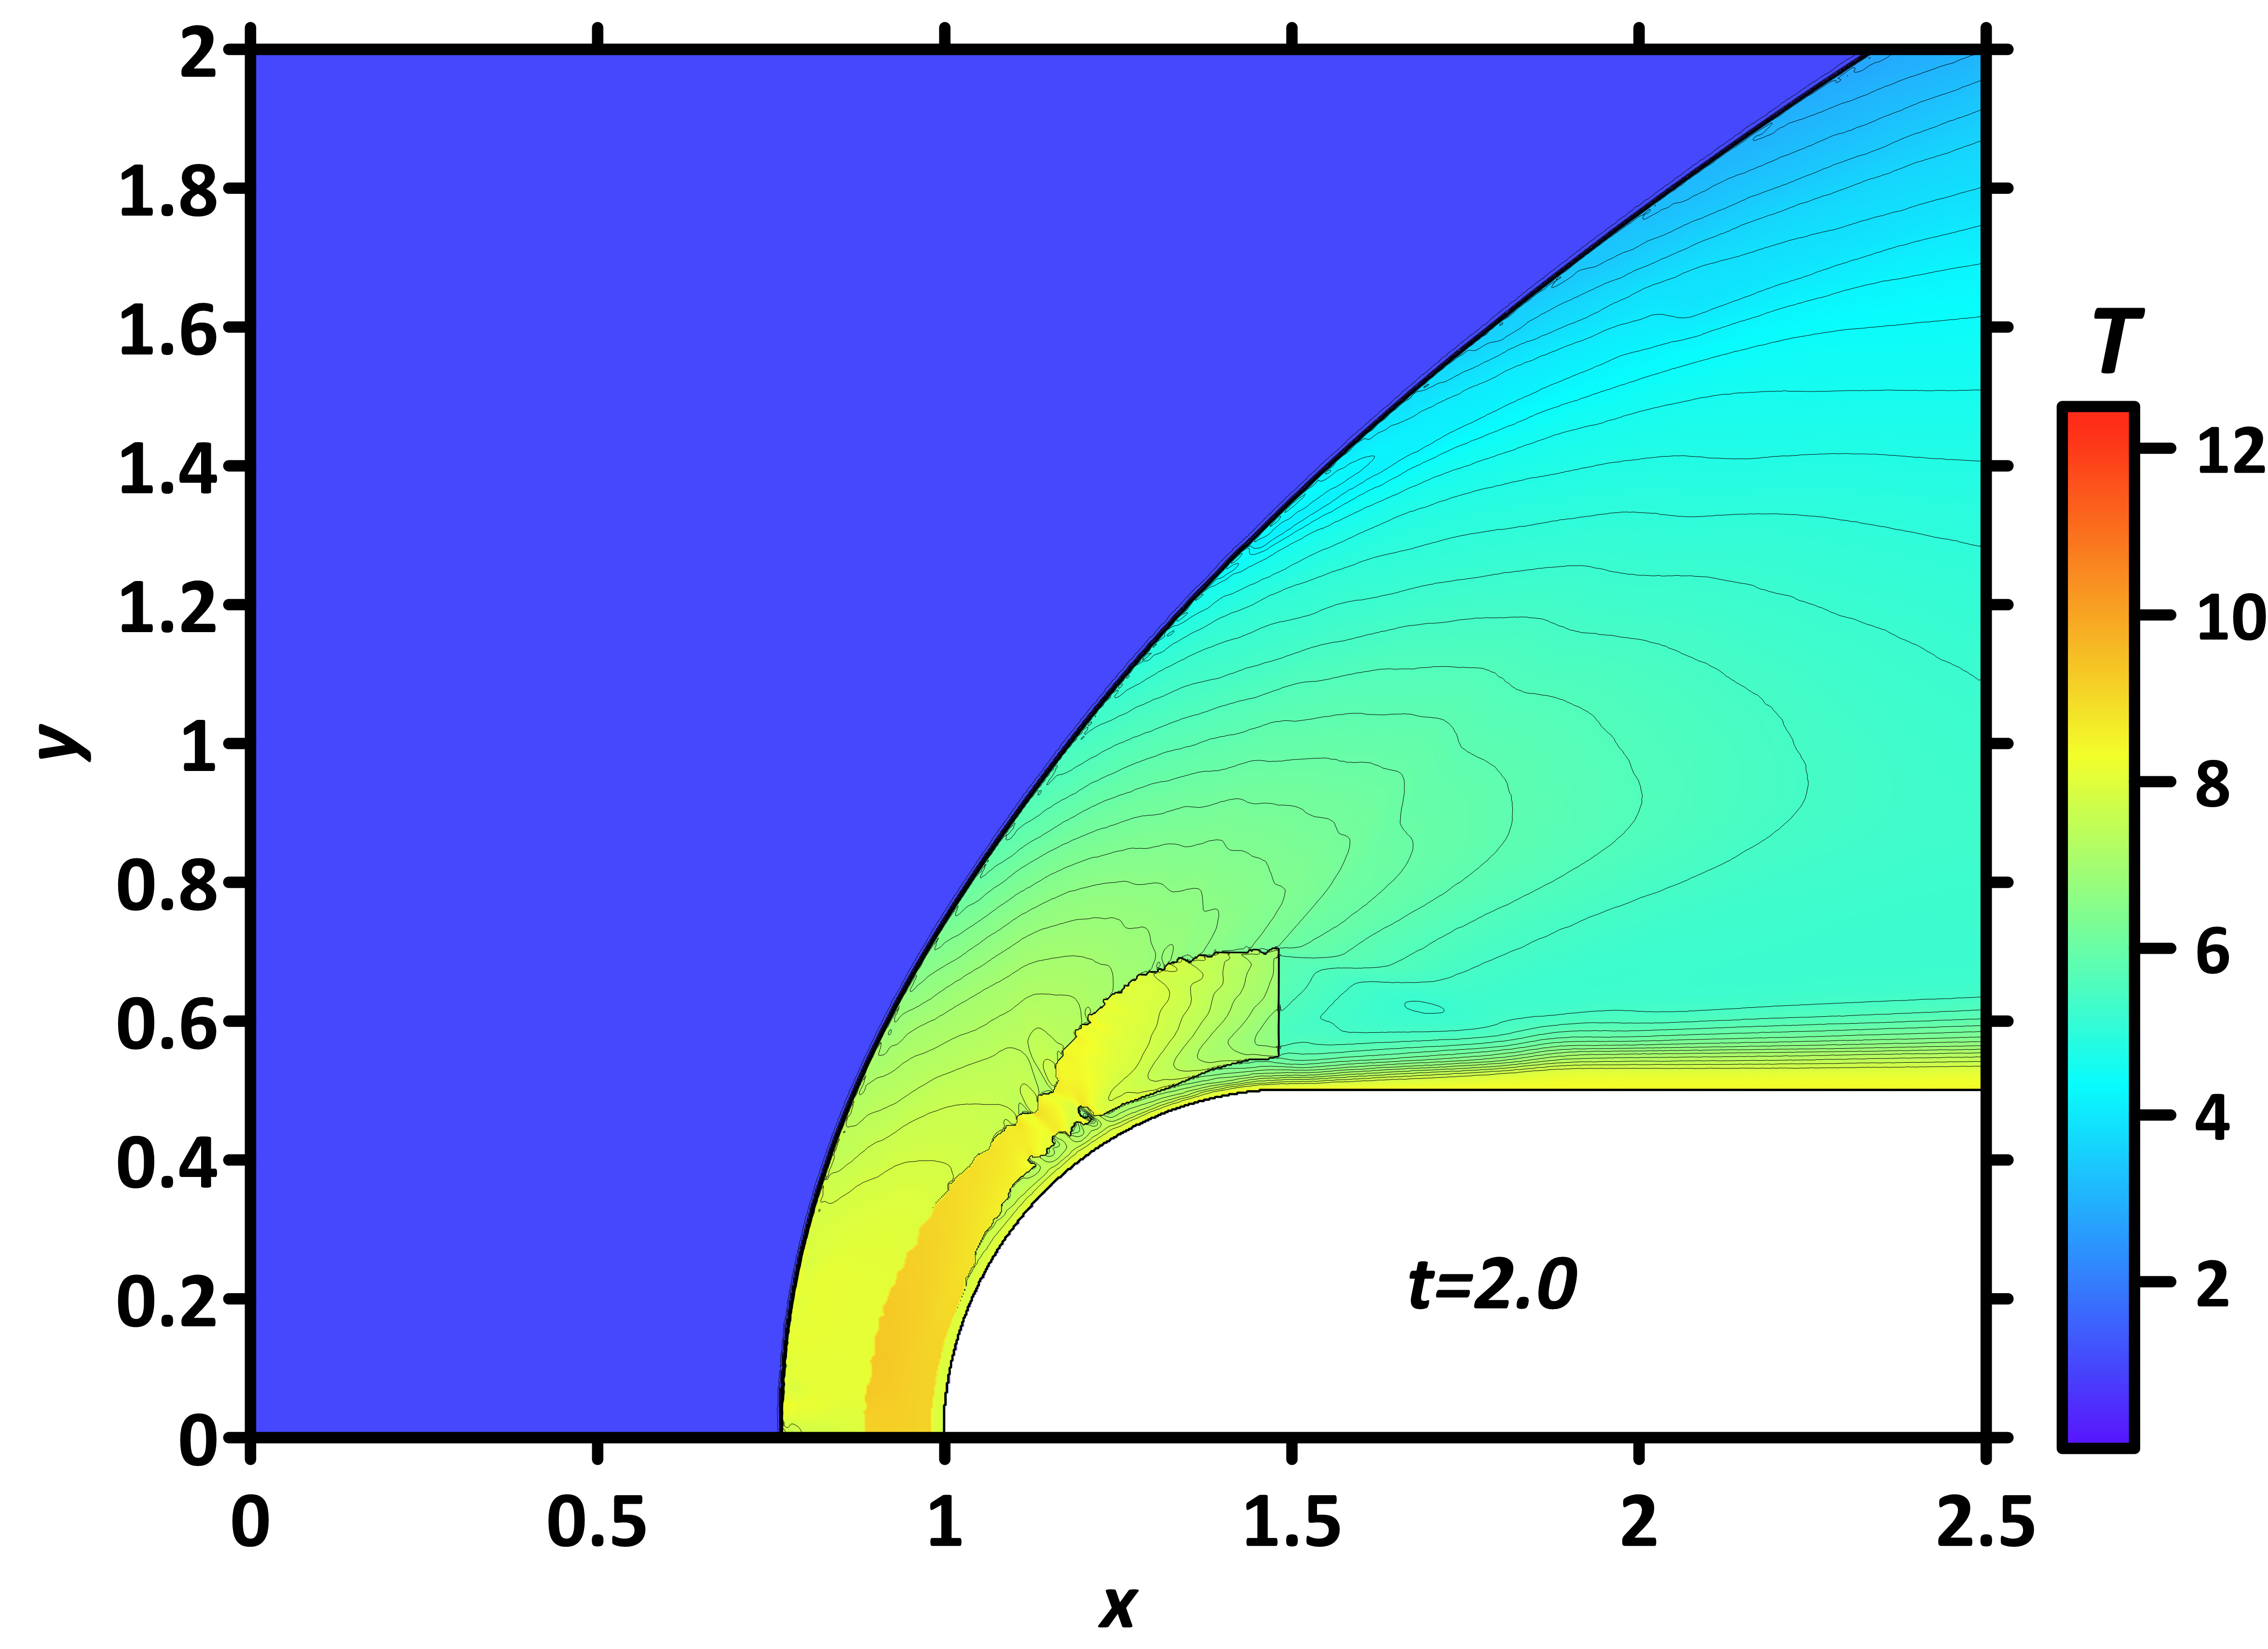
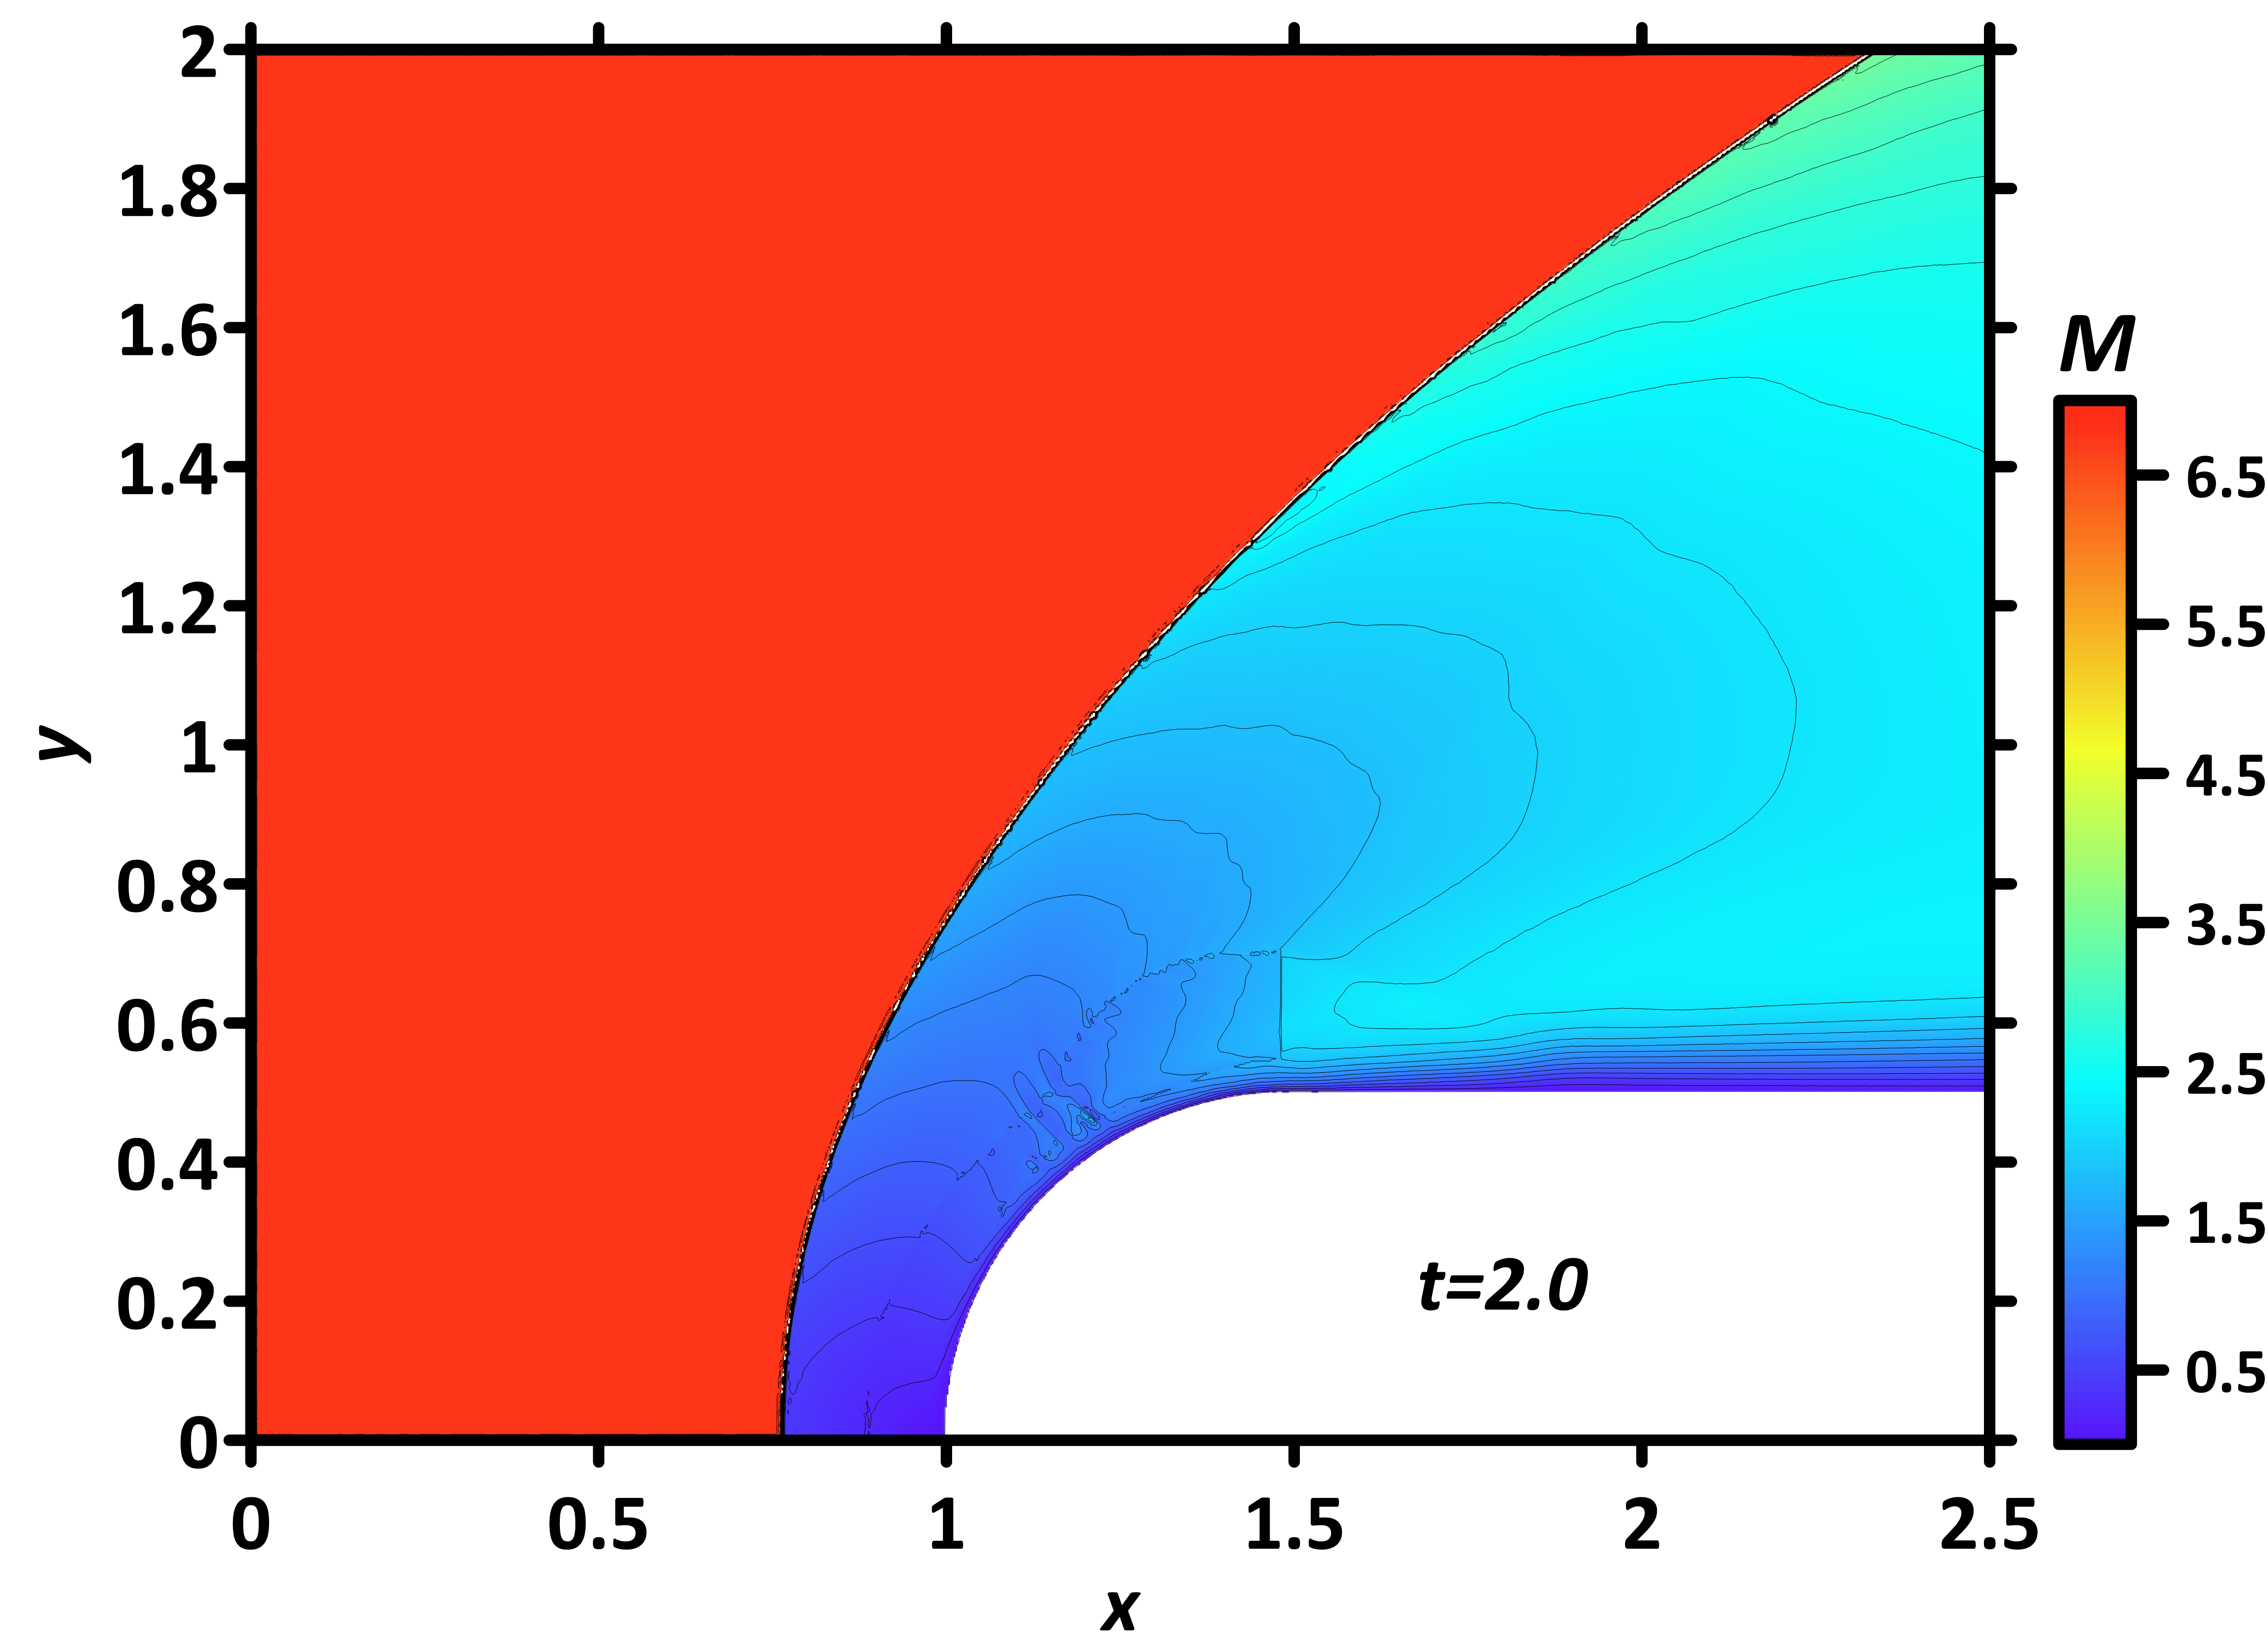
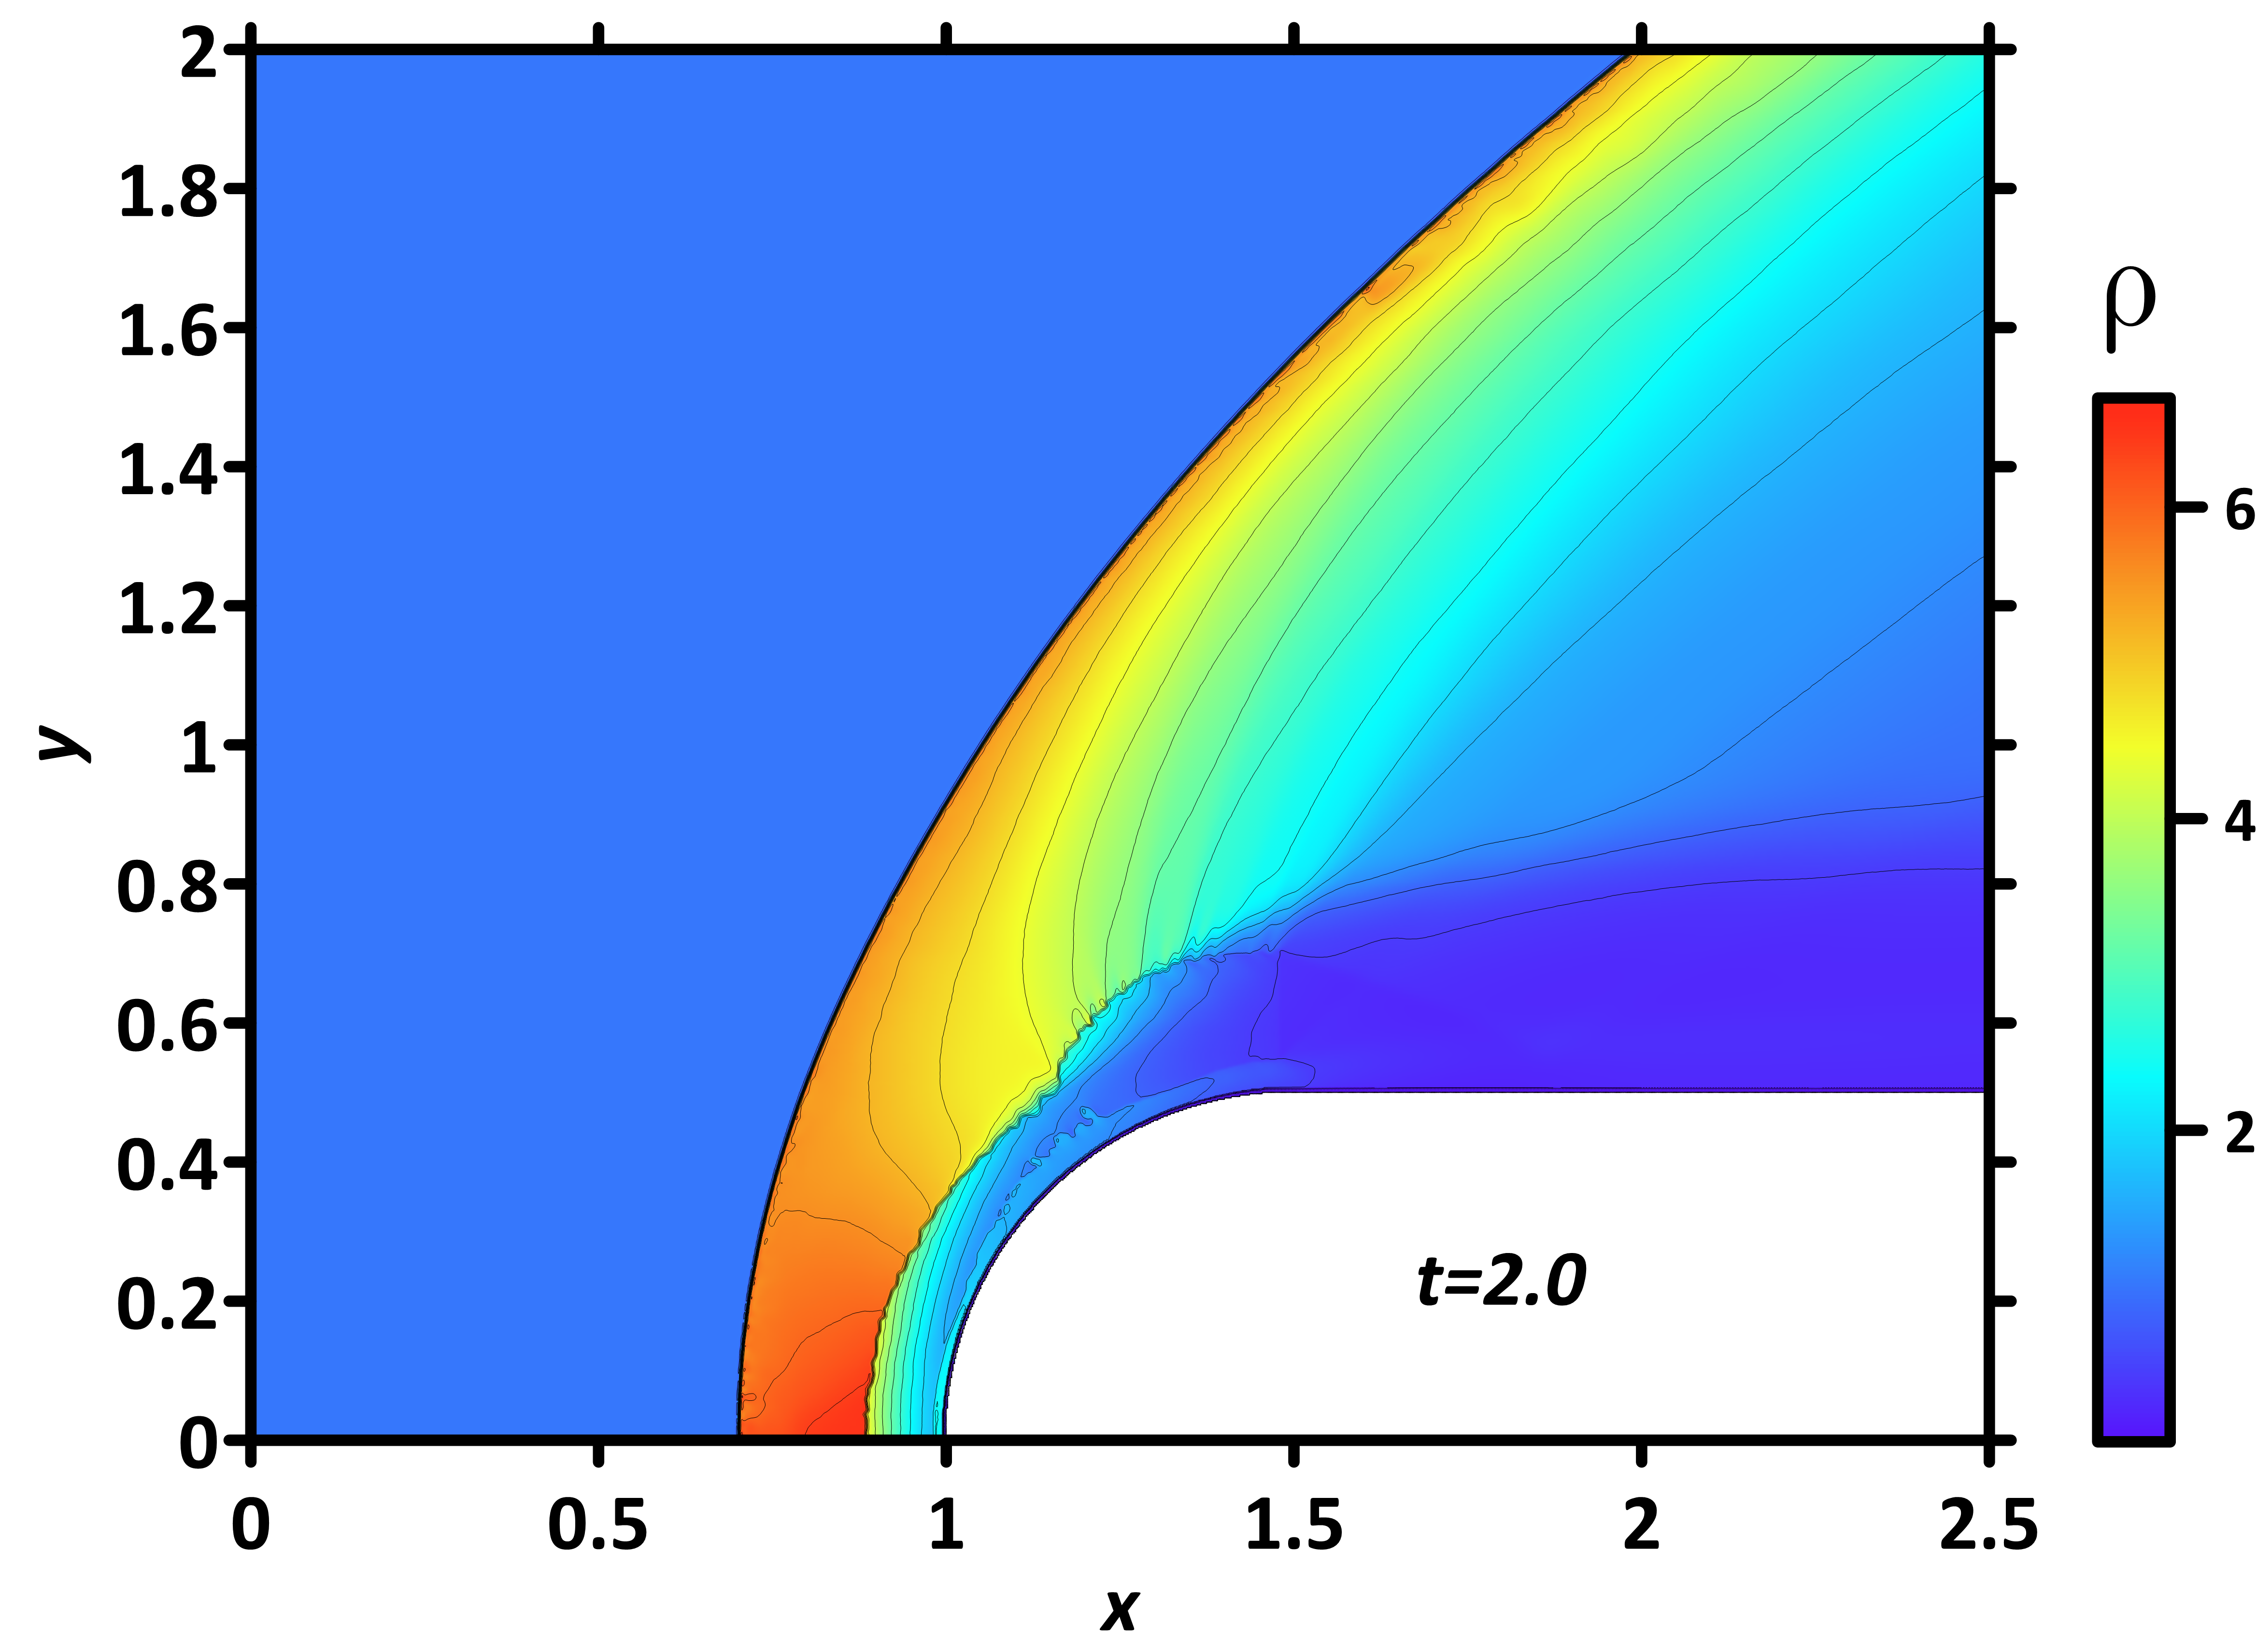
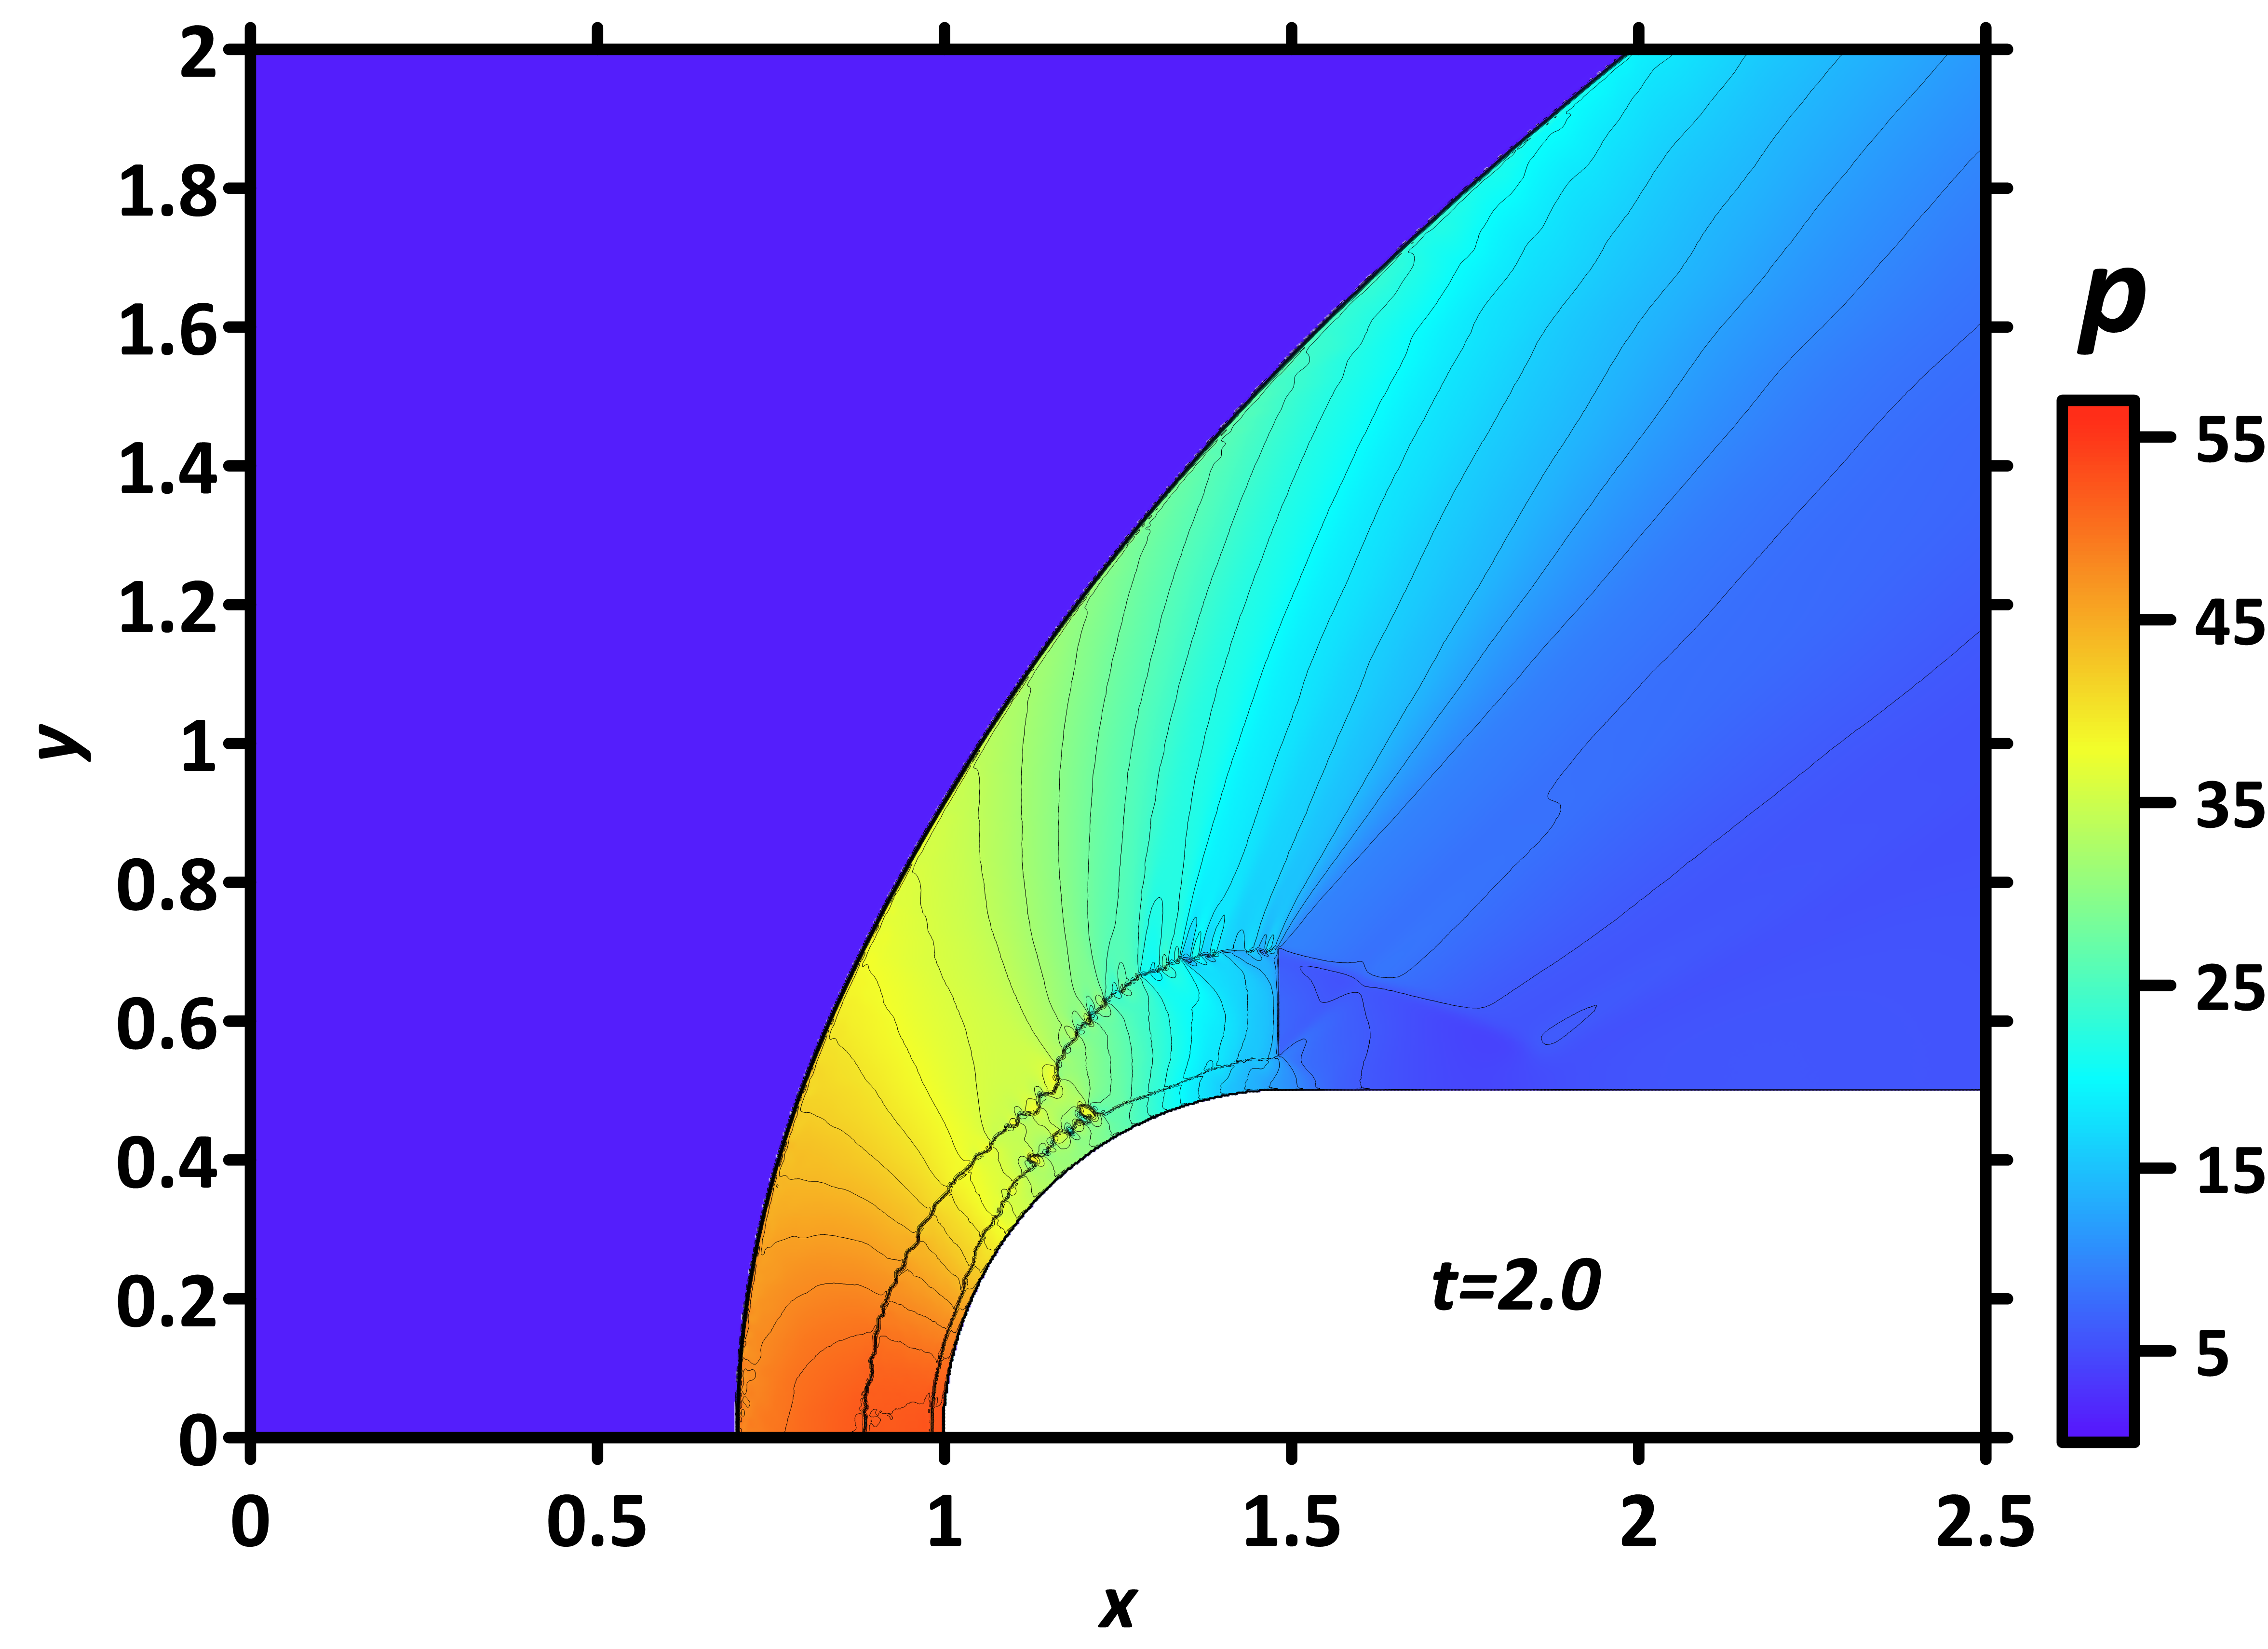
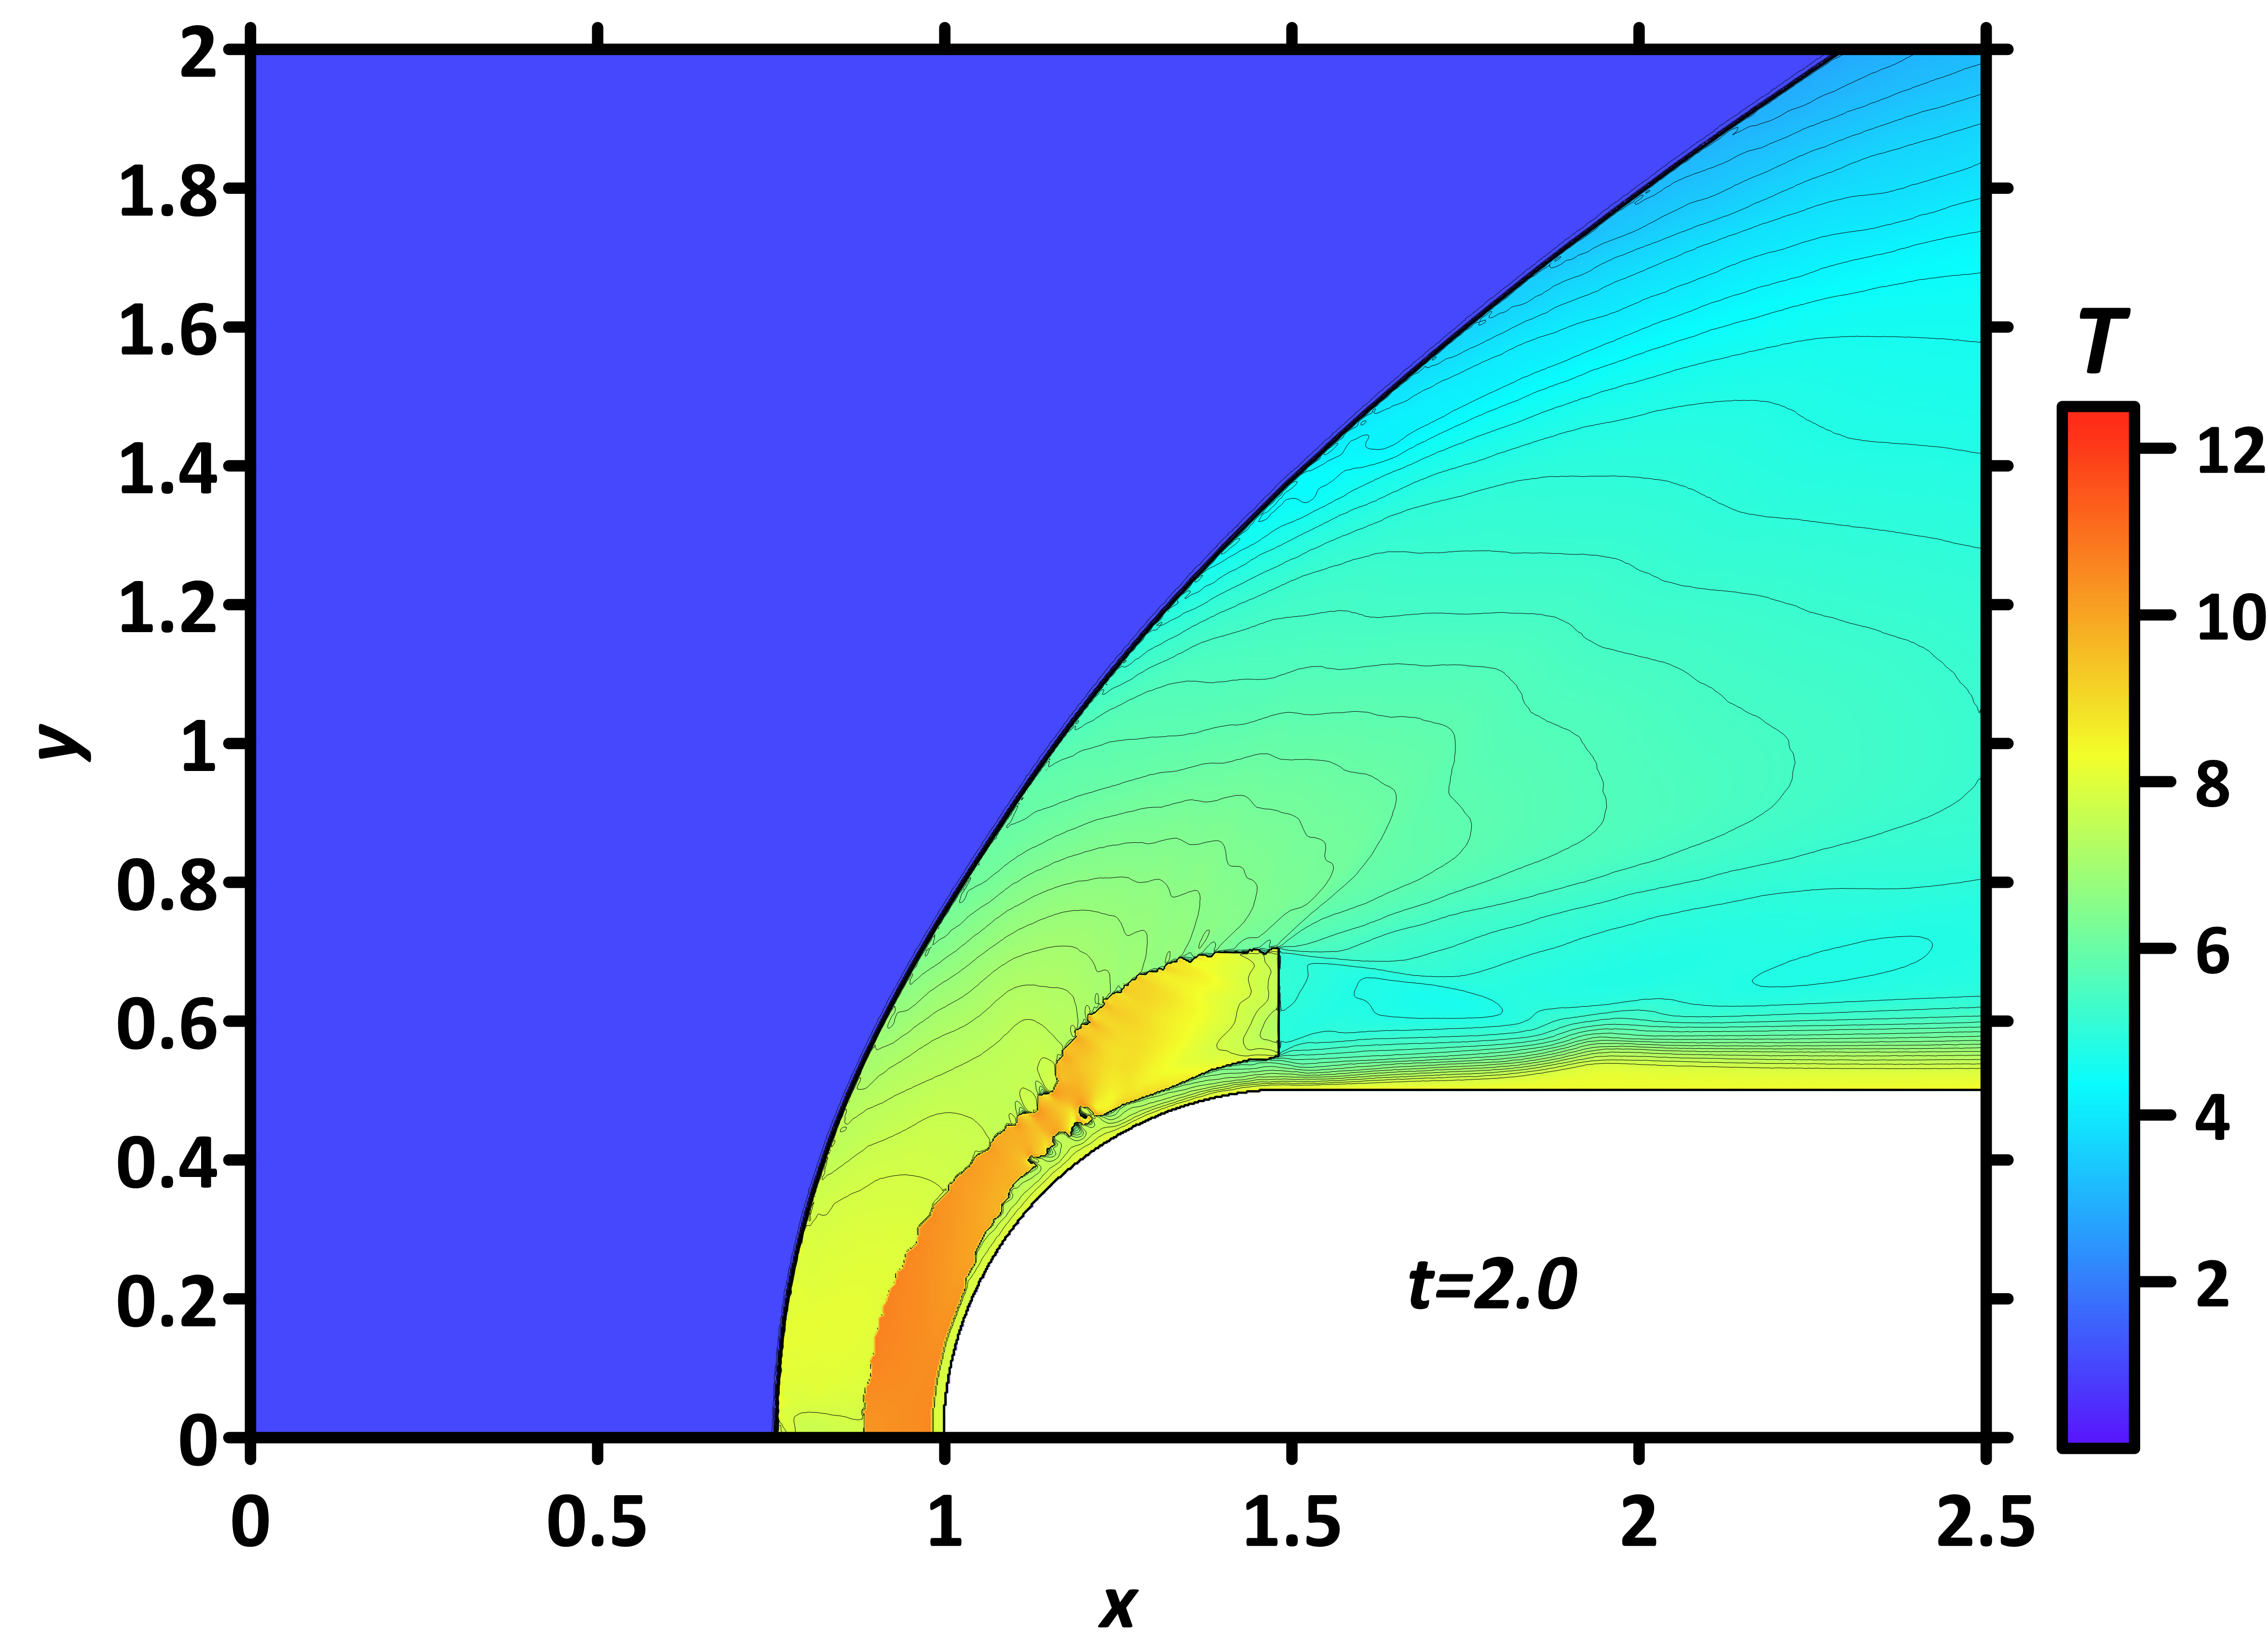
The fields of density,
pressure, temperature, and local Mach number are shown in Fig. 7 for the
steady flow mode at t=2.0, γs=1.258 [12] and
q = 0 (without the discharge). It is evident that the initial
ionization in front of the body influences the flow density and temperature to
a greater extent than other parameters. Besides, one can see that the
subsonic zones of high temperature are formed near the horizontal boundaries of
the body. The value Re=4558.9 in Table 1 for xenon sets the scale of the
viscous terms in the dimensionless Navier-Stokes system with the adopted normalization of variables
which is consistent with the experimental parameters (See Table 1).
The experiment is carried out in an expanding nozzle at corresponding relatively
low pressure and density of the incident flow, so we used the experimental
parameters of flow at the location where the model is placed in the nozzle.
Fig. 7. Fields of density, pressure, temperature and local Mach number
for q=0, steady flow
The calculated fields of
density, pressure, temperature, and local Mach number for a steady supersonic
flow at the specific discharge power of
q = 550 are presented in
Fig. 8. Fig. 8 illustrates the steady-state distributions of key flow
parameters, including density (a), pressure (b), temperature (c), and local
Mach number (d), evaluated at the specific discharge power of
q = 550. As expected, the BSW generates a pronounced region of compressed gas
behind its front, characterized by significantly increased
pressure and temperature values, consistent with classic hypersonic flow
behavior in the absence of energy addition. However, the introduction of energy
deposition alters this structure markedly. Adjacent to the body’s frontal
surface, a well-defined zone of rarefied gas forms, exhibiting reduced density
but notably higher temperatures compared to the surrounding flow. This thermal
layer arises due to the energy input’s influence on local gas dynamics, effectively
modifying the BSW standoff distance and creating a distinct
thermophysical boundary near the body.
The determining parameters of the flow include the discharge current
I = 1196 A, the experimental power Pexp = 150.70 kW, the
dimensionless specific power in the plasma region q = 550, and the
specific heat ratio of the plasma region γs = 1.31 [12].
The results of the
calculations examining the effect of the area of the discharge energy on steady
BSW position at t = 2.0 are shown in Fig. 9. This analysis considers a
modified adiabatic index (γs = 1.31) within the discharge
plasma region. The steady-state density fields show a correlation that
increasing the specific power q, produces an increase in the
standoff distance of the BSW. The mechanism of such a phenomenon was described
in [16] for an air flow. This relationship is a consequence of the BSW forming
within a region preheated by the discharge. Due to the significantly faster
timescale of plasma formation compared to gas-dynamic evolution, the initial
discharge parameters critically determine the BSW formation in the unsteady
phase and, consequently, its final steady-state properties.
Fig. 8. Fields of density, pressure, temperature and local Mach number for q = 550, steady flow
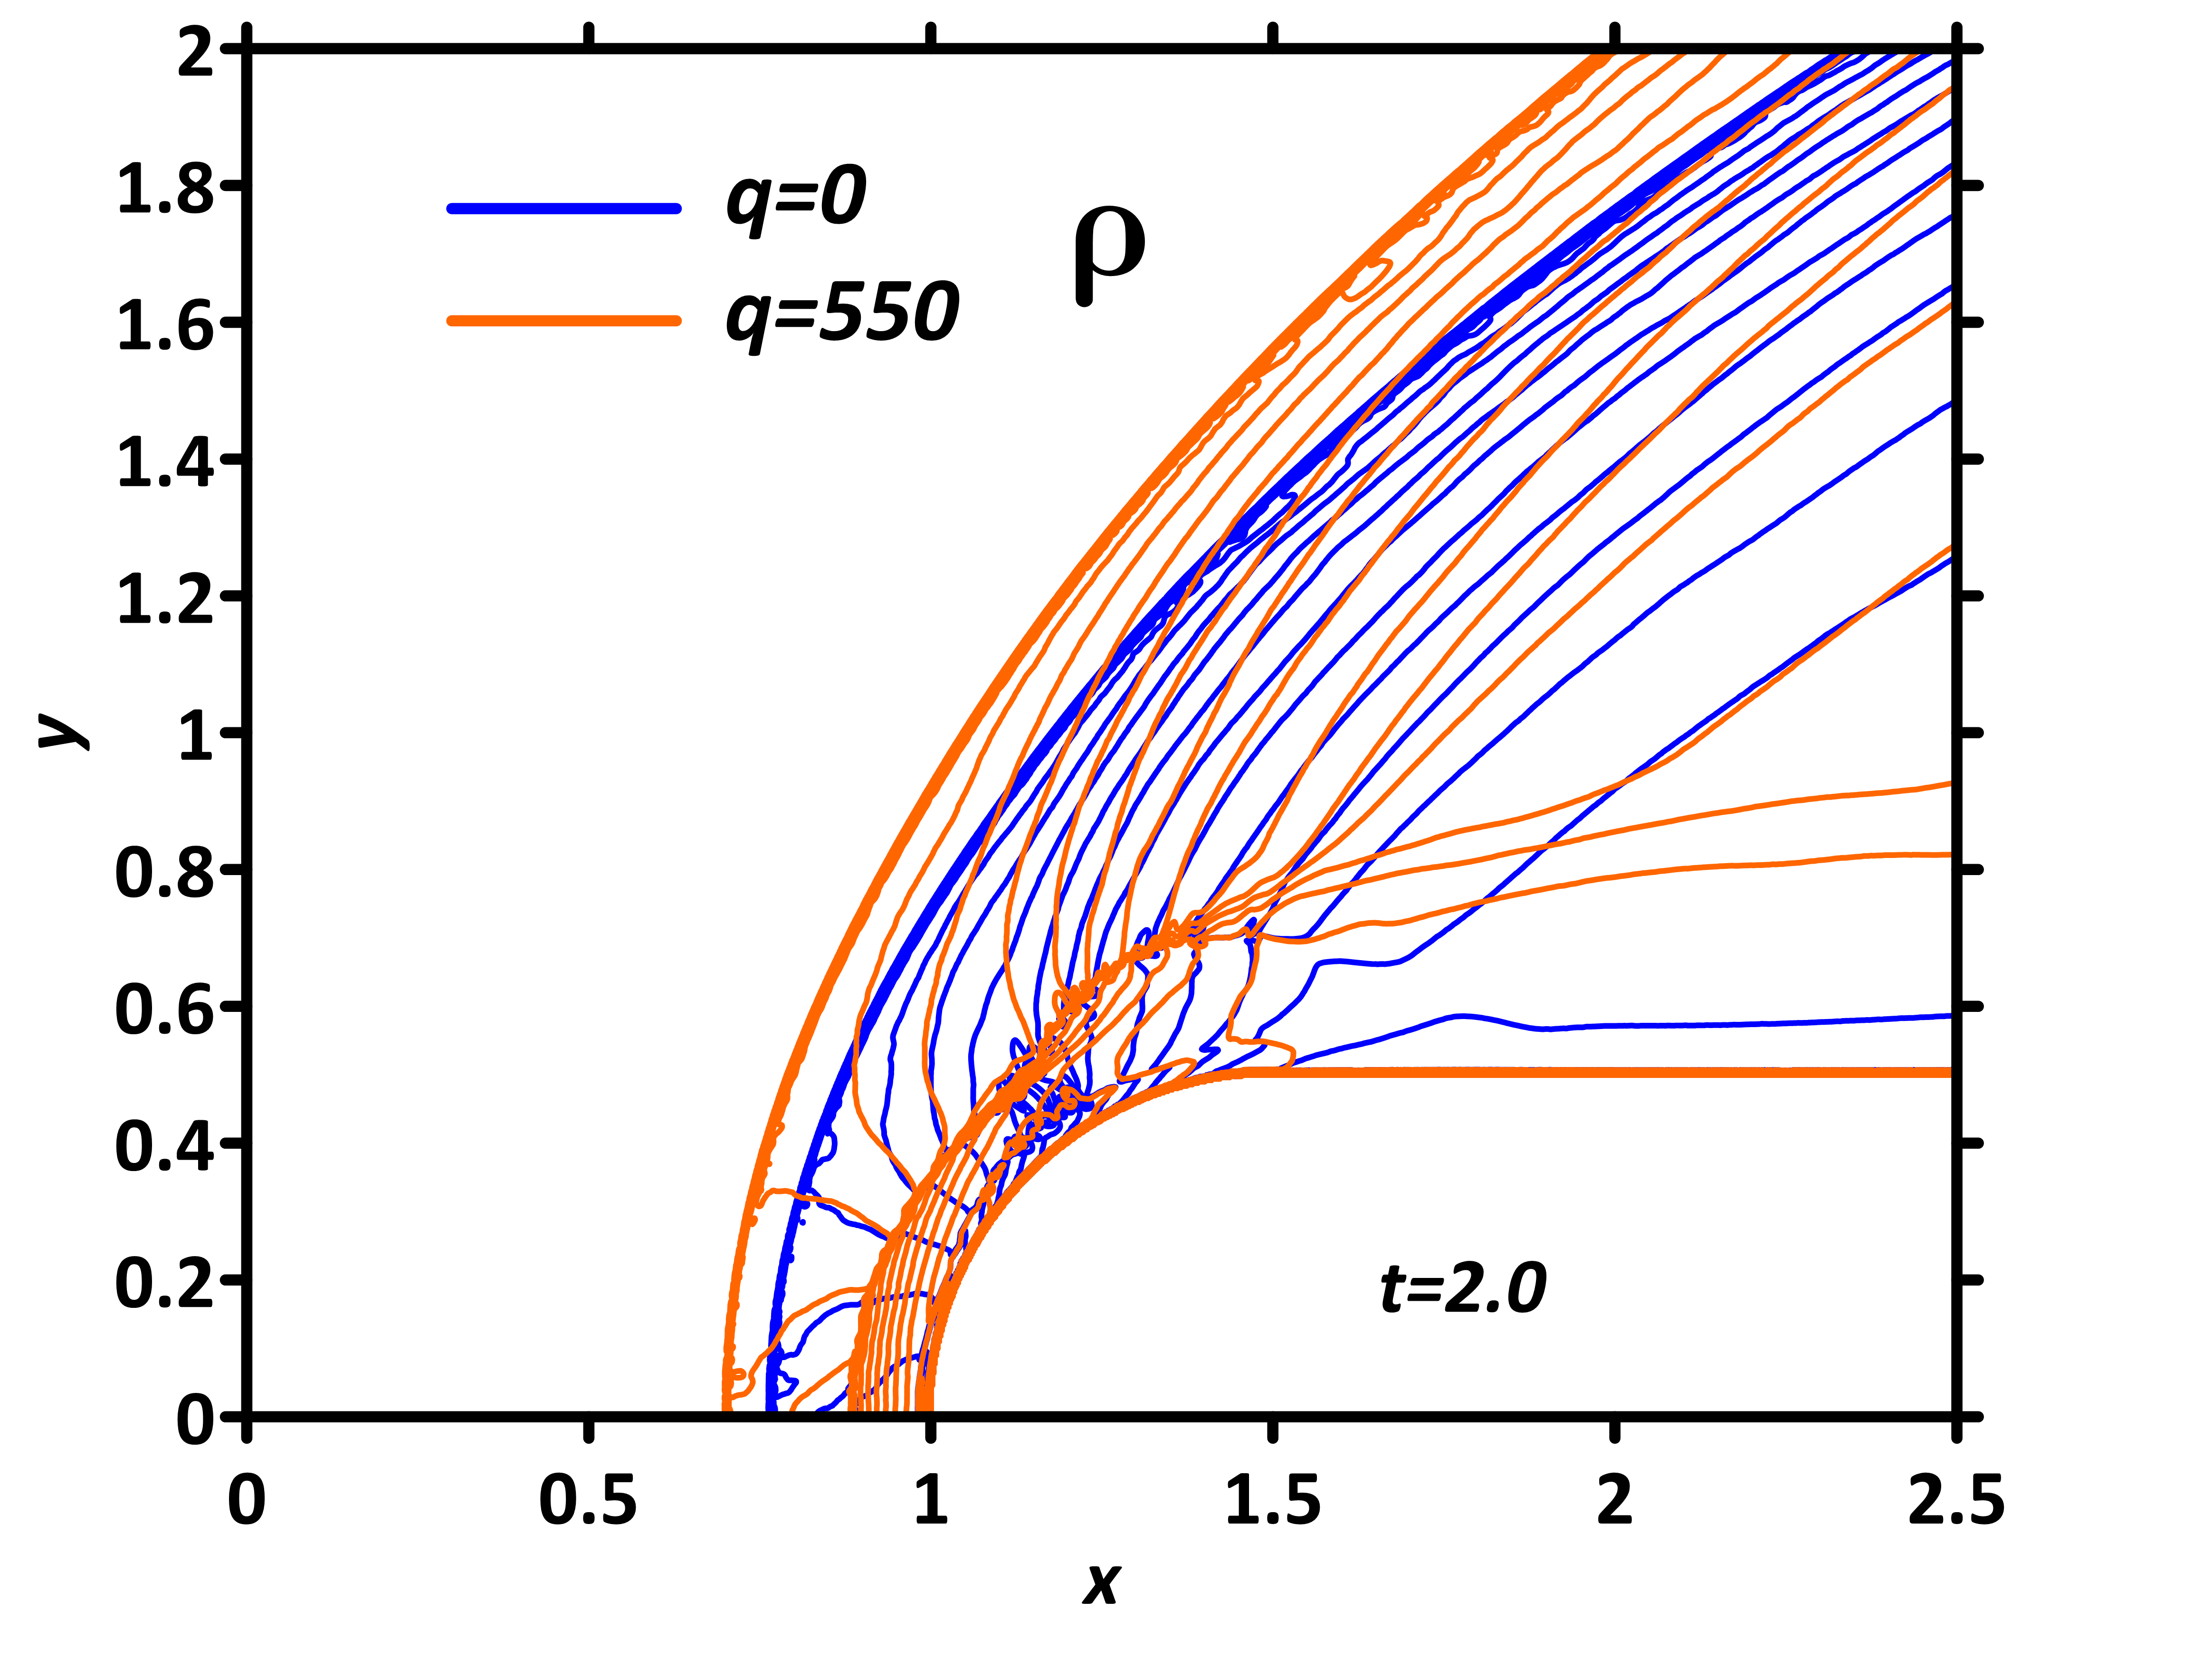
Fig. 9. Isochores of density field for q = 0 and q = 550
The isochores of the calculated numerical solution for the steady-state flow regime are
superimposed on the experimental schlieren image for
direct comparison (Fig. 10). It can be stated the sufficient agreement
between the experimental image and the numerical result on the location of the BSW
front on the axis of symmetry, and, in addition, the calculated discharge power
was Pcalc = 152.18, which differs from the experimental value
Pexp = 150.70 kW by less than 1%.
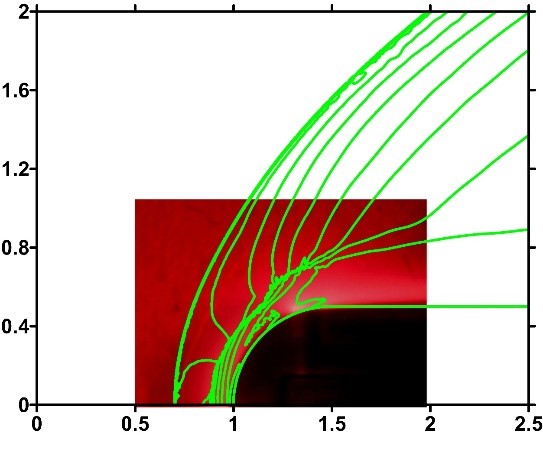
Fig. 10. Comparison of numerical flow pattern with
schlieren image under the influence of a near-surface discharge in xenon,
I =1196 A, Pexp = 150.70 kW
The effect of localized energy
deposition on the parameters of a high-speed flow was analyzed using a combined
approach, including an experimental and numerical study based on the conducted
image processing algorithm for extracting the geometry of the discharge energy
deposition region. The process is simulated by solving two-dimensional Navier-Stokes
equations with an energy deposition source, demonstrating an increase in bow shock
wave standoff distance consistent with
the experimental data. The adequacy of the model is confirmed by the good
agreement between the calculated and experimental values of the discharge power
and the location of the steady bow shock wave. It is shown that the presented
image processing method for the schlieren flow pictures allows to increase
the accuracy of the predictable flow simulation giving information on the flow
characteristics, such as the position of the bow shock wave, density,
pressure, temperature and local Mach number fields, etc. This provides the
basis for the development of modern active control systems for high-speed
flows.
The research was carried out
using the infrastructure of the Shared Research Facilities «High Performance
Computing and Big Data» (CKP «Informatics») of FRC CSC RAS (Moscow).
1. Li G., Agir M.B., Kontis K., Ukai T., Rengarajan S. Image processing techniques for shock wave detection and tracking in high speed schlieren and shadowgraph systems // J. Phys.: Conf. Ser. 2019. Vol. 1215. P. 1–9. DOI: 10.1088/1742-6596/1215/1/012021.
2. Barinov Yu.A. A new method of processing background oriented schlieren images // Tech. Phys. Lett. 2019. Vol. 45, No. 6. P. 632–634. DOI: 10.1134/S106378501906021X.
3. Fujimoto T.R., Kawasaki T., Kitamura K. Canny-Edge-Detection/Rankine-Hugoniot-conditions unified shock sensor for inviscid and viscous flows // J. Comput. Phys. 2019. Vol. 396. P. 264–279. DOI: 10.1016/j.jcp.2019.06.071.
4. Znamenskaya I.A. Methods for panoramic visualization and digital analysis of thermophysical flow fields. A review // Sci. Vis. 2021. Vol. 13, No. 3. P. 126–158. DOI: 10.26583/sv.13.3.13
5. Wu J., Zhang Z., Zhu Y., Tang Y., Guo R., Chen J., Xing Z. An accurate temperature field reconstruction method using schlieren imaging and optical flow for high-speed flow fields // Phys. Fluids. 2025. Vol. 37, No. 1. Art. 016105. DOI: 10.1063/5.0248350
6. Doroshchenko I.A. Analysis of the experimental flow shadowgraph images by computer vision methods // Numerical Methods and Programming. 2023. Vol. 24, No. 2. P. 231–242. DOI: 10.26089/NumMet.v24r217
7. Doroshchenko I.A., Znamenskaya I.A., Sysoev N.N., Lutsky A.E. High-speed flow structures detection and tracking in multiple shadow images with matching to CFD using convolutional neural networks // Sci. Vis. 2022. Vol. 14, No. 4. P. 1-11. DOI: 10.26583/sv.14.4.01
8. Mei X., Wang Q. A physics-oriented shadowgraph motion estimation algorithm for turbulent flow structures // Aerosp. Sci. Technol. 2024. Vol. 145. P. 1-10. DOI: 10.1016/j.ast.2024.108888
9. Guo M., Deng X., Ma Y., Tian Y., Le J., Zhang H. Hypersonic inlet flow field reconstruction dominated by shock wave and boundary layer based on small sample physics-informed neural networks // Aerosp. Sci. Technol. 2024. Vol. 150. P. 1-14. DOI: 10.1016/j.ast.2024.109205
10. Du H., Yang J., Yang M., Niu T. Image processing based disturbance shock wave in shock tube characteristic extraction method // J. Mod. Opt. 2025. P. 1–11. DOI: 10.1080/09500340.2025.2493200
11. Hanfy A.H., Flaszynski P., Kaczynski P., Doerffer P. Advancements in shock-wave analysis and tracking from schlieren imaging. 2024. DOI: 10.2139/ssrn.4797840 (preprint)
12. Azarova O.A., Lapushkina T.A., Kravchenko O.V. Impact of a near-surface plasma region on the bow shock wave and aerodynamic characteristics of a high-speed model in xenon // Fluids. 2024. Vol. 9, No. 12. P. 277. DOI: 10.3390/fluids9120277
13. Kravchenko O.V., Azarova O.A., Lapushkina T.A. Image-based processing simulation of shock wave propagation through the area of ionization instability // Journal of Physics: Conference Series. 2021. Vol. 2127, No. 1. Art. 012013. DOI: 10.1088/1742-6596/2127/1/012013
14. Azarova O.A. Complex conservative difference schemes for computing supersonic flows past simple aerodynamic forms // Comput. Math. Math. Phys. 2015. Vol. 55. P. 2025–2049. DOI: 10.1134/S0965542515120039
15. Azarova O.A. FlowView software package // Russian Patent Certificate No. 2022667647, 22.09.2022, 2022. URL: https://elibrary.ru/tnixmw
16. Azarova O.A., Lapushkina T.A., Shustrov Y.A. Near-surface gas discharge effect on a steady bow shock wave position in a supersonic flow past a cylindrically blunted body in the air // Phys. Fluids 2022. Vol. 34. P. 066117.