Daily, people inhale pathogenic and anthropogenic
particles and exogenous molecules that disseminate through the respiratory
tract; some of them can penetrate the blood vessels and invade the whole
organism. Depending on their location, pathogens can induce local or systemic
inflammation [1, 2].
Detection of the precise location of pathogens or
drugs in the lungs during an inflammation is essential for the development of
the optimal treatment approach. Different experimental models are explored for
this purpose. Mouse models of the diseases are well established and informative
in the study of the inflammatory properties in the lungs. Moreover, imaging of
the whole-mount organs, e.g., lungs, of the small laboratory animals such as
mice is a convenient and perspective technique [3].
Confocal laser scanning microscopy is a perfect
tool for the visualization of tissues and organs of laboratory animals.
However, the limitation of the approach is the laser light-scatter; therefore,
imaging of deep tissue regions is limited to 100 µm. Using two-photon
microscopy with long wavelengths (800–1200 nm) reduces sample damage and allows
for imaging deep tissue regions (250–500 µm) [4, 5].
Tissue clearance can help to avoid the loss of
resolution. Multiple tissue clearing techniques were developed during the last
century. Mostly, these methods are based on the treatment of specimens with
organic solvents or hydrogels [4, 6].
To properly visualize pathogens or encapsulated
drugs in the depth of tissues or organs, researchers use fluorescent labels
that must be bright and stable. Moreover, immune cells and structural tissue
cells should also be visualized. Confocal and two-photon microscopy are
characterized by autofluorescence that can be used for the detection of
metabolic molecules such as NADH and tryptophan. On the other hand,
autofluorescence can give a false-positive signal and limit the number of
potential fluorophores for cell, pathogen, and drug detection [5, 7].
Second harmonic generation (SHG) microscopy, which
is based on two-photon microscopy, has become a key label-free technique for
imaging with many applications in biomedical sciences. SHG microscopy is a non-fluorescent
technique. SHG has been reported for a variety of molecules (SHG active
molecules a.k.a. harmonophores), such as collagen, myosin, microtubules, silk,
starch, and cellulose. These molecules have non-centrosymmetric structures and
can form filaments. In the biological specimens, SHG can be used in combination
with fluorescent staining [5, 8].
In the present study, based on the combination of
SHG and fluorescent two-photon microscopy, we developed an approach for imaging
the airways, vessels, and pathogens in the optically cleared mouse lungs.
To visualize pathogens in the lung, particularly
inside the airways and vessels, spores of opportunistic fungi Aspergillus fumigatus
were in advance labeled with succinimidyl ester of Alexa Fluor
594 as we described previously [9]. Spores were then applied to mice via the oropharyngeal
route in a total volume of 50 µL per mouse and a dose of 1 × 10⁸
spores/mL. Twenty-four hours after, mice were sacrificed with cervical
dislocation and the lungs were extracted, fixed with 2% paraformaldehyde
overnight, stained with Alexa °Fluor° 488-conjugated streptavidin,
and underwent optical clearing using a 1:2 v/v mixture of benzyl alcohol and
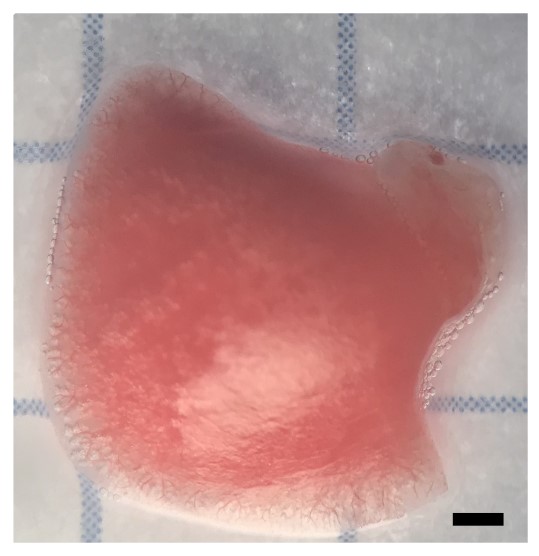
benzyl benzoate. Mouse lung lobe before and after optical clearing is presented
in the Figure 1 (a) and (b), respectively.
|
|

|
|
a)
|
b)
|
Fig. 1. Right superior lobe of the mouse lungs before (a) and
after (b) optical clearing.
Within 24 h optically cleared lung lobe underwent
examination using two-photon microscopy.
In the present study, we used an inverted Zeiss
LSM 780 that was additionally equipped with an Insight DeepSee-pulsed solid-state
laser with ultrashort pulses (<150 fs) and a spectral range from 680 nm to
1300 nm, which enables two-photon microscopy. The laser system can be used for
different purposes, such as fluorescence lifetime measurements, cell and tissue
imaging [10-12].
For the simultaneous visualization of Alexa
°Fluor° 488 and Alexa °Fluor° 594, the optimal wavelength for the two-photon
laser was selected. In two-photon microscopy, each photon has half the energy of
the corresponding single-photon absorption event [13]. In accordance with this (see
formula (1) and Figure 2), the optimal wavelength for the effective excitation
of Alexa °Fluor° 488 is 976 nm, and for Alexa
°Fluor° 594 - 1188 nm. To visualize Alexa °Fluor° 488 and Alexa
°Fluor° 594 simultaneously, the optimal wavelength was selected in the range from 976 to
1188 nm empirically and set to 1050 nm.

where
 – is the wavelength of single-photon excitation,
 – is the optimal wavelength for two-photon excitation.

Fig. 2. The Yablonsky diagram. One-photon excitation (left) and two-photon
excitation (right) (adopted from [13]).
Zeiss LSM 780 is equipped with a 34-channel QUASAR
detector (Zeiss), ranging from 490 to 695 nm. Based on the analysis of the
emission and excitation spectra of Alexa °Fluor° 488 and Alexa
°Fluor° 594,
we used only 9 channels (490, 508, 526, 544, 561, 579, 597, 615, and 633 nm)
that enabled an essential reduction of the file size and processing time.
To obtain high-resolution images, ×10 (NA =0.3) or ×20 (NA =0.5)
objectives were used. Images were acquired in
Tile-Scan mode as Z-stacks, with a resolution of 512 × 512 and a Z-step
of 5 μm.
Before further processing, images underwent
spectral unmixing, which permitted the achievement of the SHG spectra. The emission
peaks of Alexa °Fluor° 488 and Alexa
°Fluor° 594 were
observed at approximately 530 and 610 nm, respectively, as expected from the
known data of the fluorophore emissions. The SHG emission spectrum was obtained
at 515 nm. Emission spectra are shown in Figure 3.

Fig. 3. Representative screen for
spectral unmixing of SHG (cyan), Alexa°Fluor°488 (green), and Alexa°Fluor°594
(red).
Three-dimensional images of the lung specimens
were processed using Imaris 9.8 (Oxford Instruments, UK) software [14]. Imaris
is the image analysis software, perfectly fitted for processing a large scale
of three-dimensional images obtained with confocal laser scanning microscopy [15].
The following steps were performed in Imaris
software:
• creation of a surface based on the Alexa
°Fluor° 488 channel;
• creation of a surface based on the SHG channel;
• dividing the SHG surface into segments with an approximate
diameter of 20 µm;
• filtering the segments using the “Intensity Mean” threshold in the
channel of Alexa °Fluor° 488;
• creation of a mask based on the obtained surface (the surface is
referred to hereafter as the vessel surface);
• creation of spots based on the Alexa
°Fluor° 594 channel;
• filtering the spots using the “Intensity Mean” threshold in the
channel of the vessel surface mask.
The surfaces were created using the “Create
Surface” option as we described previously [9]. This stage also allowed to
remove the noise from the image obtained after spectral unmixing.
When dividing the SHG surface into segments, the
option “Seed Points Diameter” was used. The optimal approximate diameter of the
segment was set to 20 µm based on the relation between the time of the
processing and the accuracy of the vessel surface.
Filtering was performed using an “Intensity Mean” threshold
that split all segments based on the emission intensity into associated and not
associated with the Alexa°Fluor°488 channel. These were not associated were
selected by us as corresponding to the vessels. Based on the selection vessel
surface was created.
The same principle was applied when detecting
pathogen (A.°fumigatus spores) inside the vessels. Spots of the pathogen
were split into associated and not associated with the vessel.
Spectral unmixing was performed as described in Chapter
2.2. Images in SHG and Alexa °Fluor°
488 channels for the whole-mount mouse right lung lobe specimen are presented in Figure 4.
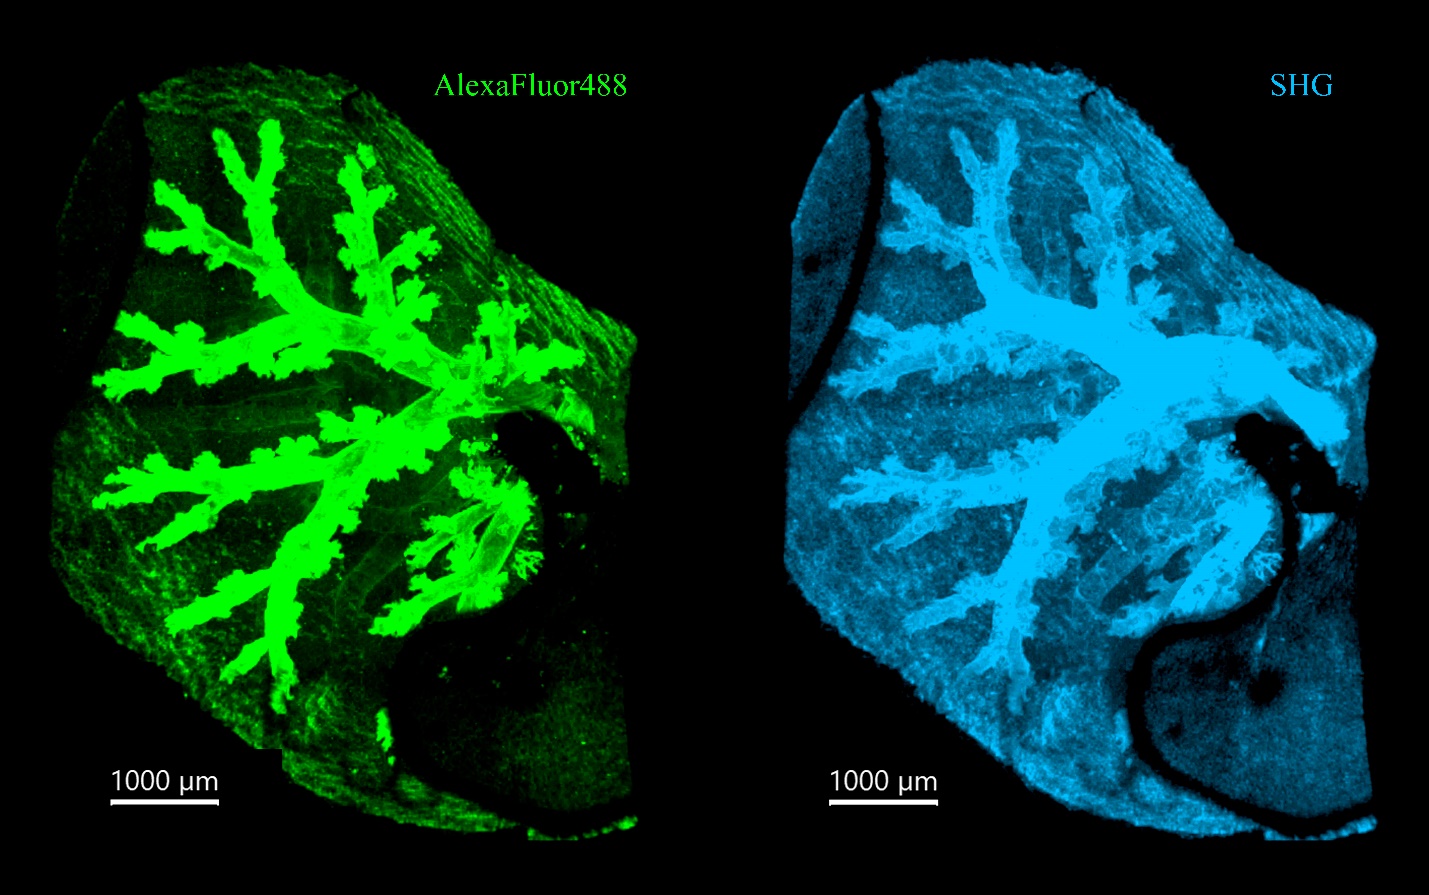
Fig. 4. Representative images of Alexa °Fluor° 488 (green,
left) and SHG (cyan, right) channels obtained after spectral unmixing. Scale
bar 1000 µm.
It has been observed that the SHG channel illuminated
an additional structure compared to the image in the Alexa
°Fluor° 488
channel. Indeed, the SHG channel was expected to include both the respiratory
tract and blood vessels due to the airway wall and endothelial collagen
anisotropic properties triggering SHG.
On the other hand, Alexa °Fluor°
488 allowed visualization of the respiratory tract only
(due to the streptavidin-biotin binding).
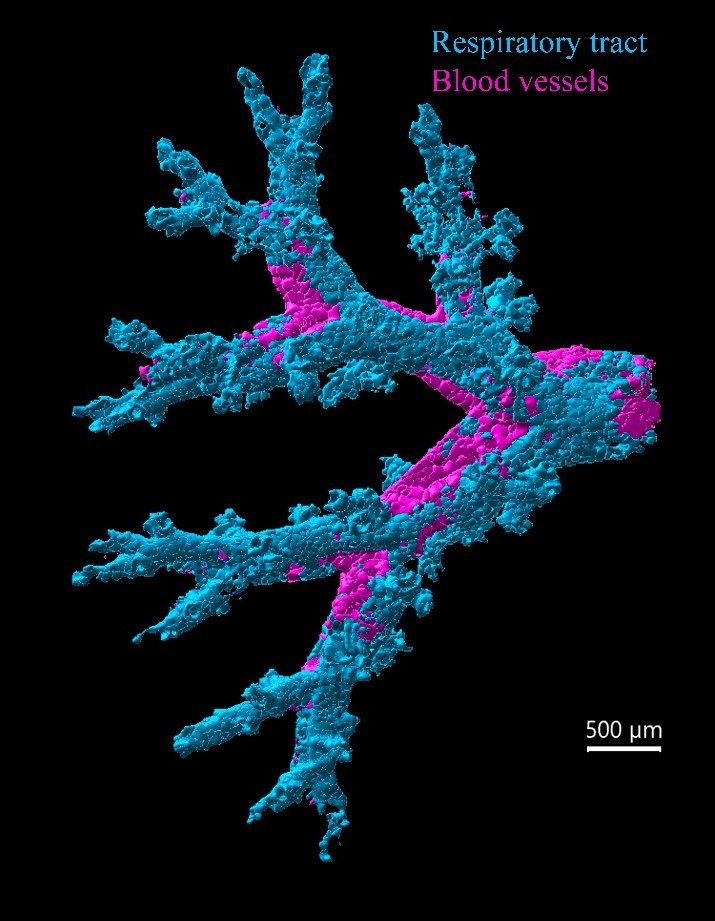
Based on the SHG channel obtained using the spectral
unmixing, the SHG surface was created and divided into segments with an
approximate diameter of 20 μm, as indicated in Figure 5 (a).
The Intensity Mean filter in the Alexa °Fluor° 488
channel was applied to split the segments of the SHG surface: segments
corresponding to the Alexa
°Fluor° 488 surface were stained with
cyan, and the rest with magenta, as indicated in Figure 5 (b).
|

|
|
|
a)
|
b)
|
Fig. 5. SHG surface was divided into the segments (a), and the segments were
classified as associated with Alexa °Fluor° 488 channel (cyan) and
not associated (magenta) (b). Scale bar 500 µm.
To obtain the surface of the vessels, we manually
removed the segments belonging to the airways (indicated with cyan in Figure 5
(b)) using the “Delete” option in the graphic section. The segments indicated
in magenta were left; they form the surface of lung vessels. To ensure
accuracy, the process of segment removal was verified against the Alexa
°Fluor° 488 surface to avoid removing unnecessary segments.
The creation of the blood vessel surface was
necessary for the accurate identification of A.°fumigatus fungal spores
in the lung, and particularly in blood vessels.
To do this, the mask was created based on the
vessel surface using the “Mask Selection” option. Spores were created using the
“Spots” option, spot diameter was selected as 5 µm, and PZF 10 µm.
Filtering of the obtained spots did not reveal spots
inside the vessels, as shown in Figure 6.
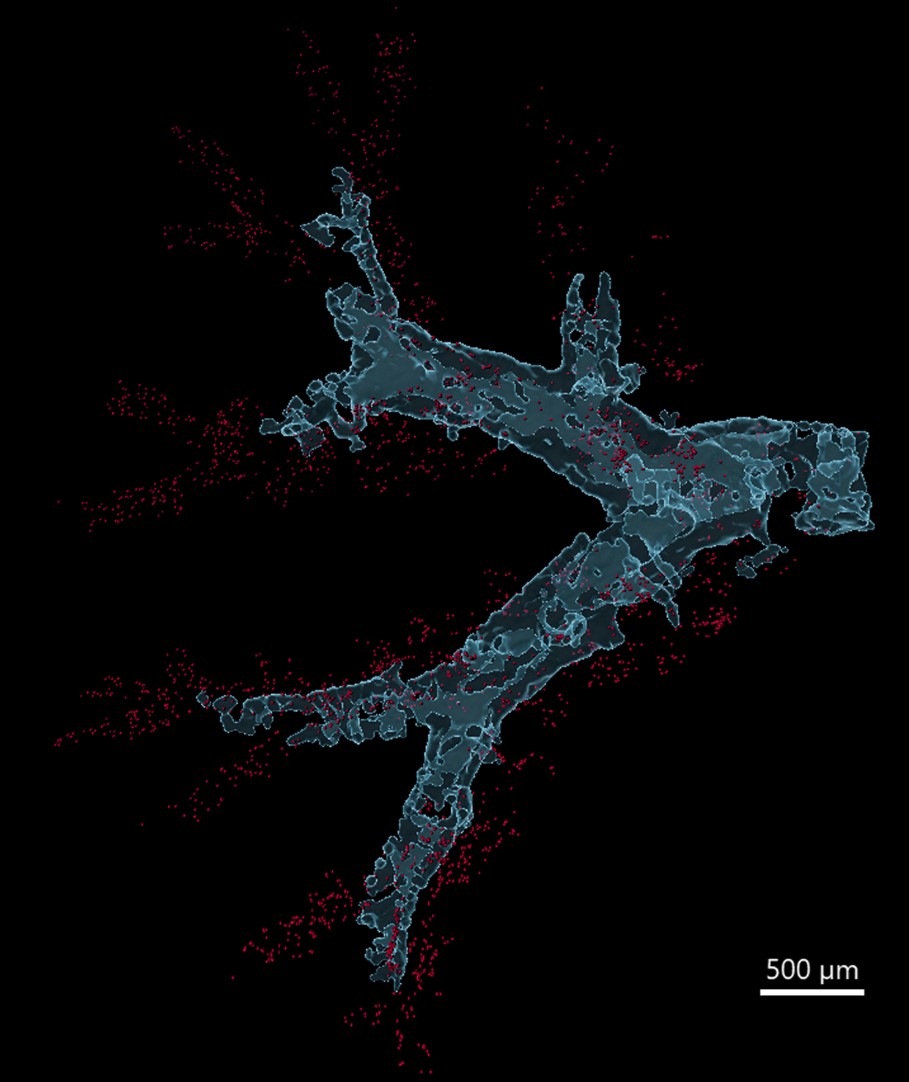
Fig. 6. Representative image of the blood vessel surface
(transparent blue) and A.°fumigatus spores (red). Scale bar 500 µm.
Thus, our data indicated that A.°fumigatus
spores could not penetrate blood vessels in an immunocompetent organism (mouse).
Here, we proposed an approach that allows a
high-resolution imaging of the airways and vessels in the optically cleared
lung of experimental mice using two-photon microscopy and SHG. Subsequent image
processing was also developed in the present study.
The approach combined several experimental
techniques: biological specimen preparation, specimen imaging using two-photon
microscopy, and image processing. For accurate specimen preparation and
imaging, an initial literature analysis was performed. The simple and reliable
techniques for immunohistochemistry and tissue optical clearing were used in
the present study. Thus, airways were stained with fluorophore-conjugated
streptavidin; the staining was based on the club cell capability of high biotin
expression. A label-free technique, such as SHG, was applied to illuminate
actin-rich and collagen-rich structures, including smooth muscles around the
airways and endothelium. Although antibody staining was avoided in the present
study, it can be used in combination with the proposed approach to visualize
additional structures or immune cells in the lung vessels. As a result, using
only one label, we visualized two structures; however, additional image
processing was required to split these two structures.
The image processing technique was entirely
developed in the present study and allowed for obtaining a separate structure
of the airway-associated lung vessels. Subsequent analysis of in-advance
labeled pathogens (spores of A. fumigatus fungi) revealed the absence of
the pathogens in the lung vessels in the mouse model that was used in the
present study.
The approach that was developed in the present
study was successfully applied for investigating the ability of potentially
pathogenic fungi to undergo systemic dissemination via the blood vessels. Using
the approach, one can trace fluorescent drugs or specifically labelled immune
cells in the vascular system of the lungs, brain, and spleen in different
experimental animal models.
The work was supported by the Russian Science
Foundation, grant No. 25-25-00081, https://rscf.ru/en/project/25-25-00081/.
1. Ali M.U., Liu G., Yousaf B., Ullah H., Abbas Q., Munir M.A.M. A systematic review on global pollution status of particulate matter-associated potential toxic elements and health perspectives in urban environment //Environ Geochem Health, Vol. 3, № 41, 2019, pp. 1131-1162 (doi: 10.1007/s10653-018-0203-z) (http://link.springer.com/article/10.1007/s10653-018-0203-z).
2. Li Y., Wang X., Cao G., Wang Y., Miao Q., He J. An Assessment of Airborne Bacteria and Fungi in the Female Dormitory Environment: Level, Impact Factors and Dose Rate. Int J Environ Res Public Health. Vol. 11, № 19, 2022, 6642 (doi: 10.3390/ijerph19116642) (https://www.mdpi.com/1660-4601/19/11/6642).
3. Uderhardt S. Neag G., Germain R.N. Dynamic Multiplex Tissue Imaging in Inflammation Research. Annu Rev Pathol. Vol. 19, 2024, pp. 43-67 (doi: 10.1146/annurev-pathmechdis-070323-124158) (https://www.annualreviews.org/content/journals/10.1146/annurev-pathmechdis-070323-124158).
4. Richardson D.S., Lichtman J.W. Clarifying Tissue Clearing. Cell. Vol. 2 № 162, 2015, pp. 246-257 (doi: 10.1016/j.cell.2015.06.067) (https://www.sciencedirect.com/science/article/pii/S0092867415008375?via%3Dihub).
5. Borile G., Sandrin D., Filippi A. Anderson K.I., Romanato F. // Label-Free Multiphoton Microscopy: Much More Than Fancy Images. Int J Mol Sci. Vol. 5, № 22, 2021, 2657 (doi: 10.3390/ijms22052657) (https://www.mdpi.com/1422-0067/22/5/2657).
6. Li W., Germain R.N., Gerner M.Y. High-dimensional cell-level analysis of tissues with Ce3D multiplex volume imaging. Nat Protoc. Vol. 6, № 14, 2019, pp. 1708-1733 (doi: 10.1038/s41596-019-0156-4) (https://www.nature.com/articles/s41596-019-0156-4).
7. Gruneboom A., Aust O., Cibir Z., Weber F., Hermann D.M., Gunzer M. Imaging innate immunity. Immunol Rev. Vol. 1, № 306, 2022, pp. 293-303 (doi: 10.1111/imr.13048) (https://onlinelibrary.wiley.com/doi/10.1111/imr.13048).
8. Aghigh A., Bancelin S., Rivard M., Pinsard M., Ibrahim H., Legare F. Second harmonic generation microscopy: a powerful tool for bio-imaging. Biophys Rev. Vol. 1, № 15, pp. 43-70 (doi: 10.1007/s12551-022-01041-6) (https://link.springer.com/article/10.1007/s12551-022-01041-6).
9. Maslov I.V., Bogorodskiy A.O., Pavelchenko M.V., Zykov I.O., Troyanova N.I., Borshchevskiy V.I., Shevchenko M.A. Confocal Laser Scanning Microscopy-Based Quantitative Analysis of Aspergillus fumigatus Conidia Distribution in Whole-Mount Optically Cleared Mouse Lung. J Vis Exp. Vol. 175, 2021, e62436 (doi: 10.3791/62436) (https://app.jove.com/t/62436/confocal-laser-scanning-microscopy-based-quantitative-analysis).
10. Rollen K., Granzin J., Remeeva A., Davari M.D., Gensch T., Nazarenko V.V., Kovalev K., Bogorodskiy A., Borshchevskiy V., Hemmer S., Schwaneberg U., Gordeliy V., Jaeger K.E., Batra-Safferling R., Gushchin I., Krauss U. The molecular basis of spectral tuning in blue- and red-shifted flavin-binding fluorescent proteins. J Biol Chem. Vol. 296, 2021, 100662. (doi: 10.1016/j.jbc.2021.100662) (https://pmc.ncbi.nlm.nih.gov/articles/PMC8131319/).
11. Nikolaev A., Yudenko A., Smolentseva A., Bogorodskiy A., Tsybrov F., Borshchevskiy V., Bukhalovich S., NazarenkoV.V., Kuznetsova E., Semenov O., Remeeva A., Gushchin I. Fine spectral tuning of a flavin-binding fluorescent protein for multicolor imaging. J Biol Chem. Vol. 299, № 3, 2023, 102977. (https://doi.org/10.1016/j.jbc.2023.102977) (https://www.sciencedirect.com/science/article/pii/S0021925823001096).
12. Smith P.G., Baldacchini T., Carter J., Zadoyan R. Two-photon microscopy/multimodal imaging: Femtosecond laser developments advance two-photon imaging. Biooptics World Online (https://www.spectra-physics.com/medias/sys_master/spresources/hc4/h0b/9954747940894/Two-Photon-Microscopy-BOW/Two-Photon-Microscopy-BOW.pdf )
13. Benninger R.K.P., Piston D.W. Two-photon excitation microscopy for the study of living cells and tissues. Curr Protoc Cell Biol. Vol. 11, № 4, 2013, pp. 1-24 (doi:10.1002/0471143030) (https://currentprotocols.onlinelibrary.wiley.com/doi/10.1002/0471143030.cb0411s59).
14. Oxford Instruments, 2021 (https://imaris.oxinst.com/).
15. Pavelchenko M., Shalyapin S., Portnov S., Bogorodskiy A., Bolkhovitina E., Shevchenko V., Sapozhnikov A., Borshchevskiy V., Shevchenko M. Impact of CD11c(+) cells in conducting airway lumen on Aspergillus fumigatus conidia deposition in neutropenic mice. Front Fungal Biol. Vol. 6, 2025, 1591891 (doi: 10.3389/ffunb.2025.1591891) (https://www.frontiersin.org/journals/fungal-biology/articles/10.3389/ffunb.2025.1591891/full).