Visualization of bibliometric data enhances
research analysis by mapping concepts, identifying trends, showcasing novelty,
and providing insights for future studies.
The purpose of this study was to
demonstrate the ability to visualize the results of the Scilit platform
bibliometric data analysis on the subject 'AI & Machine Learning' in order
to identify publications reflecting selected issues of the topic.
In particular, to show the capabilities of
the Scimago Graphica software to create compound diagrams reflecting the
co-occurrence of keywords.
Note:
Throughout this article, double quotes have been used either to quote text
directly or to match directly in a query. Single quotes have been used to
emphasize a substring in text, such as a keyword or the name of a field in a
table.
The paper [1] analyzes journal articles and
conference proceedings on data visualization to understand the current and
future development trends. The study aims to improve the intellectual
evaluation of data visualization to promote its popularization and fully
realize the significant benefits of big data.
In the article [2] the authors argue that
academic analysis of bibliometric data often fails to take into account the
needs and expectations of users. It is very important to simplify, make
transparent and understandable quantitative estimates, and not to fixate on the
accuracy or purity of research.
The paper [3] uses bibliometrics and
information visualization to quantitatively analyze metallurgy papers over 20
years, revealing research hot spots, domestic and foreign technical development
trends.
The study [4] explores the status of
medical big data (MBD) through visualization analysis of 988 journal papers. It
provides insights into annual trends, top players, citations, keywords
distribution, highly cited papers, co-authorship status, and influential
journals and authors.
The paper [5] explores the use of
bibliometrics and information visualization in decision-making processes,
highlighting their potential to structure processes and organize results,
particularly in the context of student retention studies in higher education.
Scilit is an open-access abstract database,
managed by MDPI [6], that can be used to analyze research trends and patterns [7].
The main features provided by the platform
itself: “Scilit covers 166 million scholarly publications, including over 36
million open access articles and 4 million preprints” and “Scilit tries to
automatically classify each publication into up to three distinct subjects
based on a trained machine learning model. If a subject is predicted with a
high confidence score, the publication will be assigned to a single subject”.
Some key advantages of using Scilit for
bibliometric analysis:
•
Scilit aggregates data from over 40,000
publishers.
•
Scilit covers 166 million scholarly
publications.
•
Scilit provides citation score.
•
Scilit Rankings: ranking of top publishers,
journals and countries by number of journal articles published.
•
Related articles widget: engine to recommend
papers from Scilit based on keywords.
•
Provides export of bibliometric data in a
convenient form for analysis.
Examples of articles on the analysis of
bibliometric data from the Scilit platform for different fields of research.
The authors [8] compares metadata and
completeness of research publications in new academic databases. A random
CrossRef sample of over 115k records was searched in seven databases. Results
showed academic search engines gather less information and have low
completeness, while third-party databases have more metadata quality and higher
completeness rates. The main problem with third-party databases is the loss of
information from integrating different sources.
Biological databases are crucial for
research, but manual curation is time-consuming. To improve data integration
and link literature to underlying data, Europe PMC has developed SciLite, a
platform overlaying text-mined annotations on research articles. This aims to
aid users in finding key concepts and providing links to related resources [9].
The study [10] aims to prepare bibliometric
data from the Scilit platform on energy efficiency and conservation for further
analysis to identify relevant research topics. The data was exported from the
platform and analyzed using lemmatization dictionaries, VOSviewer, Scimago
Graphica, GSDMM algorithm, Carrot2 demo version, and NMF algorithm.
The query 'Content Type:
JOURNAL-ARTICLE; Year: 2023; Common Fields [Title, Abstract, Keyword]:
Visualization AND Common Fields [Title, Abstract, Keyword]: bibliometric AND
Common Fields [Title, Abstract, Keyword]: analysis' to the abstract database
Scilit got 2165 results, which indicates the topicality of this issue. The data
are current as of July 07, 2024.
The main areas of research can be assessed
by the occurrence of keywords. The top 30 keywords are shown in Table 1.
Table 1. The 30 most frequent keywords from
the 'Publication Keywords' field in 2165 records
|
Term
|
Count
|
Term
|
Count
|
|
bibliometric analysis
|
797
|
literature review
|
36
|
|
bibliometric
|
657
|
citation analysis
|
35
|
|
citespace
|
430
|
data visualization
|
34
|
|
vosviewer
|
421
|
biblioshiny
|
33
|
|
visualization
|
163
|
sustainability
|
33
|
|
web of science
|
99
|
cancer
|
28
|
|
visual analysis
|
84
|
knowledge graph
|
27
|
|
visualization analysis
|
78
|
knowledge map
|
25
|
|
research trends
|
67
|
machine learning
|
25
|
|
covid-19
|
52
|
bibliometrix
|
24
|
|
scopus
|
52
|
inflammation
|
24
|
|
research hotspots
|
51
|
bibliometric study
|
23
|
|
artificial intelligence
|
42
|
knowledge mapping
|
23
|
|
trends
|
40
|
gut microbiota
|
22
|
|
hotspots
|
38
|
deep learning
|
21
|
The terms 'bibliometric analysis,
bibliometric, bibliometric study' reflect the major research focus, that fits
the task at hand. The key words 'visualization, visual analysis, visualization
analysis, data visualization' refer to visualization issues. The name of the
most frequently used programs in bibliometric analysis: 'CiteSpace, VOSviewer,
biblioshiny/bibliometrix'. The most common sources of bibliometric data: Web of
Science, Scopus' are high-quality abstract databases available only by subscription
or being an Elsevier reviewer.
It should be noted that the above programs work well with data from these
databases.
Keywords: 'research trends, research
hotspots, trends, hotspots, literature review, citation analysis, knowledge
graph, knowledge map' reflect the main objectives of the conducted bibliometric
studies. 'Artificial intelligence, machine learning, deep learning' reflect
current analytical challenges, and the terms 'Covid-19, cancer, inflammation,
gut microbiota' indicate the widespread use of bibliometric methods in
medicine. The reason for the latter is understandable, since the life sciences
are very relevant today and a lot of papers are published about them. In
addition, there is the concept of evidence-based medicine, where systematic
reviews and meta-analyses are widely used.
It is worth noting that although medical
publications are the most common in the context of bibliometric research,
highly cited papers are often from the topics 'Cybersecurity, Nuclear
Technology & Instrumentation, Applied Physics, Computer Vision & Graphics'
which may indicate that visualization of bibliometric research publications on
engineering topics may be in demand but underrepresented compared to medical
research. These claims can be verified by referring to the 'Analytics view'
section of the Scilit platform and the results obtained from the above query.
In the 2165 bibliometric records obtained
by us, the term 'web of science' appears in the fields 'Publication Title,
Publication Keywords' 151 times in different spellings, and 'Scopus' - 90
times, the term 'Scilit' does not meet once. The Scilit platform provides open
access to its data and currently provides access to 166 million scholarly
publications while Scopus only provides access to 91+ million records
(https://blog.scopus.com/about#:~:text=Scopus%20puts%20powerful%20discovery%20and,profiles%20and%2017%2B%20million%20authors.) and this is despite the fact that Scilit has only been indexing
publications since 2015.
This result indicates the relevance and novelty
of research on the analysis of Scilit capabilities for bibliometric studies and
visualization of the obtained data.
The novelty of using the Scimago Graphica
program is determined by the fact that the term 'vosviewer' appears in the
fields 'Publication Title, Publication Keywords' 491 times, 'citespace' - 578,
and 'scimago graphica' only 3 times.
The FP-growth/fpgrowth and GSDMM algorithms
are not mentioned even once in 2165 records. However, in a general context
these algorithms are widely used, e.g. query to Scilit — 'Common Fields [Title,
Abstract, Keyword]: FP-growth OR Common Fields [Title, Abstract, Keyword]:
fpgrowth' gave 5438 results.
Modern services using AI (Elicit, Litmaps,
QuillBot) in text processing greatly facilitate the work on analytical reviews
and reports, but their mention was not found in the 2165 records used in this
paper.
•
Scimago Graphica provides users with the
possibility to create a wide variety of complex and interactive data
visualizations without coding knowledge.
•
Scimago Graphica is an efficient tool for data
analysis on bibliometric datasets, in addition to its capabilities in
visualization.
•
Scimago Graphica is an application that
democratizes data visualization, enabling researchers and institutions with
limited resources to create professional-quality bibliometric data
visualizations.
Publication by the authors and developers
of SCImago Graphica, a no-code tool that enables the creation of complex visualizations
through simple drag-and-drop interactions, making it suitable for visual
communication and exploratory data analysis. [11].
The research [12] aims to analyze scholarly
articles on food safety in 15 RCEP countries from 2022 to 2023 using advanced
tools like VOSviewer and Scimago Graphica, identifying research hotspots and
contributing to existing knowledge.
The article [13] showcases the Lens
platform's ability to identify bibliometric/scientometric issues through key
term co-occurrence and clustering. It uses VOSviewer, Scimago Graphica, and
Sifaka text mining tools, revealing its predominant use in political, social,
and medical research fields.
The data used in this paper were
bibliometric records exported from the Scilit platform, which meet the
following requirements:
Content Type: JOURNAL-ARTICLE
Subject: AI & Machine Learning
Year: 2021–2023
Language: English
Sort by Times cited
The data is current as of June 16, 2024.
For each year, 6,000 records were
downloaded in CSV and RIS format. CSV files have no 'Abstract' field, so the
values were taken from RIS files. Records were compared by 'DOI' and 'Title'
fields.
Quality of records: two records out of
18,000 were missing a "DOI" and 349 records did not have the
"Publication Keywords" field filled in, and three records in this
field contained records not in English.
In the RIS formatted data, 21 records did
not have the 'Abstract' field filled in. Taking this into account, only 17979
records were used as short texts in the 'Title' and 'Abstract' fields in the
clustering process. All of these records contained a populated 'DOI' field so
that they could be compared to records from CSV files.
The following 'Text Preprocessing' was
carried out at different stages of the study:
•
removing of unused substrings, e.g.,
abbreviations in brackets, hieroglyphs, Cyrillic characters, mathematical
formulas (usually in Latex), markup tags including SVG markup, substrings such
as "Published by Elsevier B.V.. All rights reserved" and so on
•
lemmatization, a dictionary lemmatization
collected mostly on github and augmented with new entries such as blockchains
→
blockchain was used. The dictionary included 260530 substitutions
•
removal of stop words, stop words taken from
GATE (General Architecture for Text Engineering) and spaCy programs were used
•
the text was converted to lower case, in some
cases spaces within compound keywords were replaced with underscores in order
to perceive it as a whole
Text Preprocessing was performed using sed,
grep utilities and text editor. Much of this could have been implemented using,
for example, spaCy, but semi-manual processing allows to better identify
possible errors and problems of Text Preprocessing and add, for example, new
entries to the lemmatizer dictionary.
VOSviewer
[14]
- was used to build a keyword co-occurrence network and prepare a data file in
JSON format for further use in data visualization on the app.vosviewer.com
service. Files in JSON format are included in the archive attached to this
article and can be uploaded to this service for independent use.
Scimago Graphica
[15] is the main tool for visualization of bibliometric data used
in this paper. In the attached archive there are files of charts obtained using
Scimago Graphica in SVG and HTML formats (interactive display of data using
java script).
Inkscape
-
was used to edit SVG files, for example, to correct the placement of the
labels. In our case it was more appropriate to use this program rather than
Adobe Illustrator because of the difference in the 'stroke' display for text [16].
To reduce the file size of the images, the
service iloveimg.com/compress-image was used.
FP-growth
utility by Christian Borgelt [17] — was used to estimate the co-occurrence of
keywords. FP-Growth or Frequent Pattern Growth algorithm is an improvement of
Apriori algorithm. In FP-Growth algorithm, it is not necessary to scan the
transaction dataset multiple times, it is enough to scan the dataset twice.
Algorithm
GSDMM
[18] has been used
in the clustering of short texts from the data of title and annotation fields.
This utility implements the Gibbs sampling algorithm for a Dirichlet Mixture
Model [19].
Elicit
— AI
literature review research assistant, used to select publications suggested for
three keywords and a brief summary of the content of the publication. Elicit
searches across over 126 million academic papers from the Semantic Scholar
corpus across all academic disciplines [20].
Litmaps
— service was used to search for articles relevant to the three
keywords [21]. In addition, we showed how this service formulates the title of
the query (notebook) and Summary. Both of these lines are given as citations,
they were not edited. The goal was to show the current capabilities of AI for
formulating such texts. Litmaps Data Providers:
Crossref, Semantic Scholar, OpenAlex.
Litmaps not only
finds relevant articles, but also builds a graph of their relationships. In
this article, this feature is presented in the form of references: “Explore Top
Shared Citations & References by Litmaps”.
Note:
Elicit
and Litmaps services have their own data providers different from Scilit and
are used in this paper as an example of searching relevant publications by
keywords found when analyzing bibliometric data from the Scilit platform, which
forms the basis of this paper. For example, as an alternative to Elicit, one
can use the perplexity.ai platform for searching and QuillBot.com for
summarizing abstracts. It is important to keep in mind that such systems can
effectively extend or refine the data obtained by bibliometric data analysis of
a particular abstract platform, Scilit in our case.
QuillBot.com/summarize
— Summarize content by reducing articles, documents, and more to the most
relevant highlights [22].
Using artificial intelligence to summarize
text can significantly decrease the amount of content, which reduces the time
required to select the appropriate paper from a large list of publications.
Important note!
Direct quoting of such texts may cause a reaction of
anti-plagiarism programs, but editing them will not be able to show how AI
works in these services.
The records were selected using SQL and
joined by the 'DOI' field.
Data visualization was done using Scimago
Graphica software.
Data from the 'Publication Title' and
'Abstract' fields served as texts. The 'Abstract' field data was generated from
the 'AB' (Abstract) records of RIS files and merged with the 'Publication Title'
by the 'DOI' field. 'DOI' has been used as a universal identifier for
bibliometric records. The resulting texts were converted to lower case,
stopwords were removed and lemmatization was performed. Next, a dictionary of
compound keywords (several terms separated by a space) was compiled and
subjected to analogical preprocessing. In compound keywords, the space was
replaced with an underscore to treat them as a single substring. This
dictionary served as the basis for the dictionary used by the GSDMM algorithm.
The motivation for choosing composite keywords is that they more clearly
reflect the topics of publications, while reducing the size of the dictionary
itself. For visualization it is important to select the data to be displayed on
the chart, there cannot be a lot of them.
The GSDMM algorithm was used with the
following parameters '-a 0.1 -b 0.1 -m 100 -k 10'.
Where
k is the maximum expected number of clusters. The reason for fitting the values
of alpha (a) and beta (b) can be found on the gsdmm-rust website.
The data obtained by text clustering using
GSDMM algorithm was filtered by INNER JOIN with the 40 most frequent compound
keywords which are presented in Table 2, the visualization results themselves
are shown in Fig. 1.
Table 2. Top 40
compound keywords most frequently occurring in all 10 clusters
|
Term name
|
Term name
|
|
machine_learn
|
convolutional_neural_network
|
|
deep_learn
|
computational_model
|
|
feature_selection
|
cluster_algorithm
|
|
anoma_detection
|
multi-criterion_decision-make
|
|
feature_extraction
|
rough_sett
|
|
intrusion_detection
|
big_datum
|
|
decision_make
|
intuitionistic_fuzzy_sett
|
|
datum_model
|
multi-criterion_decision_make
|
|
internet_of_thing
|
particle_swarm_optimization
|
|
support_vector_machine
|
fuzzy_logic
|
|
neural_network
|
analytic_hierarchy_process
|
|
intrusion_detection_system
|
genetic_algorithm
|
|
datum_mine
|
classification_algorithm
|
|
artificial_intelligence
|
three-way_decision
|
|
fuzzy_sett
|
decision_tree
|
|
predictive_model
|
time_series_analysis
|
|
task_analysis
|
aggregation_operator
|
|
ensemble_learn
|
time_series
|
|
artificial_neural_network
|
machine_learn_algorithm
|
|
random_forest
|
recurrent_neural_network
|
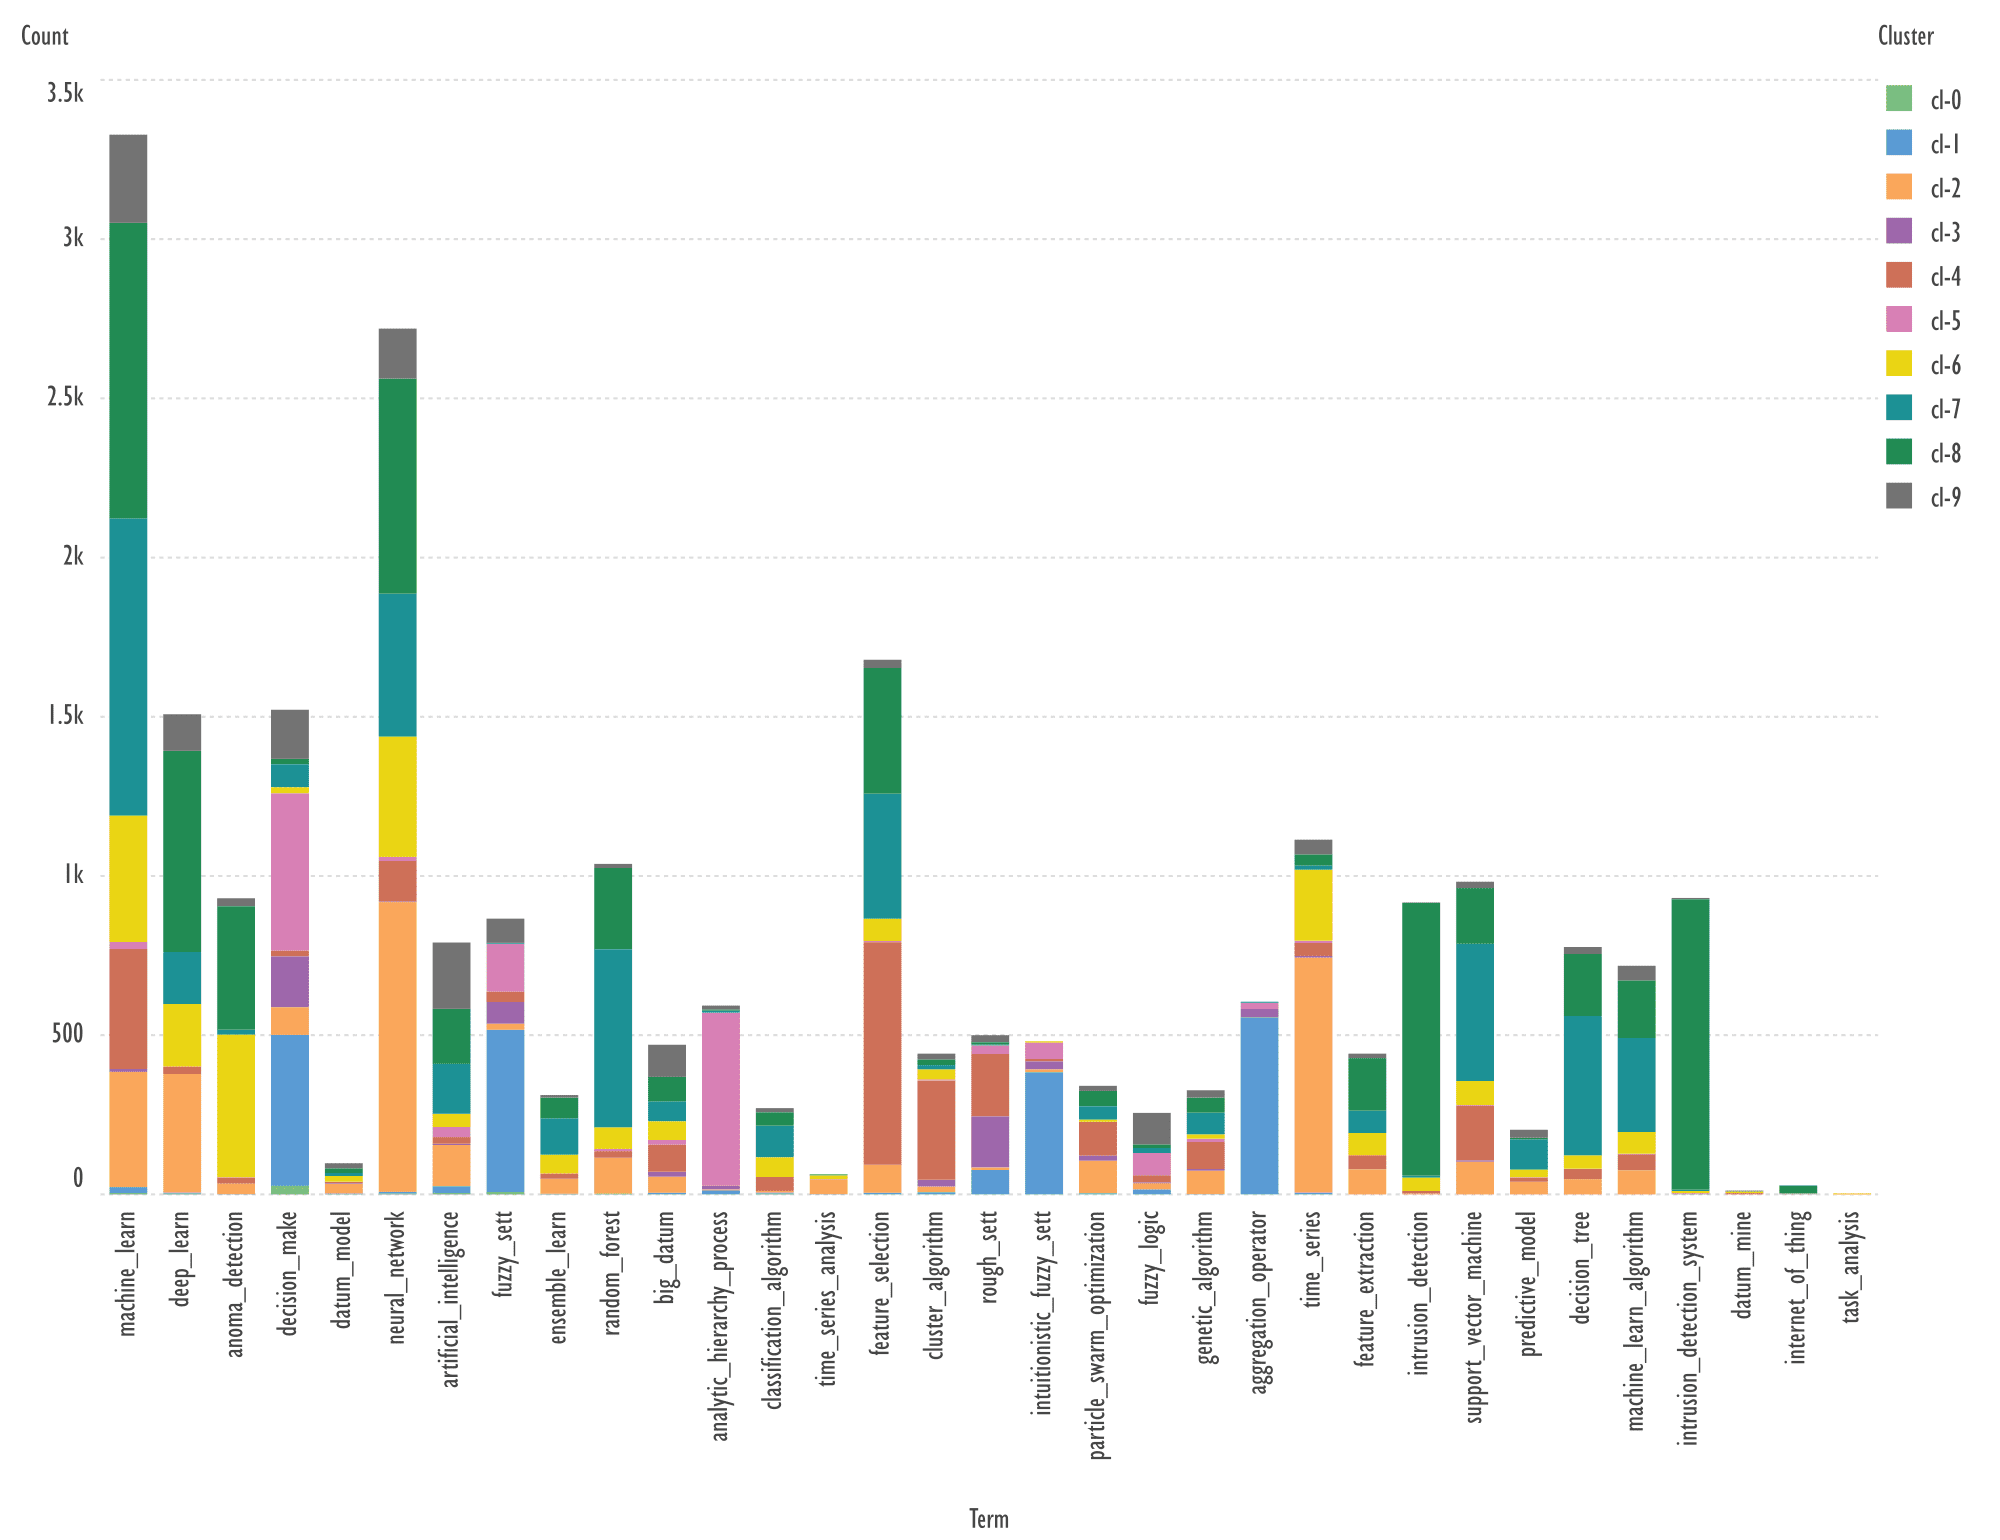
Fig. 1. Distribution of keywords from the dictionary for GSDM
algorithm into 10 clusters
Fig. 1. compared data in individual
clusters according to overall, most frequently occurring keywords for all
clusters. i.e. determining what is common between clusters, machine_learning,
neural_network, feature_selection are frequently occurring terms in a number of
clusters, intrusion_detection, intrusion_detection_system dominate in cluster
8.
Increasing the number of keywords for which
the comparison of their occurrence in clusters is made, for example, up to 400,
does not allow you to display them in the text of the publication, but they are
well viewed in separate files presented in the attached archive,
cl-0-9-top400.htm and cl-0-9-top400-v-3.htm, the latter is perhaps less visual
than the first, but allows you to immediately see which dominant words belong
to a given cluster.
While in Fig. 1 the comparison was based on
common keywords for all clusters, the difference between clusters can be most
clearly visualized by selecting the 40 most frequent keywords for each cluster.
Due to their size, it is not possible to
present a full graphical representation of such files in the text of the
article, so in Fig. 2 and 3 we will present only fragments of the figure from
the file cl-0-9-top40-by-cluster-Gill.htm, which together with the file cl-0-9-top40-by-cluster-Gill.svg
are placed in the archive.
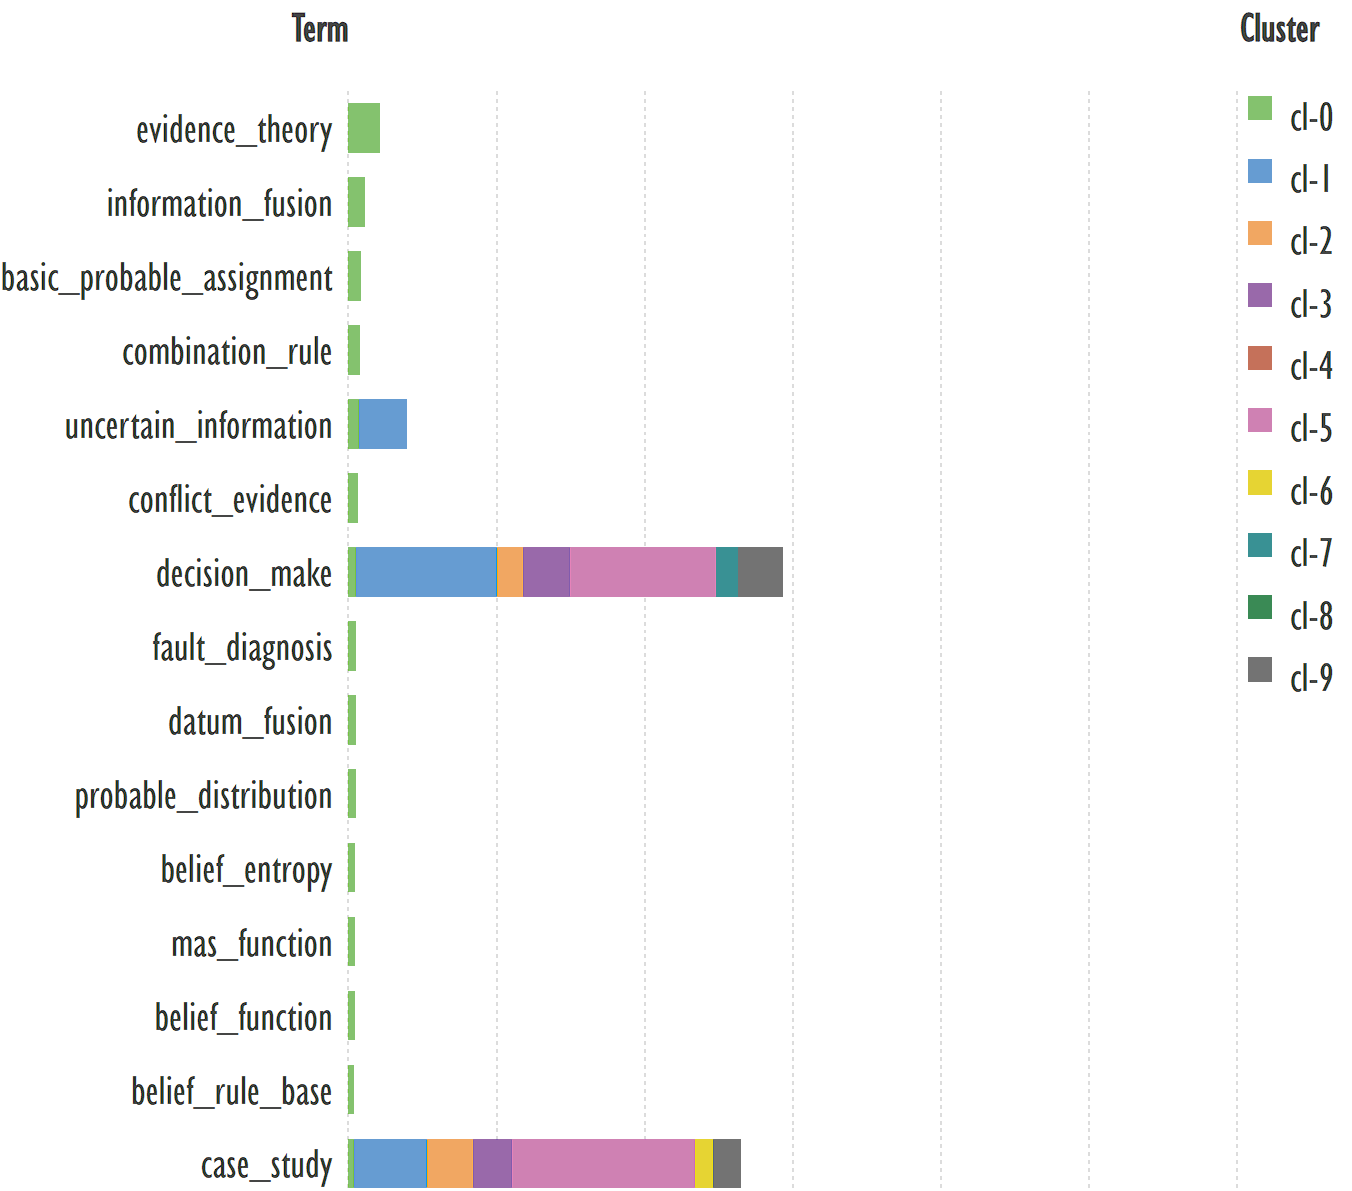
Fig. 2. The graph fragment showing the distribution of keywords in
the null cluster
In this example, the terms:
evidence_theory, information_fusion, basic_probable_assignment,
combination_rule, uncertain_information reflect the topic of this particular
cluster. They can be used to find publications of interest, e.g., [23, 24].
The terms decision_making and case_study
are terms that link this cluster to other clusters, for example, a fragment of
such cluster 1 is shown in Figure 3.
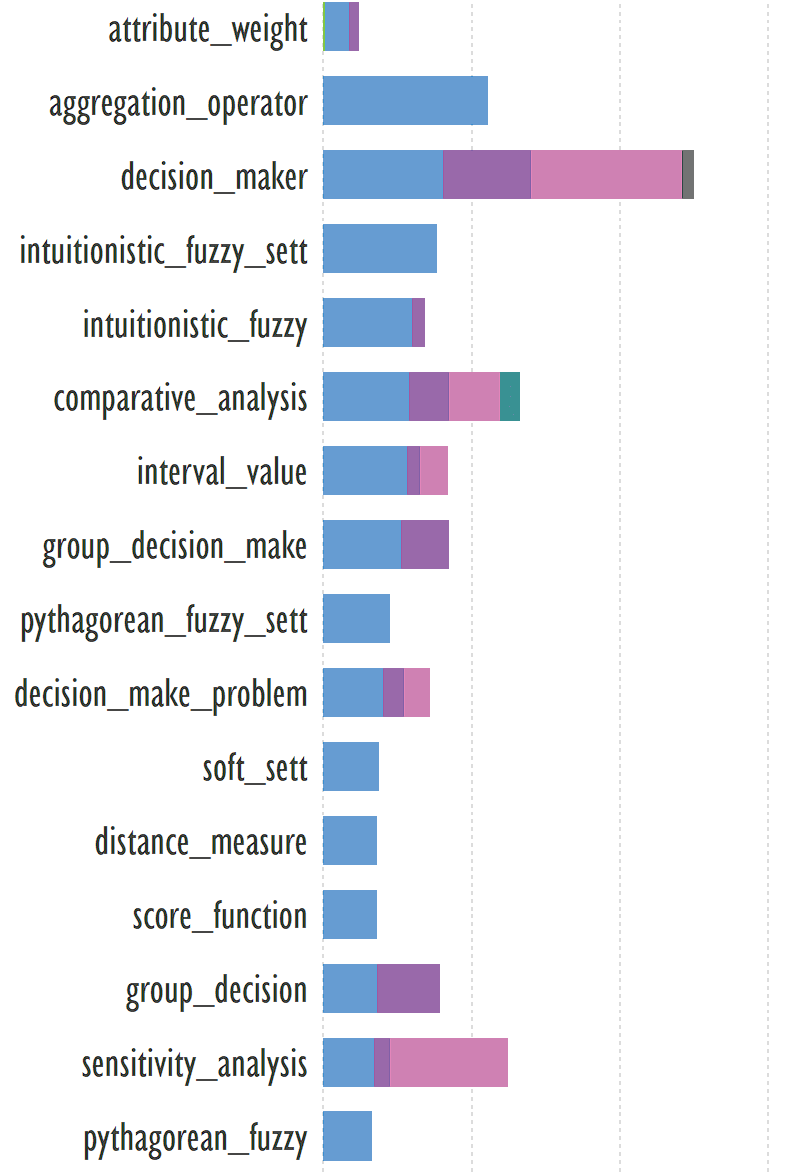
Fig. 3. The graph fragment showing the distribution of keywords in
the first cluster
Example of a publication corresponding to
the keywords 'decision_making and case_study' [25].
The visualization of scientific landscapes
is very informative in bibliometric analysis. The most widely used free program
is VOSviewer, which allows, for example, to create graphs of the clustering of
keywords based on their co-occurrence. For 10 clusters of bibliometric
publication records obtained using the GSDMM algorithm, these graphs were
plotted using VOSviewer.
Preliminary bibliometric records containing
keywords were converted to lower case and the text was "cleaned",
e.g., abbreviations in parentheses, markup tags, non-Latinized terms were
removed.
In publications using VOSviewer, the author
has usually not encountered lemmatization of keywords, so it was decided not to
deviate too much from common practice. However, in VOSviewer itself it is
possible to create a term replacement file that can be used as a dictionary lemmatizer.
The main purpose of this article was to demonstrate the possibilities of using
the means of visualizing the co-occurrence of terms for the subsequent
compilation of possible queries for searching publications on a possible topic
of interest, and not to demonstrate the possibilities of preparing the texts of
bibliometric records.
Records without keywords were removed from
the tables belonging to the 10 publication clusters.
Fig. 4 shows the graph of keyword
clustering based on their co-occurrence for the zero cluster of records as an
example. Such a graph does not provide interactive features, so it is more
rational to consider the obtained graphs using the available service
https://app.vosviewer.com/,
which allows importing files saved by VOSviewer in JSON format. It
is also possible to install VOSviewer locally and download the files
(KWs_cl-0-JSON.json ... KWs_cl-9-JSON.json), included in the archive attached
to this article.
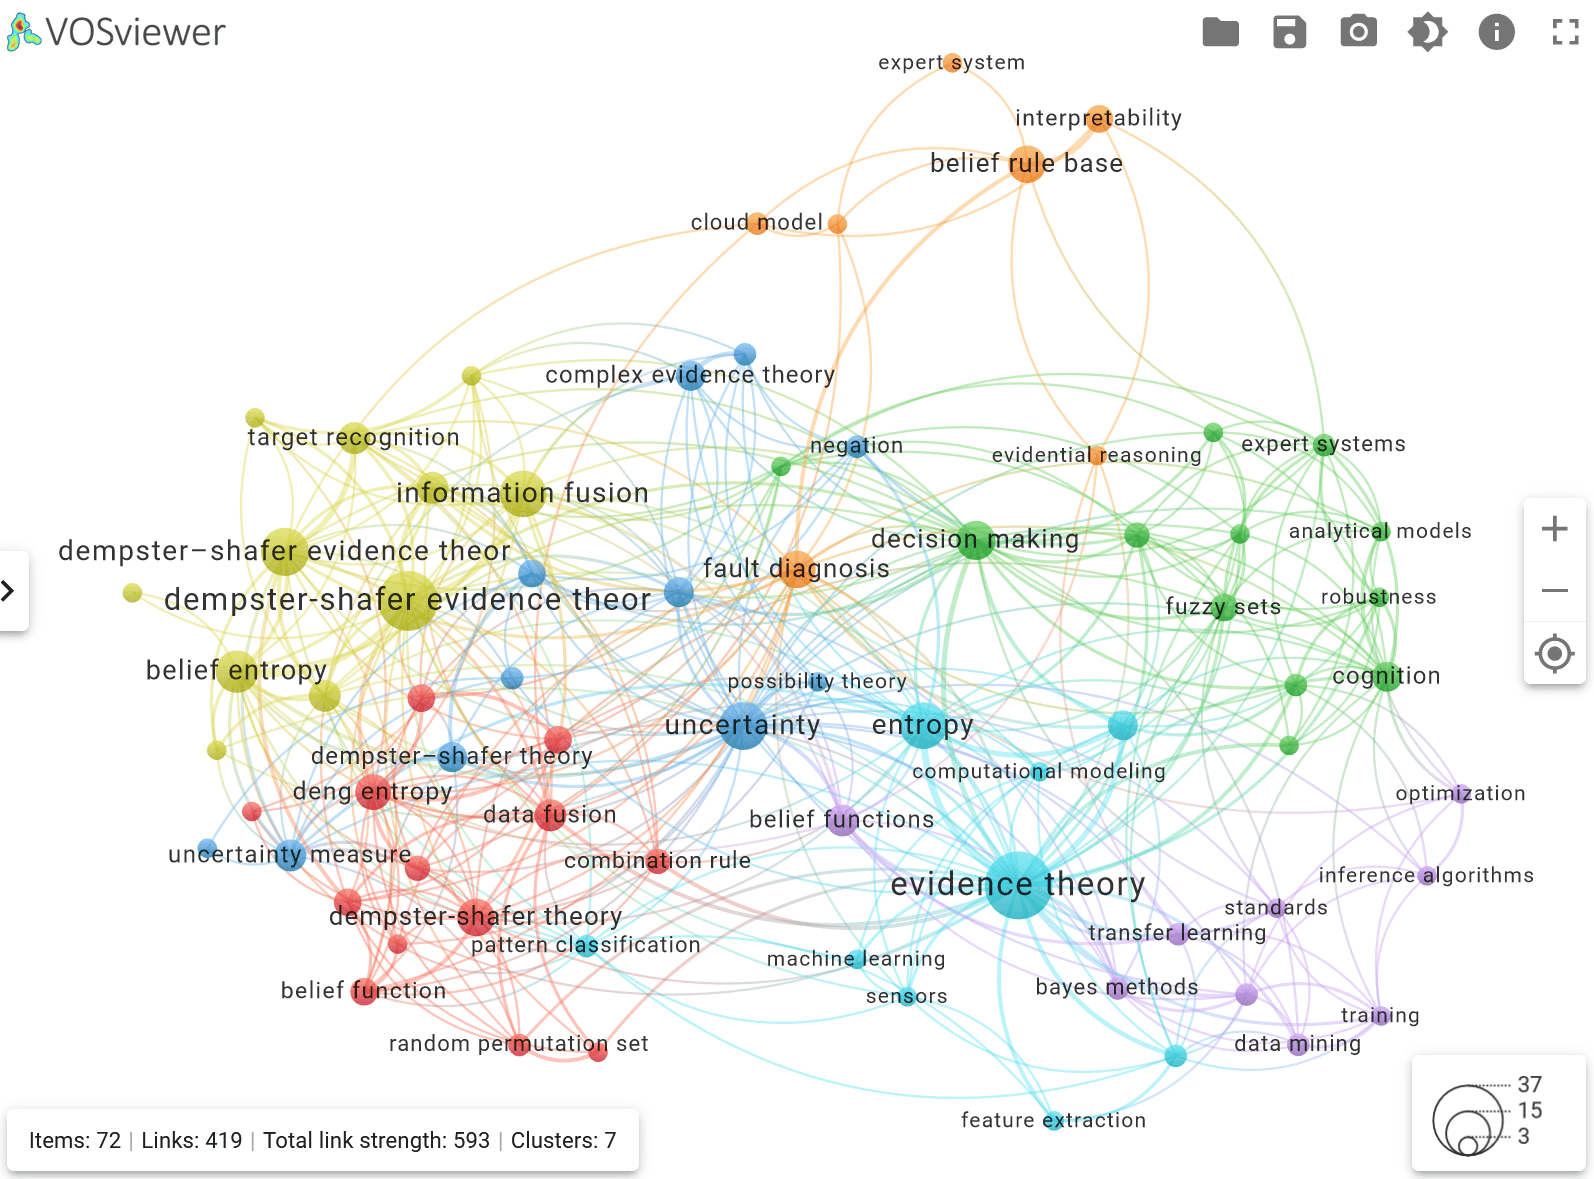
Fig. 4. Visualization of keyword clusters of the zero cluster of
bibliometric records, obtained by importing the file KWs_cl-0-JSON.json into
the service app.vosviewer.com
Keyword groups can
be used in the services elicit.com, QuillBot, and app.litmaps.com to find
relevant publications that are not necessarily indexed in Scilit, to obtain a
summary of the selected publication, and even to build a publication citation
graph based on the chosen publication. Such services using AI in their work
allow a deeper and more detailed study of the research landscape built by
bibliometric analysis methods.
Let us consider a possible application of
the results presented in Fig. 4 to find a relevant publication and its brief
description. This approach will be applied to the other graphs below.
An example of keywords from other clusters
related to the term 'fault diagnosis'
→
belief rule base,
evidence theory.
Header generation for the query by
elicit.com: "Fault Diagnosis Using Belief Rule Base and Evidence
Theory".
A highly-cited publication: "Agent
oriented intelligent fault diagnosis system using evidence theory" [26].
The abstract contains 218 words.
Summary by Elicit: "The paper presents
an agent-oriented intelligent fault diagnosis system that uses evidence theory
for multi-sensor information fusion to handle uncertainty, inaccuracy, and
conflicts in sensor data, and proposes a new combination rule and decision
rules for fault diagnosis". The text is 38 words long.
Summary by QuillBot: "Multisensor
fusion is crucial for fault diagnosis systems, as no single sensor can provide
all the necessary information. Evidence theory, an extension of Bayesian
reasoning, can be used for information fusion. This paper discusses the
classical Dempster-Shafer evidence theory, its disadvantages, and proposes a
new combination rule to allocate conflicted information based on the support
degree of the focal element. Decision rules and an agent-oriented intelligent
fault diagnosis system architecture are also proposed." The text is 73
words long.
Depending on the objectives of the
bibliometric research, either a more concise summary is sufficient or a more
detailed summary is required to understand the details of the publication.
Explore Top Shared Citations &
References by Litmaps:
https://app.litmaps.com/preview/125061262.
The free program Scimago Graphica is not
yet as widely used for visualizing the results of bibliometric analysis as VOSviewer,
but since it is focused on the construction of a wide range of graphs, it
offers a broad opportunity to visualize the results. Examples are available on
the page
https://www.graphica.app/catalogue.
This section presents diagrams reflecting
the clustering of keywords based on their co-occurrence, presented in the
coordinates average publication year (Avg. pub. year) - average normalized
citations (Avg. norm. citations). Charts were
plotted for each of the ten clusters of bibliometric records obtained using the
GSDMM algorithm.
Explanation: for example, Avg. pub. year is
the average year of publications containing the specified keyword. The concepts
of Avg. pub. year and Avg. norm. citations are taken from the VOSviewer
program.
Scimago Graphica employs a clustering based
on Clauset, Newman and Moore algorithm [27]. In our work, the number of
clusters was set to six.
The combination of visualizing the keyword
network in the aforementioned coordinates represents a novel approach, which
has not been previously identified in other published works.
The visualization results of keyword
clustering for ten clusters of bibliometric records are shown in Fig. 5-14.
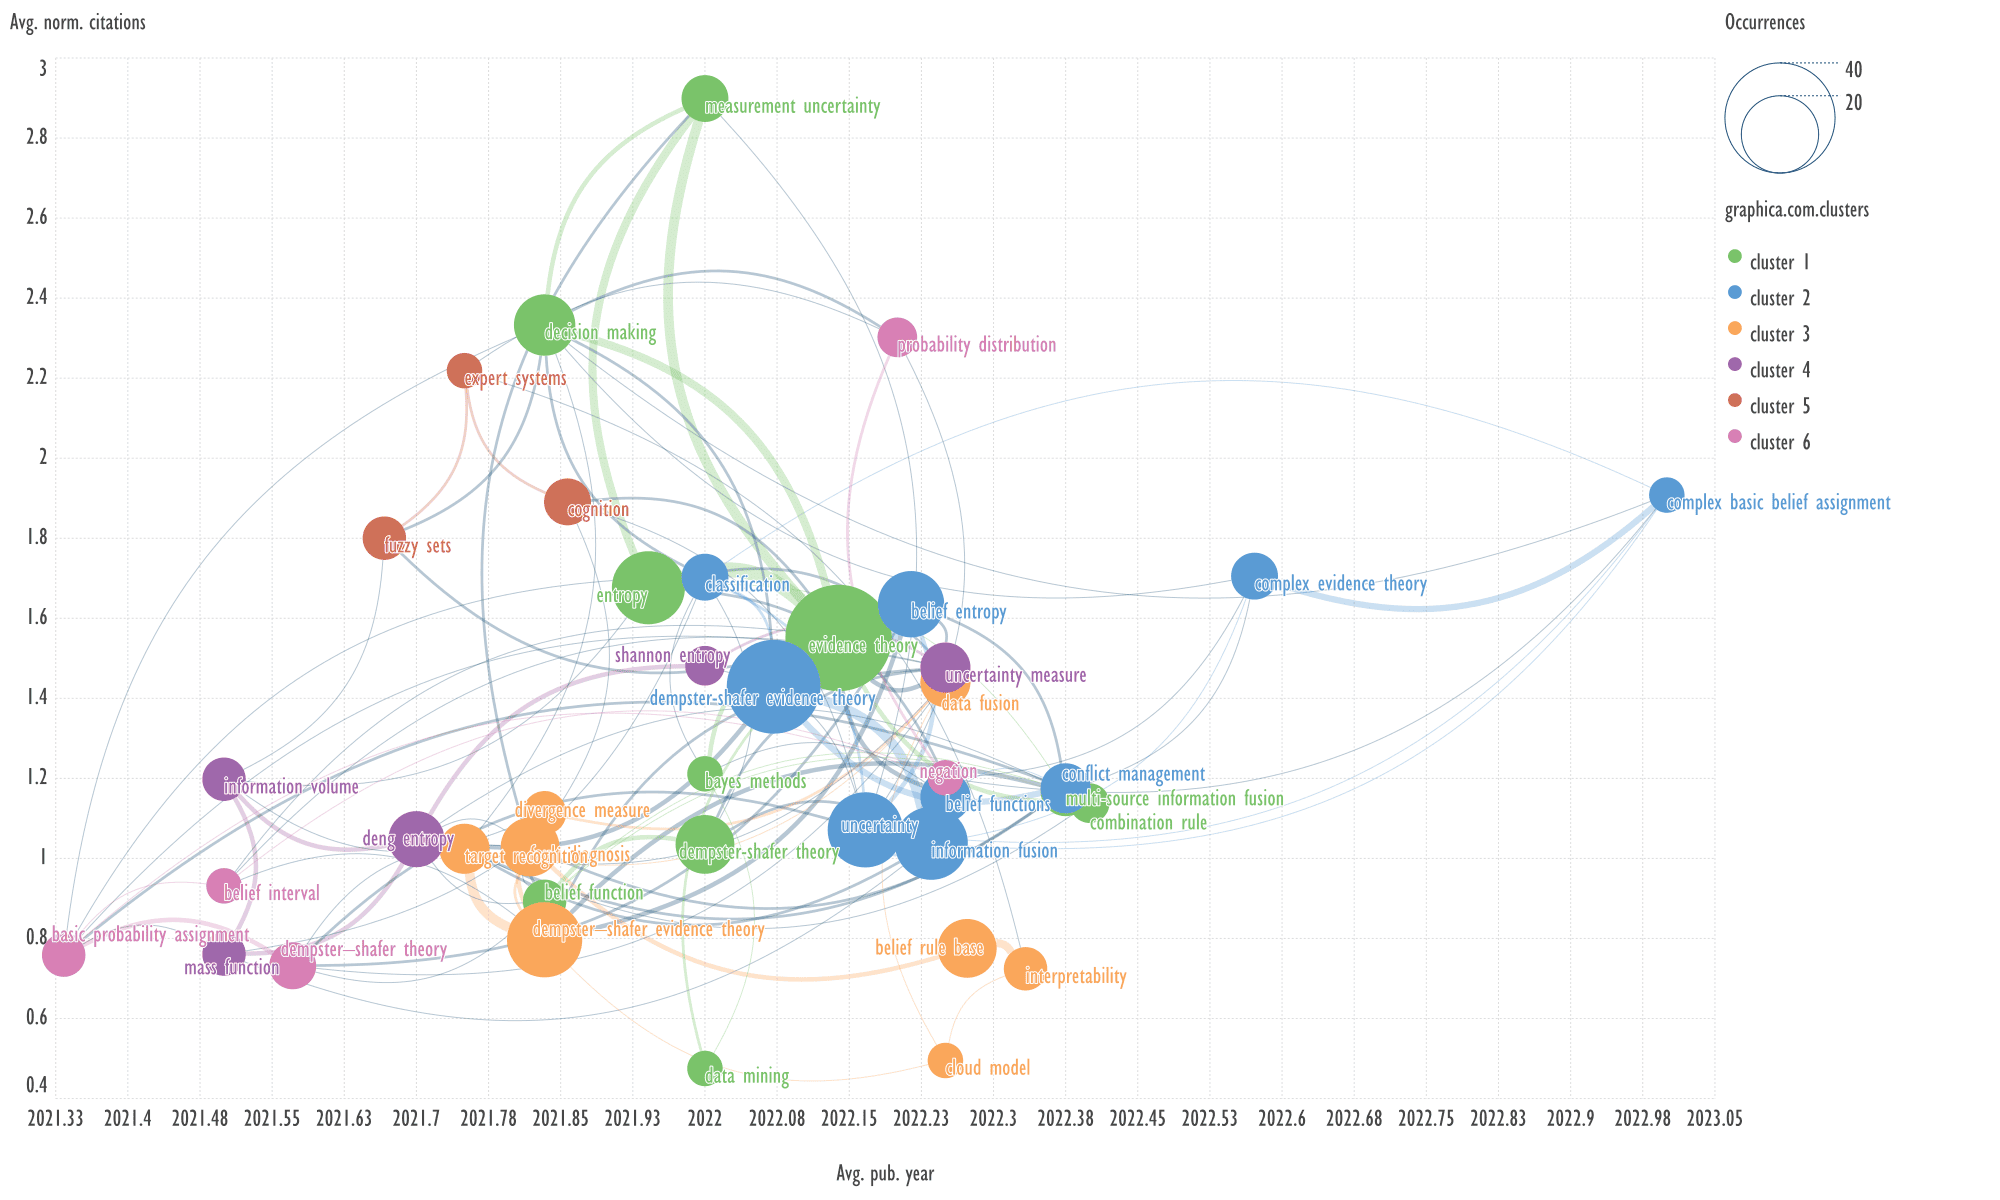
Fig. 5. Visualization of keyword clusters of the zero cluster of
bibliometric records, obtained by Scimago Graphica
An example of keywords from other clusters
related to the term 'dempster-shafer evidence theory'
→
decision making, deng entropy.
Header generation for the query by
elicit.com: "Decision Making with Dempster-Shafer Theory and Deng
Entropy".
A highly-cited publication: "A
decomposable Deng entropy" [28]. The abstract contains 147 words.
Summary by Elicit: "This paper proposes
a new decomposable Deng entropy that can effectively decompose the Deng entropy
and is an extension of the decomposable entropy for Dempster-Shafer evidence
theory." The text is 27 words long.
Summary by QuillBot: "Dempster-Shafer
evidence theory is an extension of classical probability theory used in
evidential environments. It uses a decomposable entropy to efficiently
decompose the Shannon entropy. This article proposes a decomposable Deng
entropy, that can efficiently decompose the entropy for the Dempster–Shafer
evidence theory. Experimental results show the performance of the model in
decomposing Deng entropy." The text is 56 words long.
Explore Top Shared Citations &
References by Litmaps:
https://app.litmaps.com/preview/85517035.
Note, primary article: Deng entropy [29].
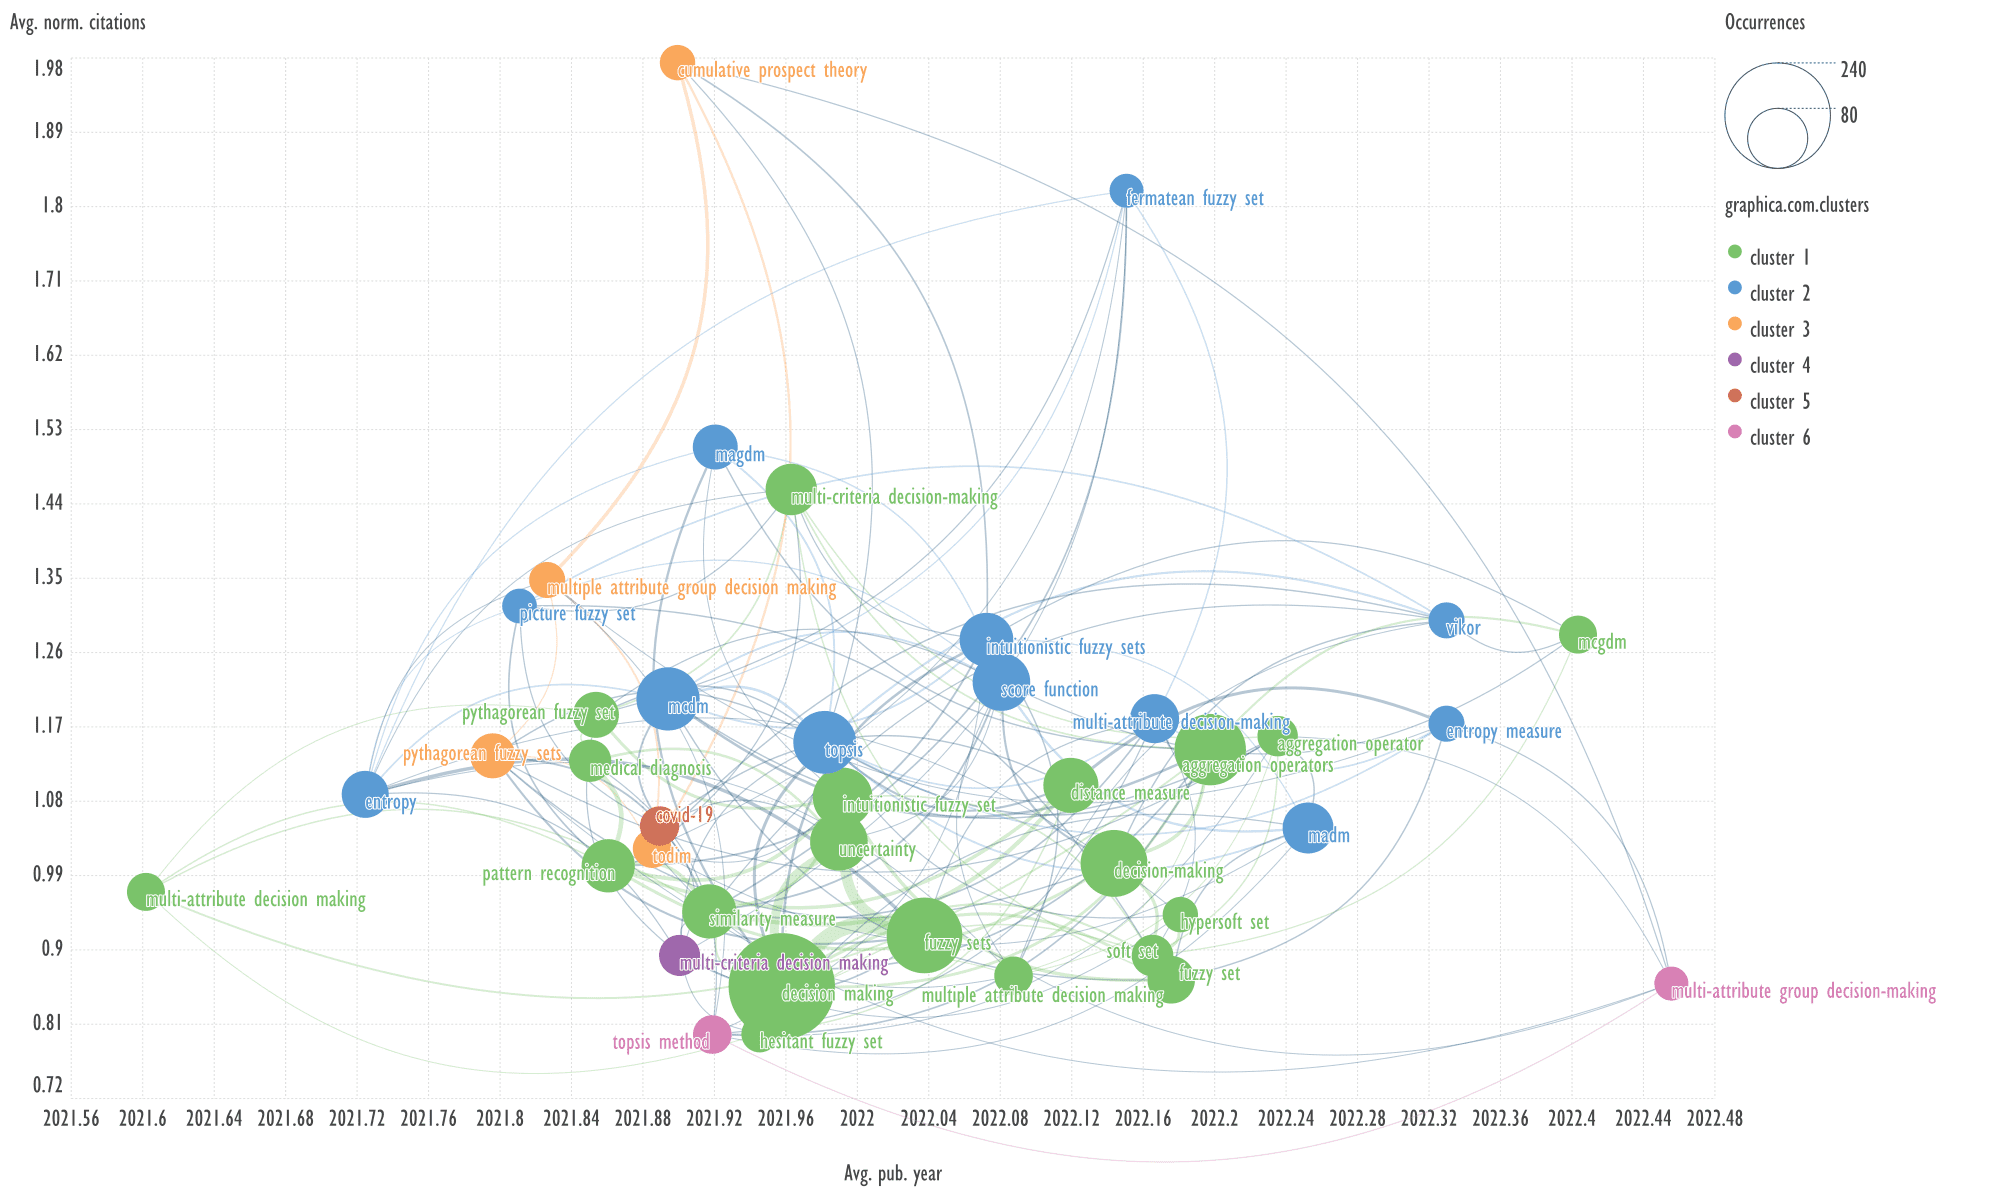
Fig. 6. Visualization of keyword clusters of the first cluster of
bibliometric records, obtained by Scimago Graphica
An example of keywords from other clusters
related to the term 'aggregation operators'
→
multi-criteria decision making, topsis method.
Header generation for the query by
elicit.com: "Aggregation Operators in Multi-Criteria Decision Making Using
TOPSIS Method".
Note: Technique for Order Preference by
Similarity to Ideal Solution — TOPSIS.
A highly-cited publication: "Fermatean
fuzzy TOPSIS method with Dombi aggregation operators and its application in
multi-criteria decision making" [30]. The abstract contains 162 words.
Summary by Elicit: "This paper
develops new Fermatean fuzzy aggregation operators using Dombi operations,
analyzes their properties, compares them to existing operators, and applies
them to a Fermatean fuzzy TOPSIS decision-making method." The text is 29
words long.
Summary by QuillBot: "This paper
explores the use of Dombi operations in decision-making problems, specifically
aggregation operators. It develops Fermatean fuzzy aggregation operators,
including the Fermatean fuzzy Dombi weighted average operator, Fermatean fuzzy
Dombi weighted geometric operator, Fermatean fuzzy Dombi ordered weighted
average operator, Fermatean fuzzy Dombi ordered weighted geometric operator,
Fermatean fuzzy Dombi hybrid weighted average operator, and Fermatean fuzzy
TOPSIS to understand their impact on decision-making." The text is 65
words long.
Explore Top Shared Citations &
References by Litmaps: https://app.litmaps.com/preview/30709029.
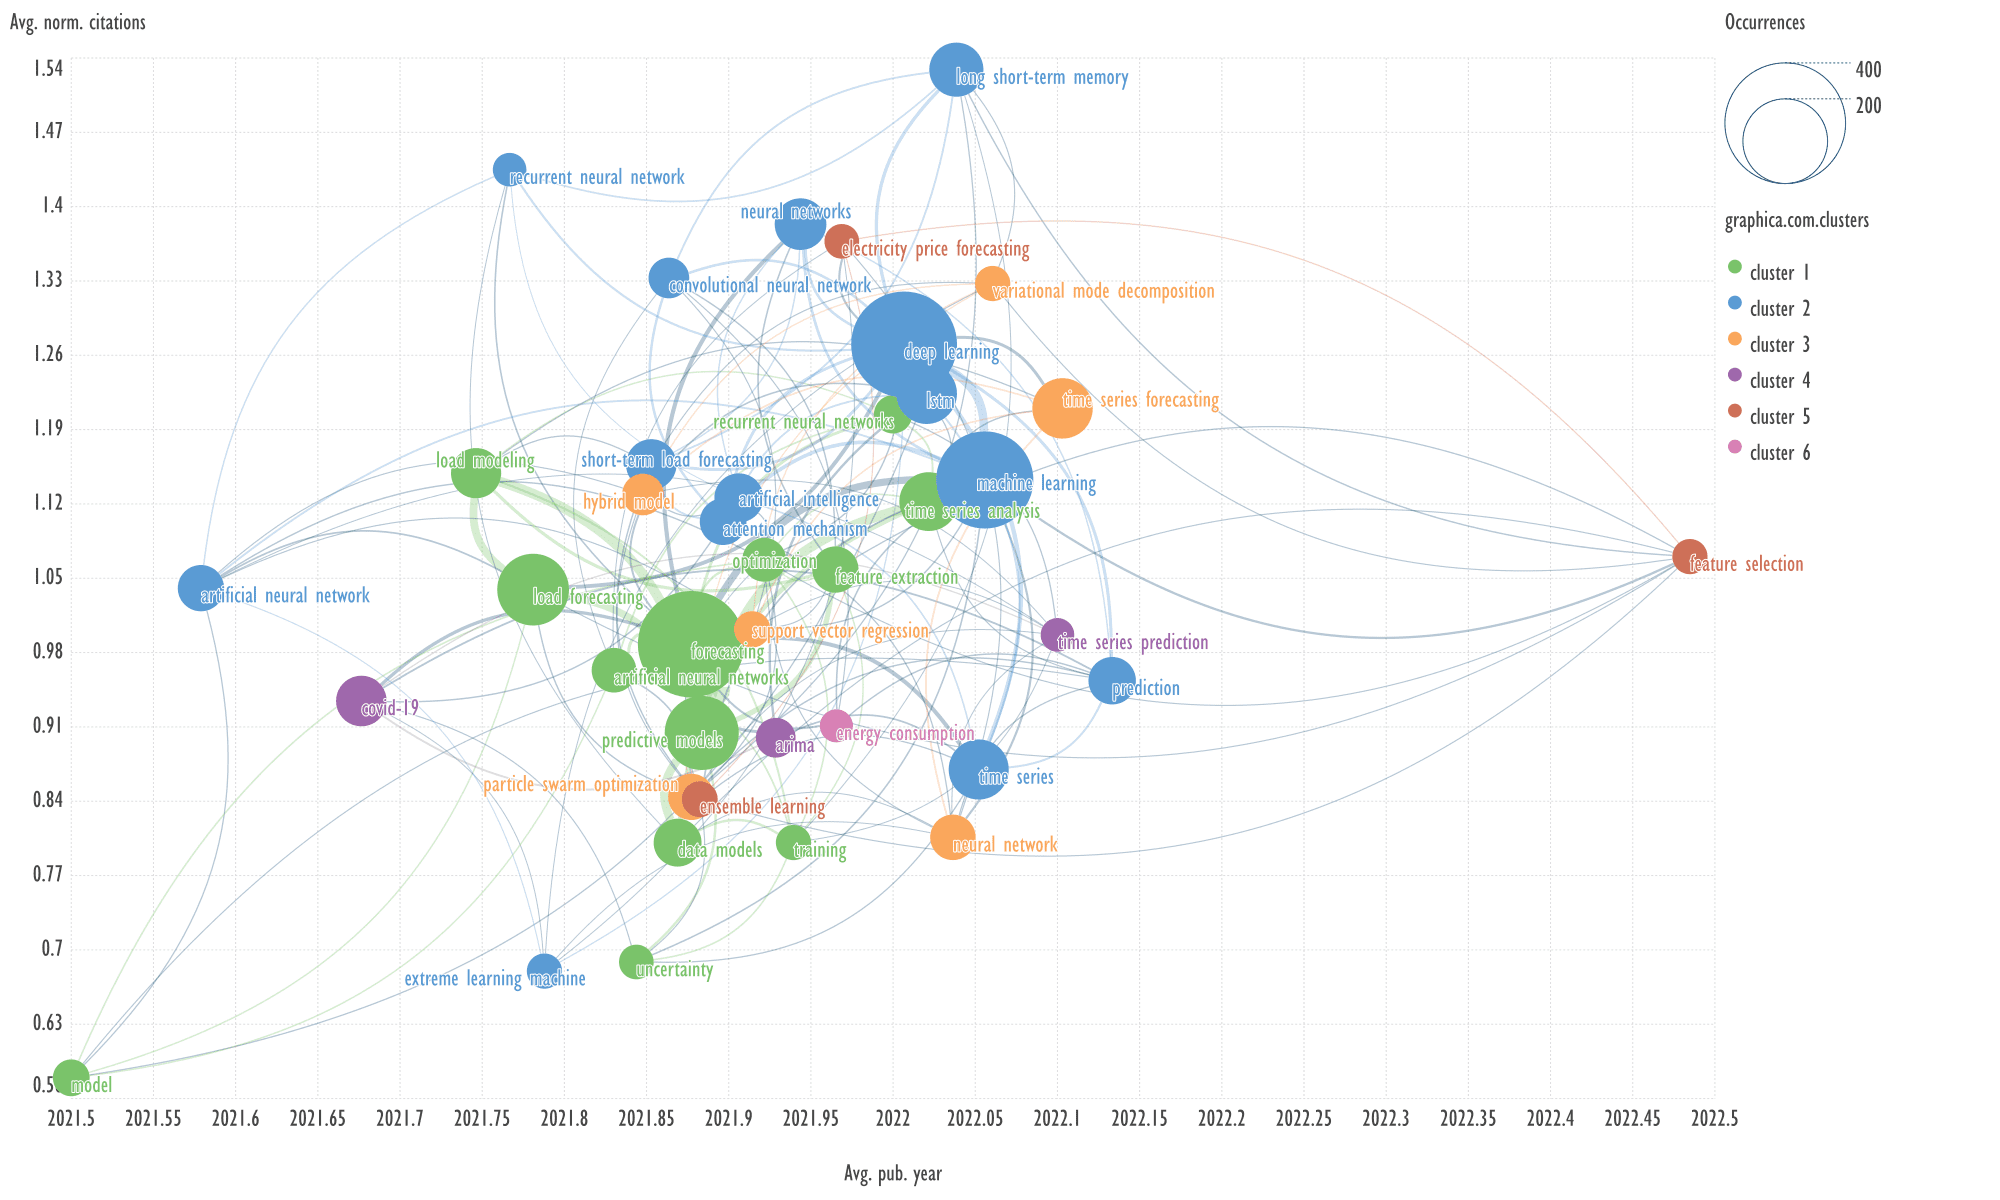
Fig. 7. Visualization of keyword clusters of the second cluster of
bibliometric records, obtained by Scimago Graphica
An example of keywords from other cluster
related to the term 'long short-term memory'
→
variational mode decomposition, particle swarm optimization.
Header generation for the query by elicit.com:
"Integrating LSTM, VMD, and PSO".
Note: long short-term memory (LSTM)
networks, particle swarm optimization (PSO), variational mode decomposition
(VMD).
A highly-cited publication: "Blood
Glucose Prediction with VMD and LSTM Optimized by Improved Particle Swarm
Optimization" [31]. The abstract contains 282 words.
Summary by Elicit: "A short-term blood
glucose prediction model (VMD-IPSO-LSTM) combining variational modal
decomposition and improved particle swarm optimization to optimize a long
short-term memory network was proposed and shown to achieve high prediction
accuracy at 30, 45, and 60 minutes in advance." The text is 40 words long.
Summary by QuillBot: "A short-term
blood glucose prediction model (VMD-IPSO-LSTM) was proposed to improve accuracy
in diabetics' time series. The model decomposes blood glucose concentrations
using the VMD method to reduce non-stationarity. The model uses the Long
short-term memory network (LSTM) to predict each component IMF. The Particle
swarm optimization algorithm optimizes parameters like number of neurons,
learning rate, and time window length. The model achieved high accuracy at
30min, 45min, and 60min in advance, with a decrease in RMSE and MAPE. This
improved accuracy and longer prediction time can enhance diabetes treatment
effectiveness." The text is 91 words long.
Explore Top Shared Citations &
References by Litmaps: https://app.litmaps.com/preview/124602571.
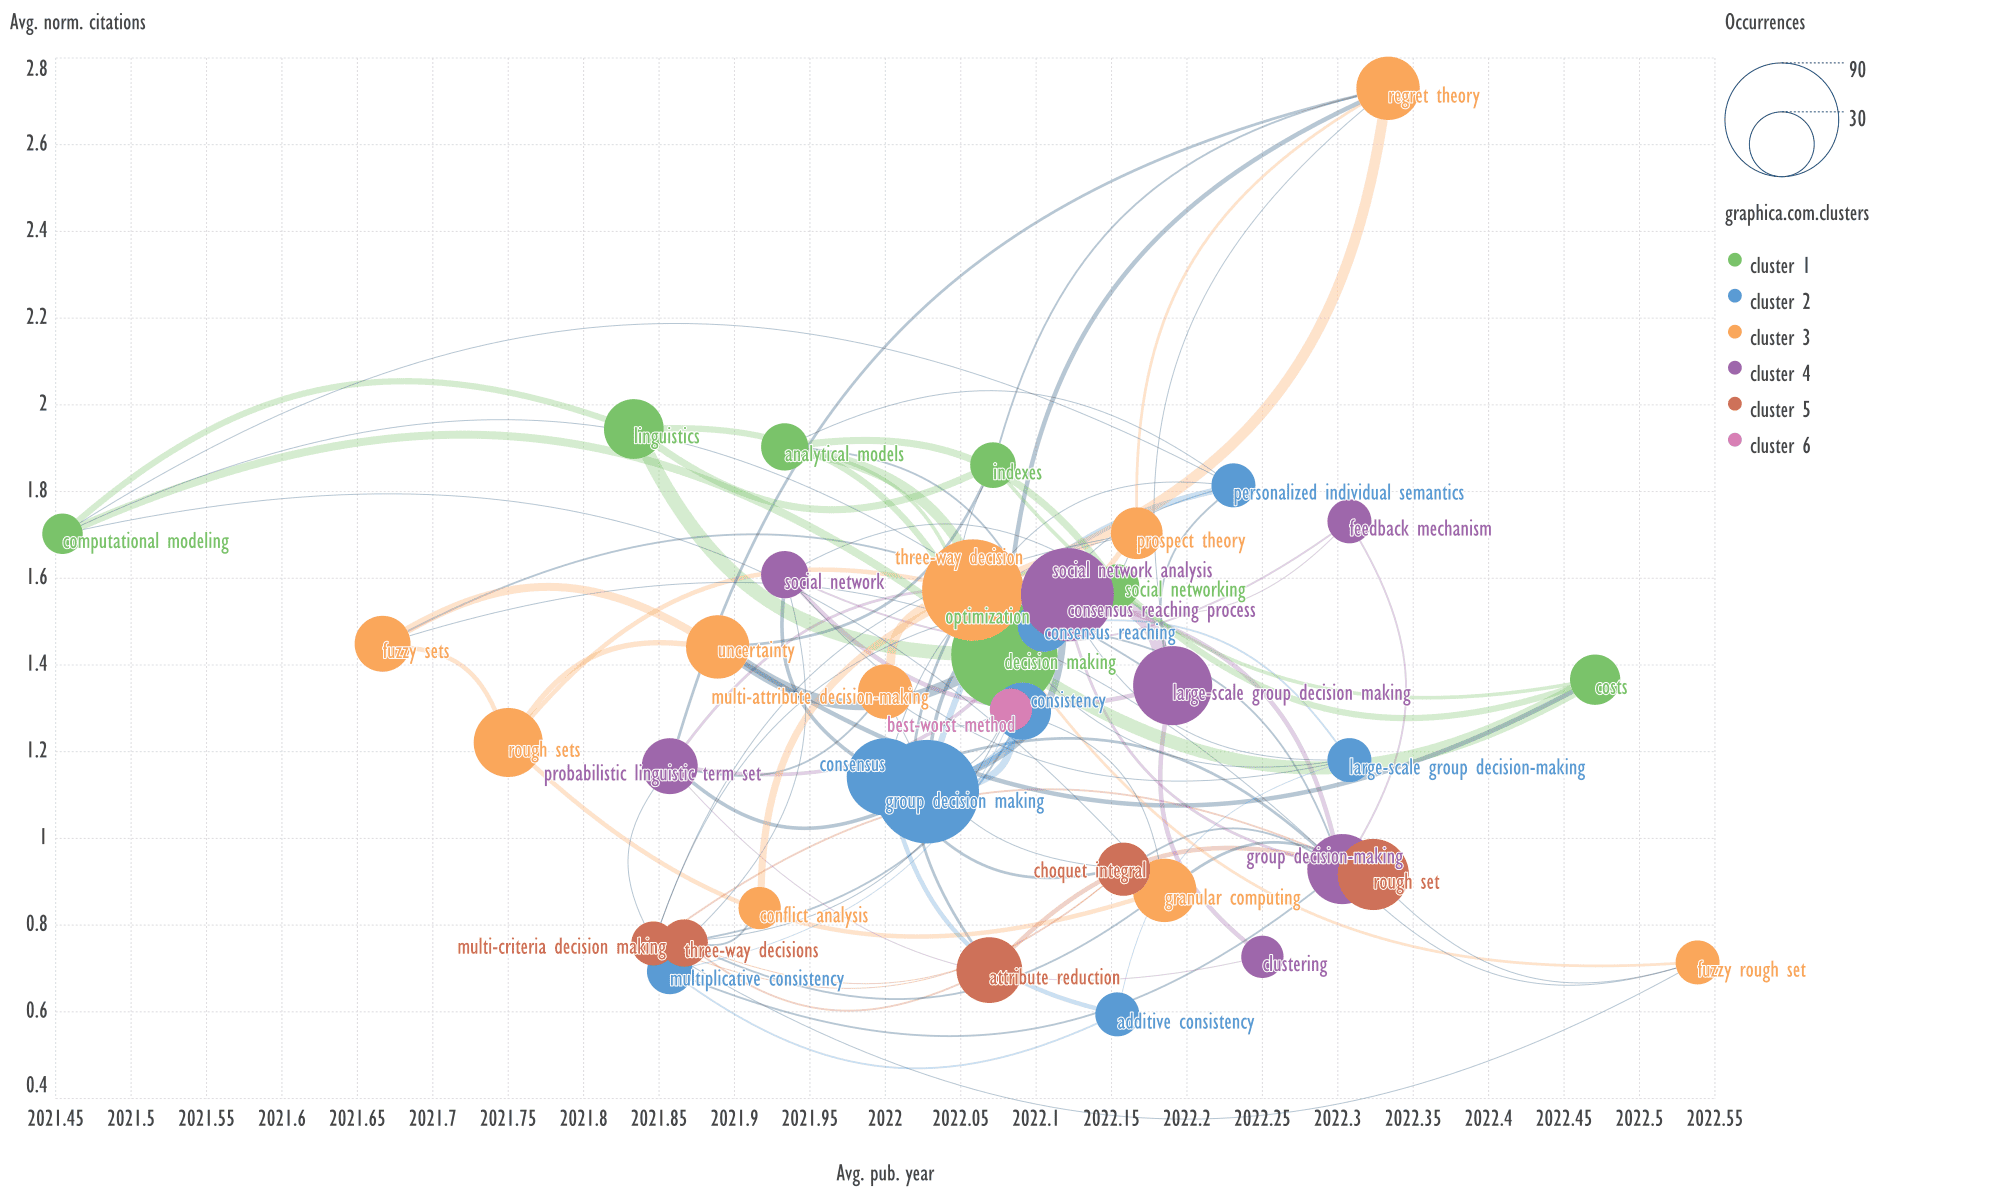
Fig. 8. Visualization of keyword clusters of the third cluster of
bibliometric records, obtained by Scimago Graphica
An example of keywords from other cluster
related to the term 'group decision making'
→
probabilistic linguistic term set, social network analysis.
Header generation for the query by
elicit.com: "Group Decision Making with Probabilistic Linguistic Term Sets
using Social Network Analysis".
A highly-cited publication:
"Consistency and trust relationship-driven social network group
decision-making method with probabilistic linguistic information" [32].
The abstract contains 196 words.
Summary by Elicit: "This paper
presents a novel probabilistic linguistic group decision-making method that
uses consistency-adjustment and trust relationship-driven expert weight
determination to determine a reliable ranking of alternatives." The text
is 26 words long.
Summary by QuillBot: "This paper
presents a novel probabilistic linguistic GDM method, focusing on
consistency-adjustment and expert weights determination. It redefines
multiplicative consistency of probabilistic linguistic preference relations
(PLPRs), proposes a convergent consistency-adjustment algorithm, and develops a
trust relationship-driven expert weight determination model. The method is
designed to determine reliable ranking of alternatives and is illustrated
through a case study on logistics service suppliers evaluation." The text
is 62 words long.
Note: GDM — group decision-making.
Explore Top Shared Citations & References by Litmaps: https://app.litmaps.com/preview/188493784.
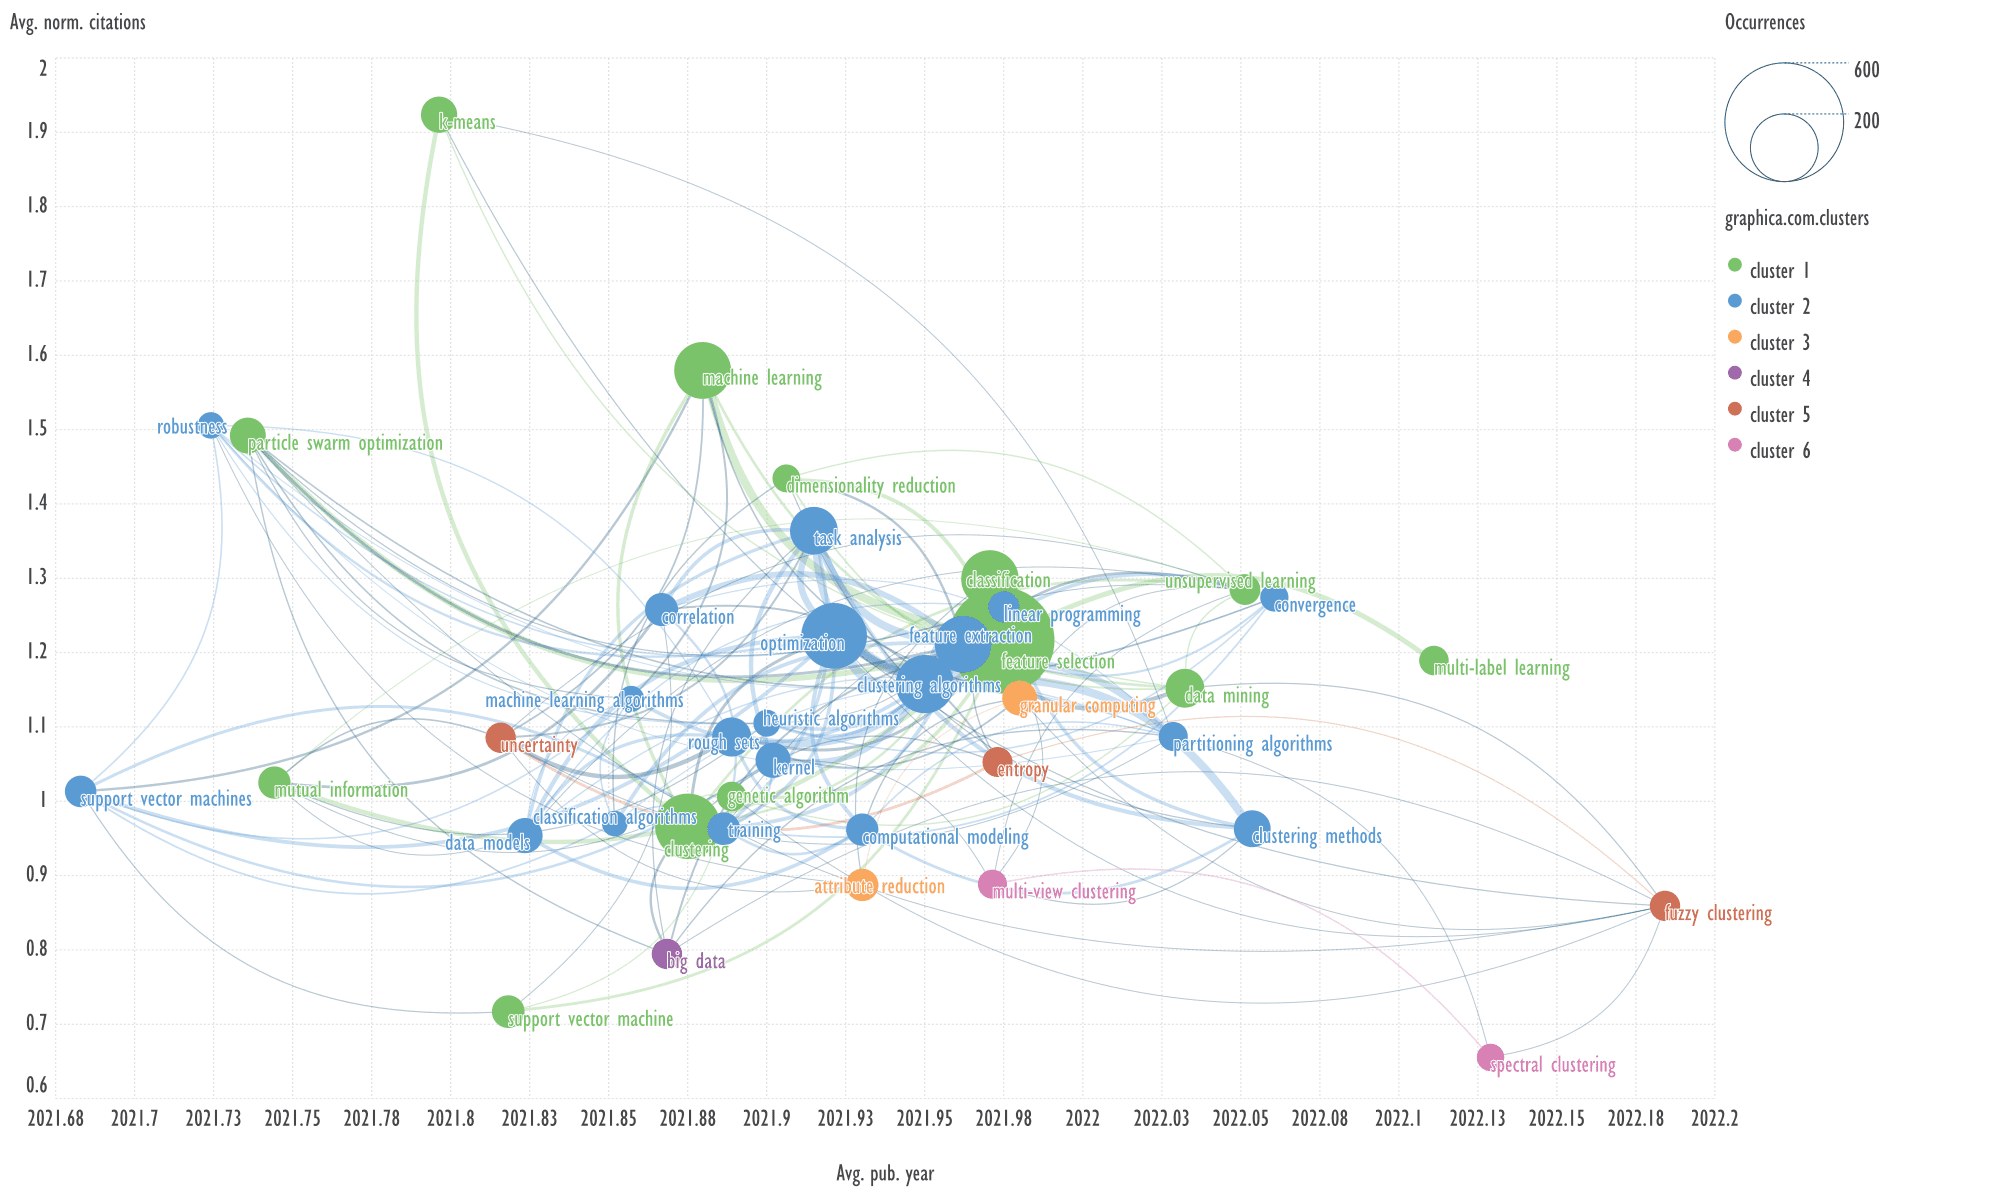
Fig. 9. Visualization of keyword clusters of the fourth cluster of
bibliometric records, obtained by Scimago Graphica
An example of keywords from other cluster
related to the term 'dimensionality reduction'
→
feature extraction, clustering algorithms.
Header generation for the query by
elicit.com: "Advanced Techniques in Data Analysis".
A highly-cited publication:
"Randomized Dimensionality Reduction for k-Means Clustering" [33].
The abstract contains 245 words.
Summary by Elicit: "This paper
presents new provably accurate randomized dimensionality reduction methods,
including feature selection and feature extraction approaches, that provide
constant-factor approximation guarantees for the k-means clustering
objective." The text is 27 words long.
Summary by QuillBot: "This paper
explores dimensionality reduction for k-means clustering, a method that
combines feature selection and extraction. Despite the importance of k-means
clustering, there is a lack of provably accurate feature selection methods. Two
known methods are random projections and singular value decomposition (SVD).
The paper presents the first accurate feature selection method and two feature
extraction methods, improving time complexity and feature extraction. The
algorithms are randomized and provide constant-factor approximation guarantees
for the optimal k-means objective value." The text is 78 words long.
Explore Top Shared Citations &
References by Litmaps: https://app.litmaps.com/preview/261485341.
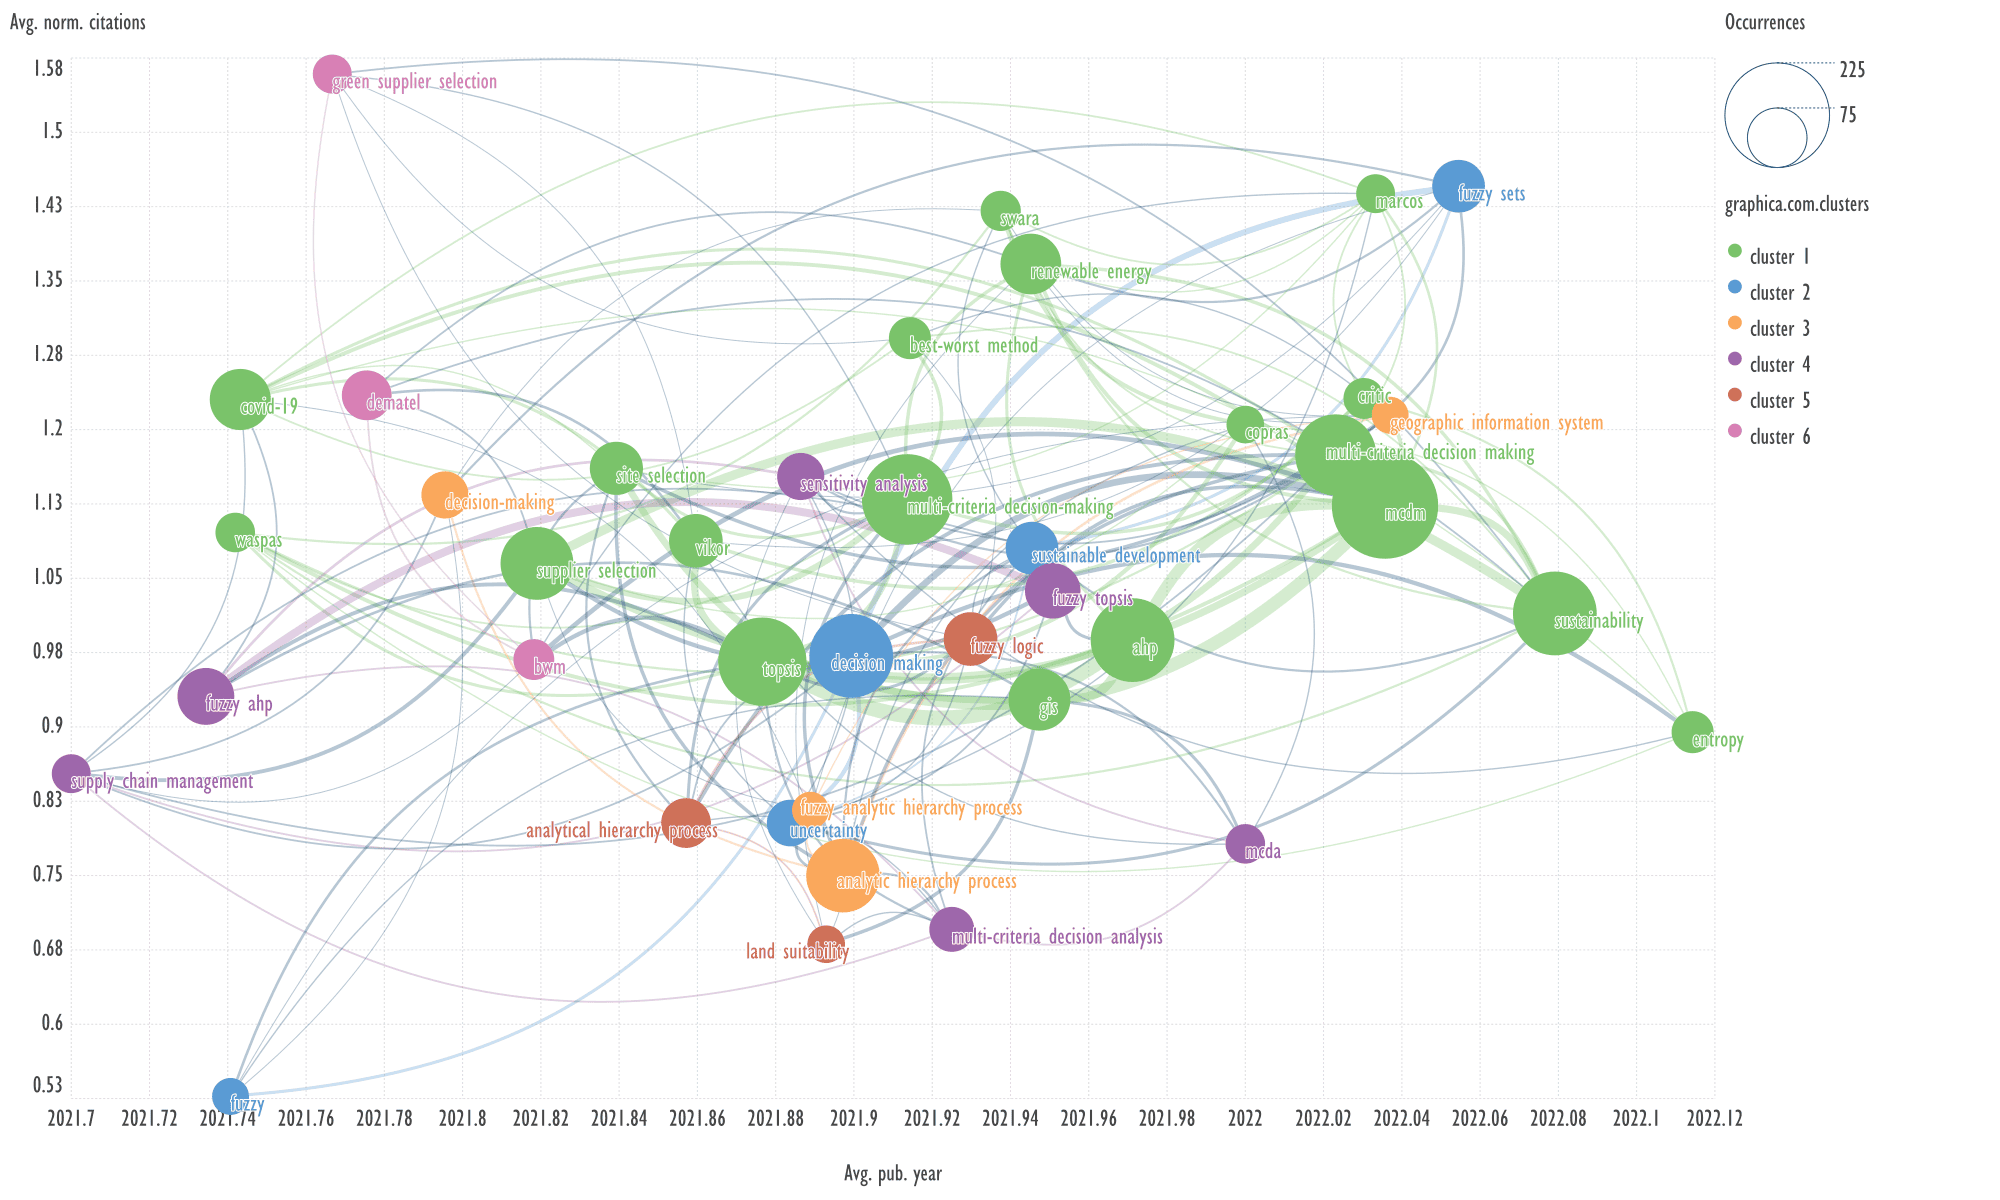
Fig. 10. Visualization of keyword clusters of the fifth cluster of
bibliometric records, obtained by Scimago Graphica
An example of keywords from other clusters
related to the term 'multi-criteria decision-making'
→
sensitivity analysis, analytical hierarchy process.
Header generation for the query by
elicit.com: "Analyzing Multi-Criteria Decision-Making with Sensitivity
Analysis in AHP".
A highly-cited publication: "Spatial
sensitivity analysis of multi-criteria weights in GIS-based land suitability
evaluation" [34]. The abstract contains 200 words.
Summary by Elicit: "The paper presents
a novel approach to examining the sensitivity of a GIS-based multi-criteria
decision-making model to the weights of input parameters, and demonstrates its
application in a case study of irrigated cropland suitability assessment. A
tool incorporating the OAT method with the Analytical Hierarchy Process."
The text is 46 words long.
Summary by QuillBot: "This paper
presents a novel approach to examining the multi-criteria weight sensitivity of
a GIS-based MCDM model. It explores the dependency of model output on input
parameter weights, identifying criteria sensitive to weight changes, and their
impacts on spatial dimensions. A tool incorporating the OAT method with the
Analytical Hierarchy Process (AHP) within the ArcGIS environment is
implemented, allowing user-defined simulations to quantitatively evaluate model
dynamic changes and display spatial change dynamics." The text is 72 words
long.
Note: OAT — one-at-a-time.
Explore Top Shared Citations &
References by Litmaps: https://app.litmaps.com/preview/100228499.
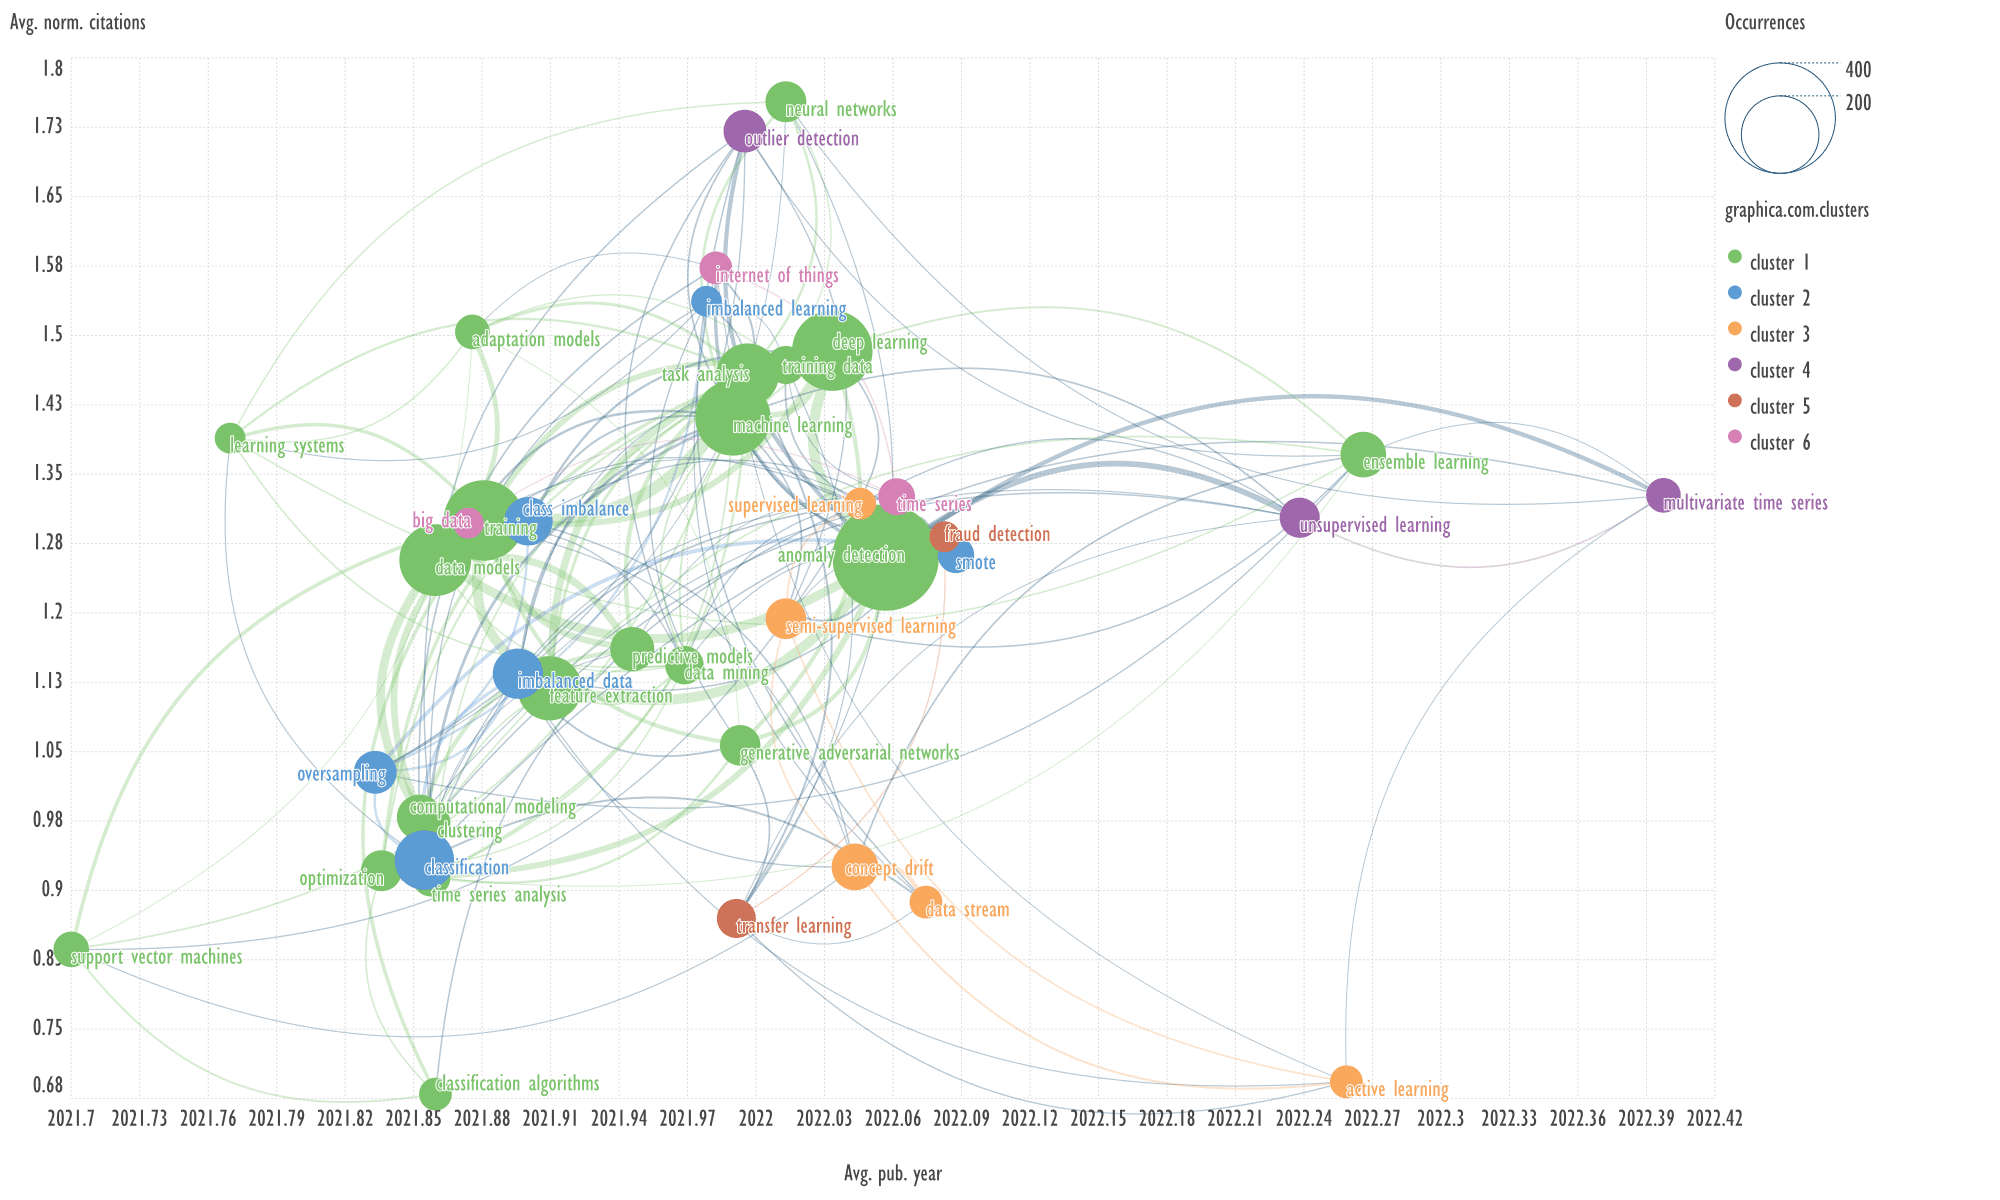
Fig. 11. Visualization of keyword clusters of the sixth cluster of
bibliometric records, obtained by Scimago Graphica
An example of keywords from other clusters
related to the term 'anomaly detection'
→
internet of things, multivariate time series.
Header generation for the query by
elicit.com: "Anomaly Detection in IoT Multivariate Time Series".
A highly-cited publication: "Real-Time
Deep Anomaly Detection Framework for Multivariate Time-Series Data in
Industrial IoT" [35]. The abstract contains 264 words.
Summary by Elicit: "The paper presents
a hybrid deep learning framework for real-time anomaly detection in industrial
IoT time-series data, which combines CNN and two-stage LSTM-based autoencoder
and outperforms other state-of-the-art models." The text is 29 words long.
Summary by QuillBot: "The Industrial
Internet of Things (IIoT) generates dynamic, large-scale, heterogeneous, and
time-stamped data that can significantly impact industrial processes. To detect
anomalies in real-time, a hybrid end-to-end deep anomaly detection framework is
proposed. This framework uses a convolutional neural network and a two-stage
long short-term memory (LSTM)-based Autoencoder to identify short- and
long-term variations in sensor values. The model is trained using the Keras/TensorFlow
framework, achieving better performance than other competitive models. The
model is also designed for network edge devices, demonstrating its potential
for anomaly detection." The text is 87 words long.
Explore Top Shared Citations &
References by Litmaps: https://app.litmaps.com/preview/249750711.
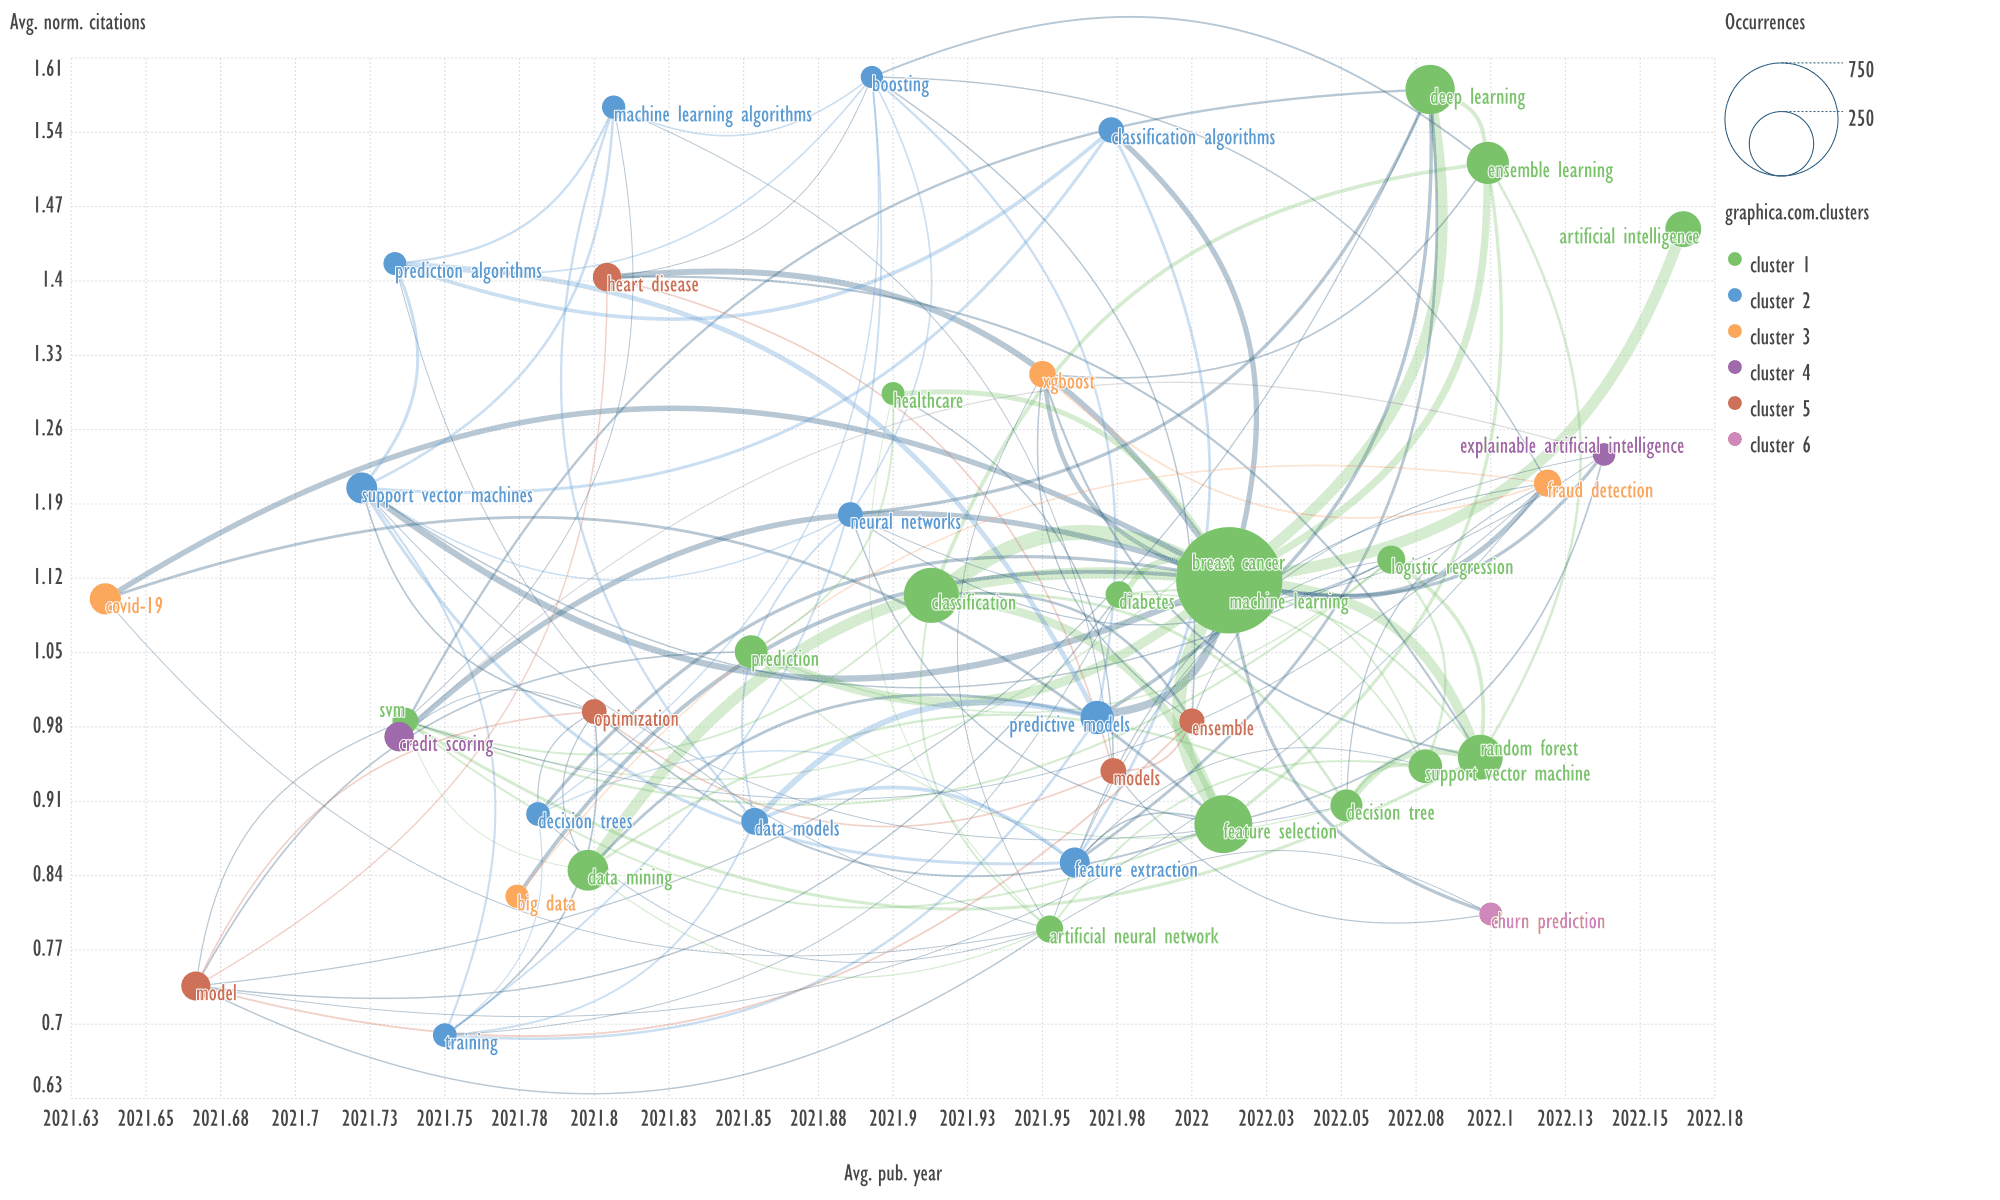
Fig. 12. Visualization of keyword clusters of the seventh cluster of
bibliometric records, obtained by Scimago Graphica
An example of keywords from other clusters
related to the term 'fraud detection'
→
decision tree, feature
extraction.
Header generation for the query by
elicit.com: "Enhancing Fraud Detection Using Decision Trees and Feature
Extraction".
A highly-cited publication: "A cost-sensitive
decision tree approach for fraud detection" [36]. The abstract contains
209 words.
Summary by Elicit: "The paper presents
a new cost-sensitive decision tree approach for credit card fraud detection
that outperforms traditional classification models and can help reduce
financial losses from fraudulent transactions." The text is 28 words long.
Summary by QuillBot: "The study
presents a cost-sensitive decision tree approach for fraud detection, focusing
on minimizing misclassification costs and selecting splitting attributes at
non-terminal nodes. Compared to traditional classification models, this
approach outperforms existing methods in accuracy, true positive rate, and a
new cost-sensitive metric specific to credit card fraud detection. This approach
can help decrease financial losses due to fraudulent transactions and improve
fraud detection systems." The text is 65 words long.
Explore Top Shared Citations &
References by Litmaps: https://app.litmaps.com/preview/81760713.
Note: The highly cited publication proposed
by Elicit does not contain the term 'feature extraction'.
An alternative containing the term 'feature
extraction' can be found in the publication [37].
Note: It is not always possible to find a
suitable publication for three non-trivial terms.
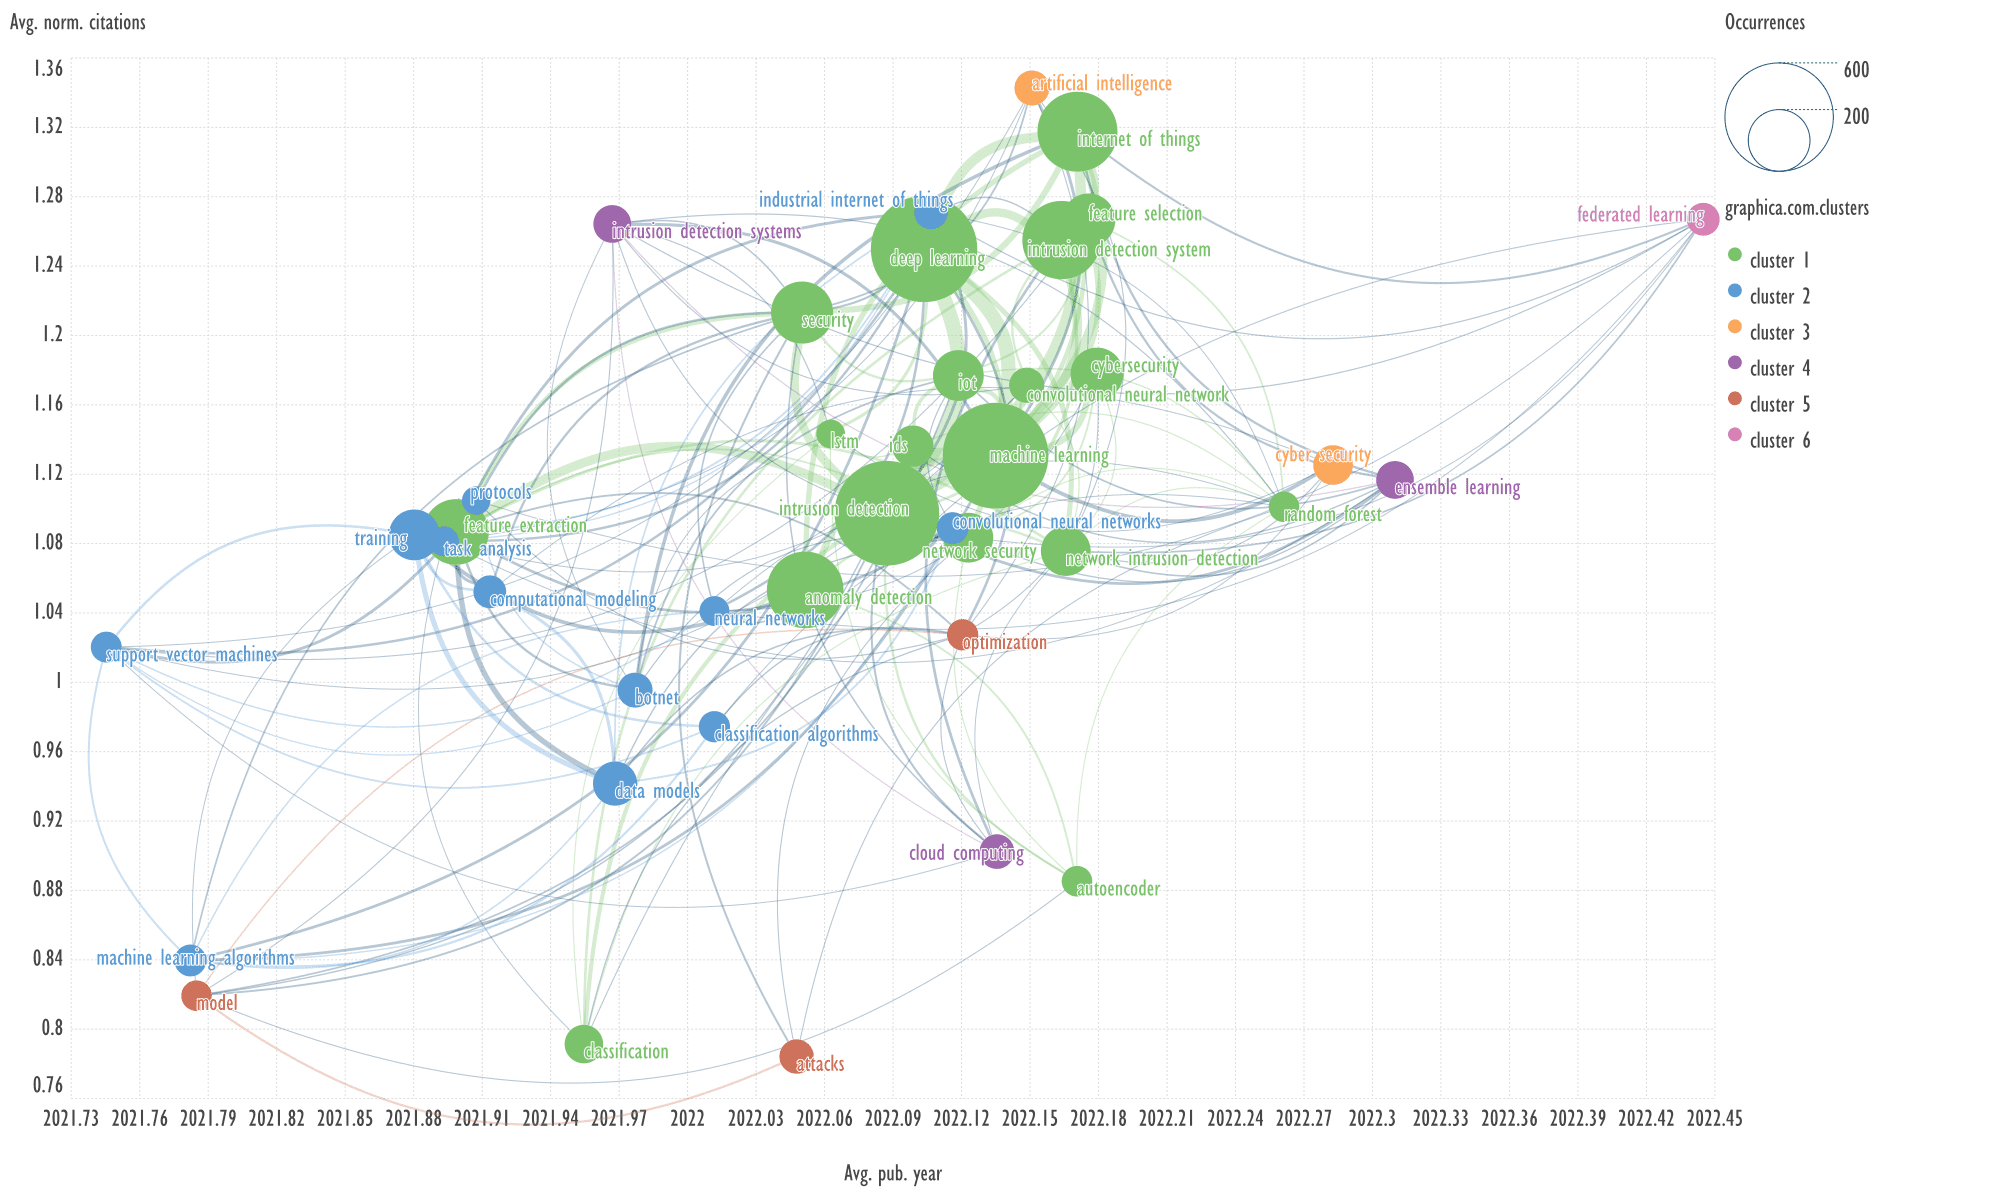
Fig. 13. Visualization of keyword clusters of the eighth cluster of
bibliometric records, obtained by Scimago Graphica
An example of keywords from other cluster
related to the term 'cyber security'
→
IISTM, network
intrusion detection, here: ISTM
—
Information Systems and Technology Management.
Header generation for the query by
elicit.com: "Cyber Security and Network Intrusion Detection in Information
Systems Management".
A highly-cited publication: "A Survey
of Data Mining and Machine Learning Methods for Cyber Security Intrusion
Detection" [38]. The abstract contains 104 words.
Summary by Elicit: "This paper
provides a survey of machine learning and data mining methods for cyber security
intrusion detection in wired networks." The text is 20 words long.
Summary by QuillBot: "This paper
surveys machine learning and data mining methods for cyber analytics, focusing
on intrusion detection. It provides tutorial descriptions, discusses the complexity
of algorithms, discusses challenges, and provides recommendations on when to
use each method in cyber security." The text is 39 words long.
Explore Top Shared Citations &
References by Litmaps: https://app.litmaps.com/preview/131981599.
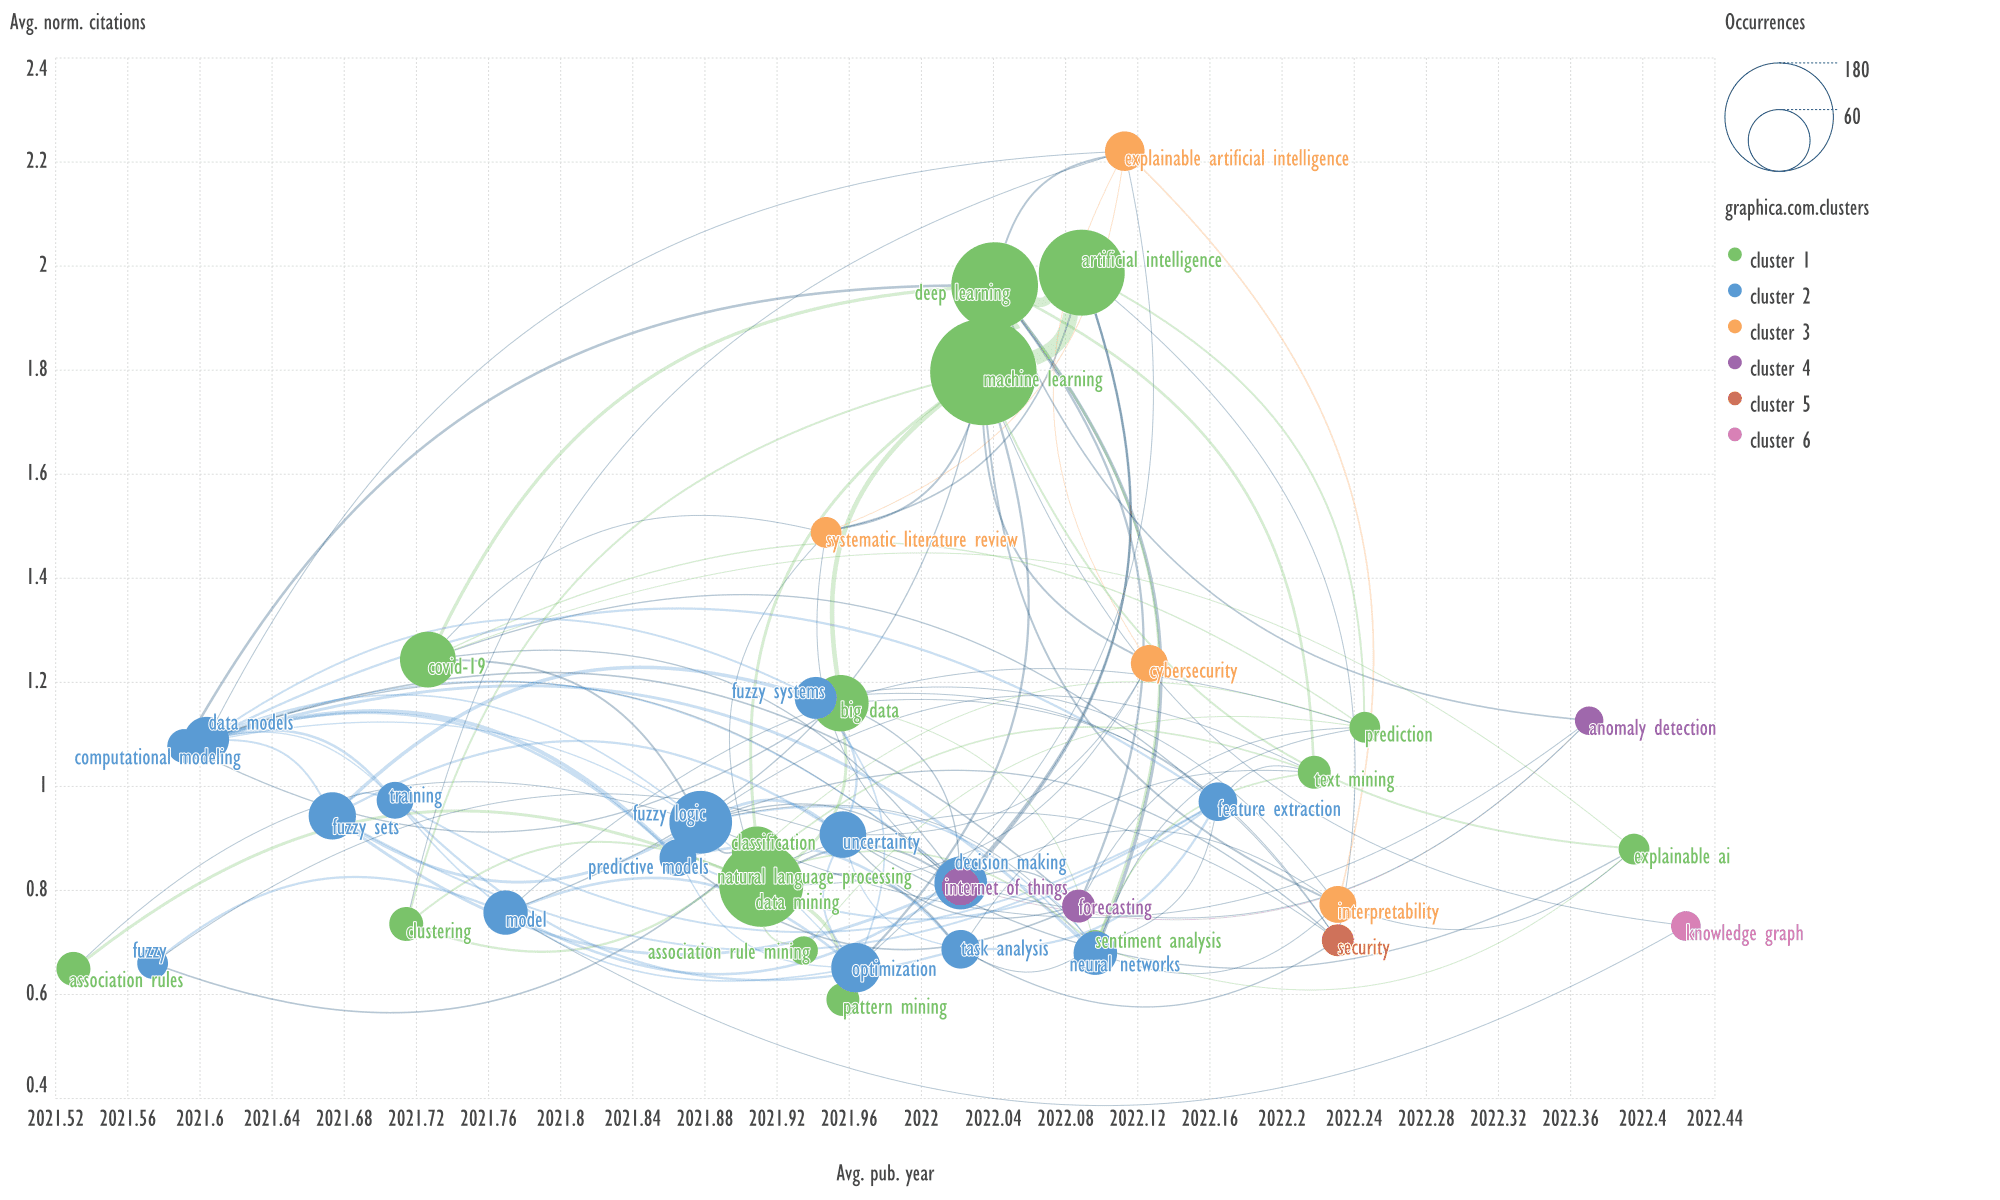
Fig.
14. Visualization of keyword clusters of the ninth cluster of bibliometric
records, obtained by Scimago Graphica
An example of keywords from other clusters
related to the term 'explainable artificial intelligence'
→
clustering, data models.
Header generation for the query by
elicit.com: "Exploring Explainable AI in Clustering Data Models".
A highly-cited publication:
"Explainable Artificial Intelligence: a Systematic Review" [39]. The
abstract contains 99 words.
Summary by Elicit: "This systematic
review provides a hierarchical classification of methods for Explainable
Artificial Intelligence (XAI) and summarizes the state-of-the-art in the field,
while also recommending future research directions." The text is 27 words
long.
Summary by QuillBot: "Explainable
Artificial Intelligence (XAI) has grown significantly due to deep learning
applications, resulting in highly accurate models but lack of explainability
and interpretability. This systematic review categorizes methods into review
articles, theories, methods, and evaluation, summarizing state-of-the-art, and
suggesting future research directions." The text is 42 words long.
Explore Top Shared Citations &
References by Litmaps: https://app.litmaps.com/preview/260847294.
In the considered data for clusters 0-9 the
expected result is obtained - a more complete 'Summary' gives a better idea of
the publication. Anti-plagiarism checks on free services such as https://www.plagiarismremover.net/plagiarism-checker
and https://plagiarismdetector.net/ did not reveal any plagiarism or signs of machine generation,
indicating the quality of the summaries obtained by Elicit and QuillBot.
Getting quality "Summaries" can allow subject matter experts to make
decisions whether it is appropriate to study the article in question in more
detail. When writing reports, the use of 'Summaries' will reduce the time
required to write the report, but it is advisable to check and manually edit
the AI-generated texts. This is also true for machine translation, where AI is
now actively used; no one has eliminated manual editing, but the acceleration
of the translation process is significant.
The Alluvial Diagram, shown in Fig. 15, is
a simple visual method for selecting multiple terms for queries on a topic. It
is most effective when presented as an interactive web page. In the attached
archive, the files KWs_3x3-003-101-Term-1.htm and KWs_3x3-003-101-Term-2.htm
provide examples of the active highlighting associated with the first term and
the second term, respectively.
The co-occurrence of the three terms was
assessed using the FP-grows utility.
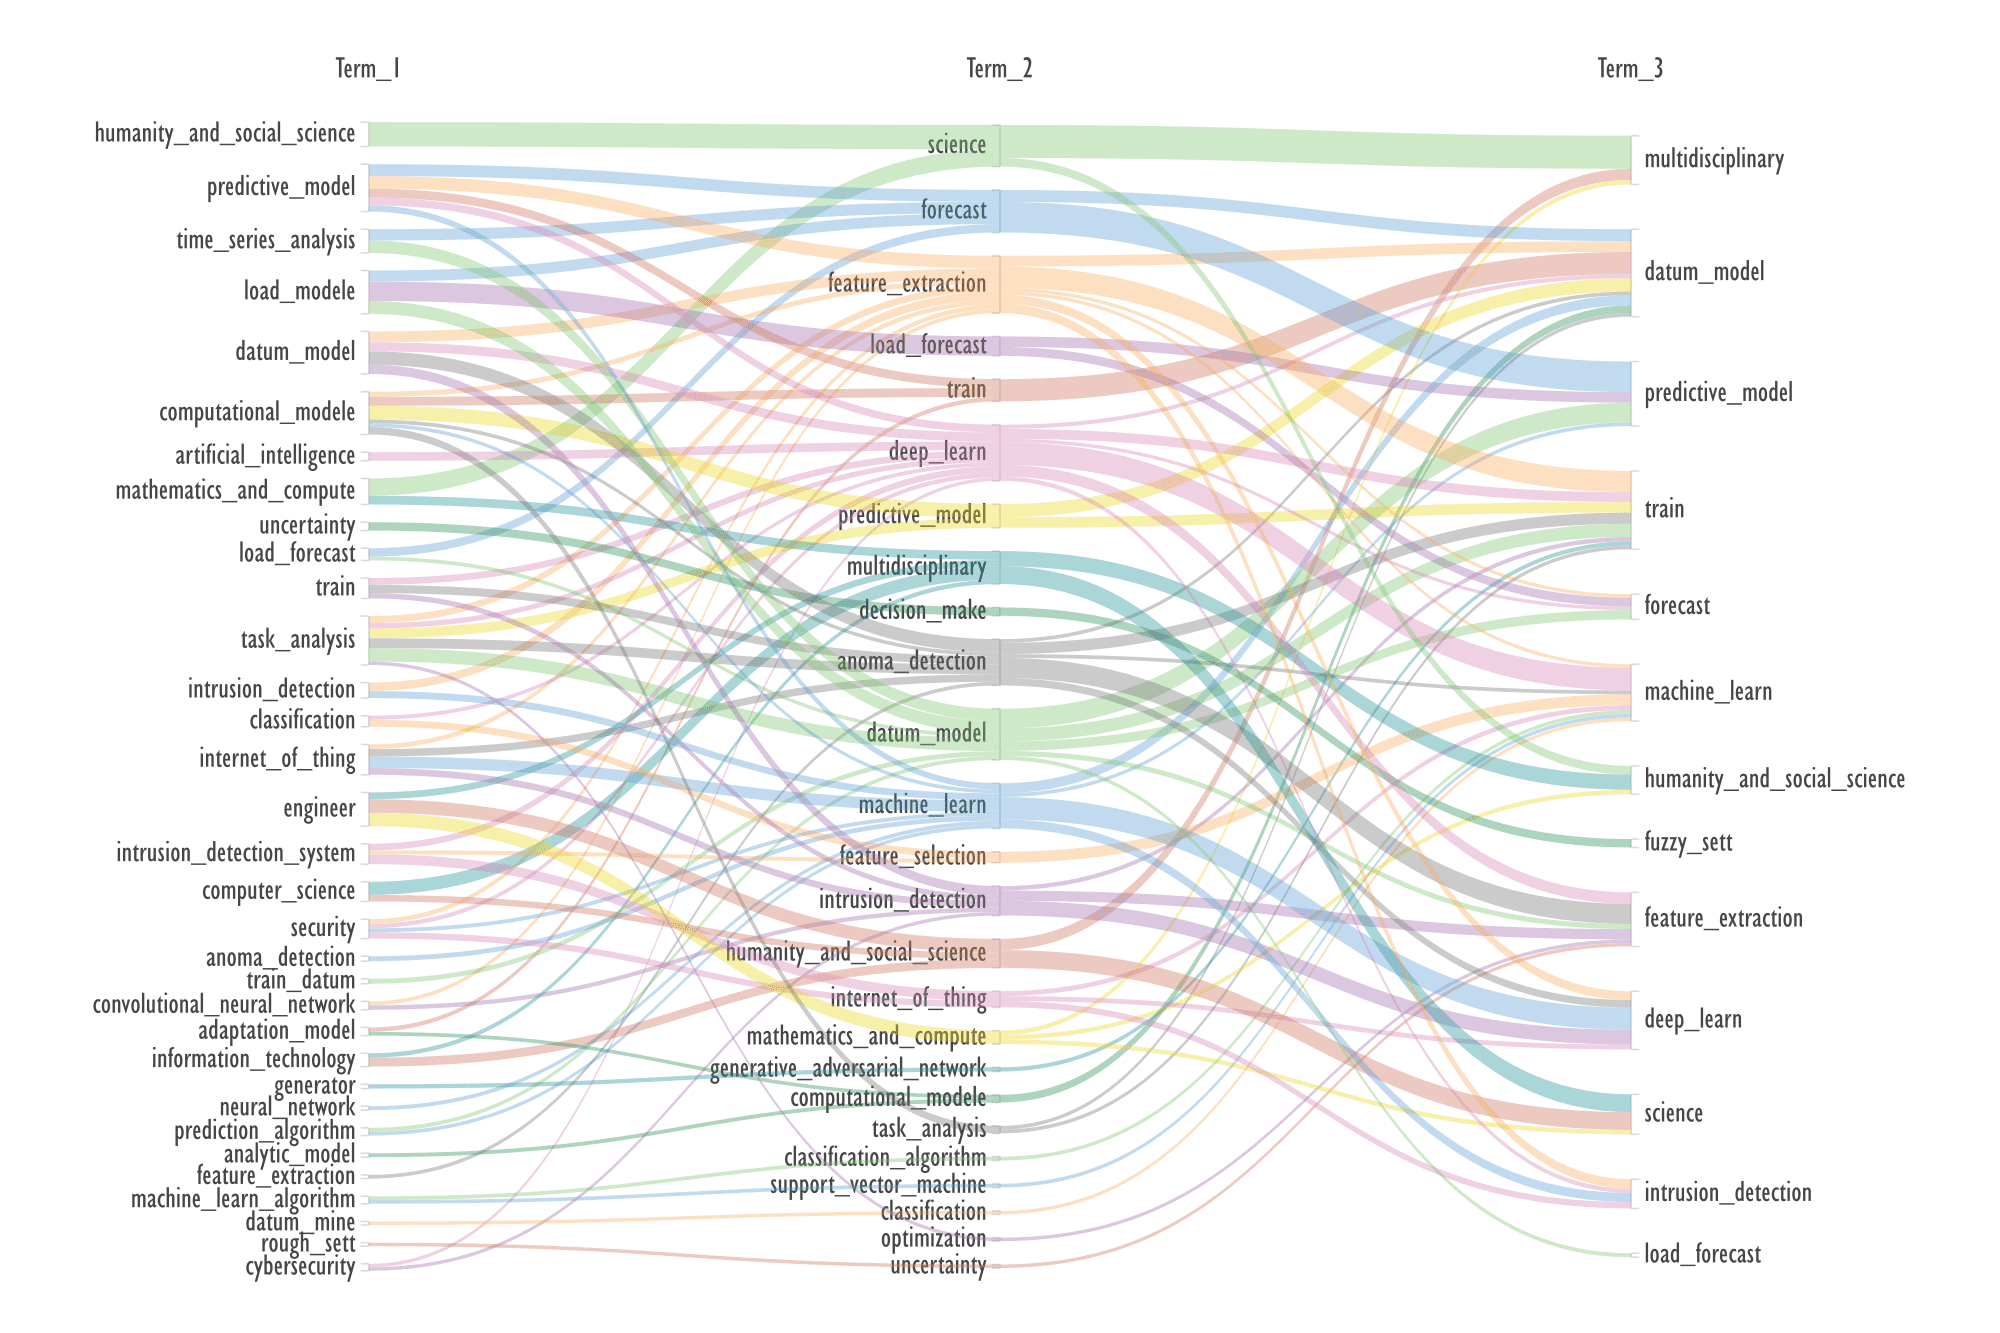
Fig.15. Alluvial diagram based on the most frequent co-occurrence of
three terms from the 'Publication Keywords' column
For example, three co-occurring terms
'train
→
intrusion detection, feature extraction' are selected, for them:
Header generation for the query by
elicit.com: "Intrusion Detection in Train Systems Using Feature
Extraction".
The closest to the subject described by
these three terms is the work proposed by elicit.com: "A New Feature
Extraction Method of Intrusion Detection" [40]. The abstract contains 62
words — very brief abstract.
Summary by Elicit: "The paper presents
a new feature extraction method for intrusion detection that uses kernel
principal component analysis and a reduced computation RSVM method to improve
training speed and classification performance." The text is 30 words long.
Summary by QuillBot: "The paper
employs kernel principal component analysis and RSVM to extract features from
intrusion detection training samples, enhancing training speed and
classification effect." The text is23 words long. Summary by QuillBot is
shorter than by Elicit, which can be explained by very brief abstract.
Explore Top Shared Citations &
References by Litmaps: https://app.litmaps.com/preview/98348741.
The possible lack of citation of this
article can be explained by the fact that it was published in: 2009 First
International Workshop on Education Technology and Computer Science and the
article is poorly indexed even in Google, the text itself is four-page theses,
the manuscript of which was only found on sci-hub.
This example is interesting because neither
elicit.com nor Litmaps provide a direct citation of the publication [40], but
Litmaps offers publications that cite the cited articles.
If we take the original bibliometric
records used in our work, the term 'feature extraction' occurs in 638 records
in which the term 'intrusion detection' appears in 109 records of which the
term 'train' is found only in 32. This example shows how significantly the
sample of publications corresponding to the three terms in the query is
reduced. These terms were chosen algorithmically and are not random, for three
terms not specifically picked the sample reduction would be even greater. This
indicates the usefulness of algorithmically selecting three or more terms to
find relevant literature.
In a sample of 32 publications, the article
[41] is a good example, containing three analyzed terms. For this article, the
'Publication Keywords' field consists of the terms 'Intrusion detection,
Mathematical models, Feature extraction, Training, Standards, Statistical
analysis, Numerical models'; and the Times of Cited field indicates that the
article has been cited 27 times.
If using the title of this article as a
query to elicit.com: "An Agile Approach to Identify Single and Hybrid
Normalization for Enhancing Machine Learning-Based Network Intrusion
Detection", this article is the first to appear in the list. For which:
Header generation for the query by
elicit.com: "Agile Normalization for ML-Based Intrusion Detection".
Summary by Elicit: "The paper proposes
a statistical method to identify the most suitable data normalization technique
for improving the performance of machine learning-based intrusion detection
systems".
I.e. the terms 'train, feature extraction'
do not appear here, they are in the keywords of the 'Publication Keywords'
column, but in the text of the paper itself the following keywords are given:
'Anomaly detection, Bot-IoT, CIC-IDS 2017, intrusion detection, IoT, ISCX-IDS
2012, normalization, NSL KDD, skewness, scaling, transformation, UNSW-NB15'.
The reason for these results is shown in Table 3 and is related to the
structure of the bibliometric data of the IEEE Xplore platform.
Table 3. Author Keywords and IEEE Terms for
two publications exported from the IEEE Xplore platform
|
DOI
|
Author Keywords
|
IEEE Terms
|
|
10.1109/ETCS.2009.373
Ref. 33
|
RSVM;KPCA;intrusion
detection;PSVM
|
Feature
extraction;Intrusion detection;Principal component analysis;Data
mining;Educational technology;Paper technology;Kernel;Support vector
machines;Educational institutions;Support vector machine classification
|
|
10.1109/ACCESS.2021.3118361
|
Anomaly
detection;Bot-IoT;CIC-IDS 2017;intrusion detection;IoT;ISCX-IDS
2012;normalization;NSL KDD;skewness;scaling;transformation;UNSW-NB15
|
Intrusion
detection;Mathematical models;Feature extraction;Training;Standards;Statistical
analysis;Numerical models
|
The table shows that the 'Publication
Keywords' field of the Scilit platform includes terms from the IEEE Terms field
of the IEEE Xplore platform and not author keywords.
This is a rather typical example of the
fact that there are not, and cannot be, the only true solutions in bibliometric
and textual analysis. Such analysis, especially in combination with
visualization tools and third-party services using AI, only acts as an
effective clue to formulate relevant questions for further research on the
topic.
Despite its simplicity, Alluvial Diagram is
very flexible - diagrams can be created not only by frequency of co-occurrence
of terms, but also by time of publication, average citation and other
parameters.
While the co-occurrence of a keyword pairs
can be represented by various diagrams, including a network, the possibilities
for visualizing the co-occurrence of three or more terms are more limited.
Alluvial diagram has a significant disadvantage
- for a large number of inputs (colors) the visibility of the diagram
decreases. To overcome this problem, the interactive web pages generated by the
Scimago Graphica program can be used.
Using the SVG format to represent diagrams
allows you to edit them, but also to copy terms of interest directly on the
diagram, thus speeding up the process of querying the abstract database.
It is shown that bibliometric data from the
open access abstract database Scilit can serve as a qualitative alternative to
databases available only by subscription.
The data exported from the Scilit platform
requires some pre-processing to make it available in a format that can be
processed by programs such as VOSviewer and Scimago Graphica.
The use of GSDMM and FP-growth algorithms
are effective in structuring bibliometric data, for their further visualization.
As a universal data visualization program,
Scimago Graphica offers great possibilities for constructing compound graphs,
in particular for representing the network of keywords in coordinates that are
important for bibliometric analysis, such as average year of publication and
average normalized citation, as well as for constructing Alluvial diagram of
co-occurrence of more than two keywords.
The possibility of using services such as
elicit.com, quillbot.com and app.litmaps.com to speed up the selection of
publications on the topic under study is shown.
The work was funded by the Ministry of
Science and Higher Education of the Russian Federation (State Assignment No.
125021302095-2).
1.
Li J. et al. Bibliometric Analysis for
Intelligent Assessment of Data Visualization // Computer Science and Education
/ ed. Hong W., Weng Y. Singapore: Springer Nature Singapore, 2023. Vol. 1811.
P. 363–373. doi: 10.1007/978-981-99-2443-1_32
2.
Szomszor M. et al. Interpreting Bibliometric
Data // Front. Res. Metr. Anal. 2021. Vol. 5. P. 628703. doi: 10.3389/FRMA.2020.628703
3.
Xu Y. et al. Bibliometrics and Visualization
Analysis of Knowledge Map in Metallurgical Field // Advances in Intelligent
Systems and Interactive Applications / ed. Xhafa F., Patnaik S., Zomaya A.Y.
Cham: Springer International Publishing, 2018. Vol. 686. P. 361–366. doi: 10.1007/978-3-319-69096-4_50
4.
Liao H. et al. A Bibliometric Analysis and
Visualization of Medical Big Data Research // Sustainability. 2018. Vol. 10, №
1. P. 166. doi: 10.3390/su10010166
5.
Vílchez-Román C., Sanguinetti S.,
Mauricio-Salas M. Applied bibliometrics and information visualization for
decision-making processes in higher education institutions // LHT. 2020. Vol.
39, № 1. P. 263–283. doi: 10.1108/LHT-10-2019-0209
6.
MDPI // Scilit: Scientific & Scholarly
Research Database. MDPI AG. URL: https://www.scilit.net/(accessed: 09.11.2024).
7.
Gu N., Hahnloser R.H.R. SciLit: A Platform for
Joint Scientific Literature Discovery, Summarization and Citation Generation.
2023. doi: 10.48550/arXiv.2306.03535
8.
Delgado-Quirós L., Ortega J.L.
Completeness degree of publication metadata in eight free-access scholarly
databases // Quantitative Science Studies. 2024. Vol. 5, № 1. P. 31–49. doi: 10.1162/qss_a_00286
9.
Venkatesan A. et al. SciLite: a platform for
displaying text-mined annotations as a means to link research articles with
biological data // Wellcome Open Res. 2016. Vol. 1. P. 25. doi: 10.12688/wellcomeopenres.10210.1
10.
Chigarev B. Analyzing the Possibilities of Using the Scilit Platform
to Identify Current Energy Efficiency and Conservation Issues. 2024. doi: 10.20944/preprints202404.0744.v1
11.
Hassan-Montero Y., De-Moya-Anegón F.,
Guerrero-Bote V.P. SCImago Graphica: a new tool for exploring and visually
communicating data // EPI. 2022. P. e310502. doi: 10.3145/epi.2022.sep.02
12.
Li L. The Study on Food Safety of 15 ‘RCEP’
Countries: Based on VOSviewer and Scimago Graphica // Science & Technology
Libraries. 2024. Vol. 43, № 2. P. 147–154. doi: 10.1080/0194262X.2023.2237560
13.
Chigarev B. Identification of Actual Bibliometric/Scientometric
Issues Based on 2018-2022 Data from the Lens Platform by Building Key Term
Co-occurrence Network. 2022. doi: 10.20944/preprints202212.0533.v1
14.
Van Eck N.J., Waltman L. Software survey:
VOSviewer, a computer program for bibliometric mapping // Scientometrics. 2010.
Vol. 84, № 2. P. 523–538. doi: 10.1007/s11192-009-0146-3
15.
Hassan-Montero Y., De-Moya-Anegón F.,
Guerrero-Bote V.P. SCImago Graphica: a new tool for exploring and visually
communicating data // EPI. 2022. P. e310502. doi: 10.3145/epi.2022.sep.02
16.
Inkscape Developers. Inkscape - Draw Freely. |
Inkscape [Electronic resource]. URL: https://inkscape.org/ (accessed:
09.11.2024)
17.
Borgelt C. Frequent item set mining // WIREs
Data Min & Knowl. 2012. Vol. 2, № 6. P. 437–456. doi: 10.1002/widm.1074
18.
Walker R. GSDMM: Short text clustering (Rust). | GSDMM [Electronic
resource]. URL: https://github.com/rwalk/gsdmm-rust/ (accessed: 09.11.2024)
19.
Yin J., Wang J. A Dirichlet multinomial mixture
model-based approach for short text clustering // Proceedings of the 20th ACM
SIGKDD international conference on Knowledge discovery and data mining. New
York New York USA: ACM, 2014. P. 233–242. doi: 10.1145/2623330.2623715
20.
Elicit: The AI Research Assistant [Electronic resource]. URL:
https://elicit.com/ (accessed: 09.11.2024).
21.
Litmaps | Your Literature Review Assistant
[Electronic resource]. URL: https://www.litmaps.com/ (accessed: 09.11.2024).
22.
QuillBot // Free AI Summarizer. URL: https://quillbot.com/summarize
(accessed: 09.11.2024).
23.
Tang Y. et al. A new basic probability assignment generation and
combination method for conflict data fusion in the evidence theory // Sci Rep.
2023. Vol. 13, № 1. P. 8443. doi: 10.1038/s41598-023-35195-4
24.
Dubois D. et al. The basic principles of uncertain information
fusion. An organised review of merging rules in different representation
frameworks // Information Fusion. 2016. Vol. 32. P. 12–39. doi: 10.1016/j.inffus.2016.02.006
25.
Liu P., Teng F. Multiple criteria decision-making method based on
normal interval
‐
valued intuitionistic fuzzy generalized aggregation operator //
Complexity. 2016. Vol. 21, № 5. P. 277–290. doi: 10.1002/cplx.21654
26.
Luo H. et al. Agent oriented intelligent fault diagnosis system
using evidence theory // Expert Systems with Applications. 2012. Vol. 39, № 3.
P. 2524–2531. doi: 10.1016/j.eswa.2011.08.104
27.
Clauset A., Newman M.E.J., Moore C. Finding community structure in
very large networks // Phys. Rev. E. 2004. Vol. 70, № 6. P. 066111. doi: 10.1103/PhysRevE.70.066111
28.
Xue Y., Deng Y. A decomposable Deng entropy // Chaos, Solitons &
Fractals. 2022. Vol. 156. P. 111835. doi: 10.1016/j.chaos.2022.111835
29.
Deng Y. Deng entropy // Chaos, Solitons & Fractals. 2016. Vol.
91. P. 549–553. doi: 10.1016/j.chaos.2016.07.014
30.
Aydemir S.B., Yilmaz Gunduz S. Fermatean fuzzy TOPSIS method with
Dombi aggregation operators and its application in multi-criteria decision
making // IFS. 2020. Vol. 39, № 1. P. 851–869. doi: 10.3233/jifs-191763
31.
Wang W., Tong M., Yu M. Blood Glucose Prediction
with VMD and LSTM Optimized by Improved Particle Swarm Optimization // IEEE
Access. 2020. Vol. 8. P. 217908–217916. doi: 10.1109/ACCESS.2020.3041355
32.
Jin F. et al. Consistency and trust relationship-driven social
network group decision-making method with probabilistic linguistic information
// Applied Soft Computing. 2021. Vol. 103. P. 107170. doi: 10.1016/j.asoc.2021.107170
33.
Boutsidis C. et al. Randomized Dimensionality Reduction for $k$
-Means Clustering // IEEE Trans. Inform. Theory. 2015. Vol. 61, № 2. P.
1045–1062. doi: 10.1109/TIT.2014.2375327
34.
Chen Y., Yu J., Khan S. Spatial sensitivity analysis of
multi-criteria weights in GIS-based land suitability evaluation //
Environmental Modelling & Software. 2010. Vol. 25, № 12. P. 1582–1591. doi:
10.1016/j.envsoft.2010.06.001
35.
Nizam H. et al. Real-Time Deep Anomaly Detection Framework for
Multivariate Time-Series Data in Industrial IoT // IEEE Sensors J. 2022. Vol.
22, № 23. P. 22836–22849. doi: 10.1109/JSEN.2022.3211874
36.
Sahin Y., Bulkan S., Duman E. A cost-sensitive decision tree
approach for fraud detection // Expert Systems with Applications. 2013. Vol.
40, № 15. P. 5916–5923. doi: 10.1016/j.eswa.2013.05.021
37.
Salekshahrezaee Z., Leevy J.L., Khoshgoftaar T.M. The effect of
feature extraction and data sampling on credit card fraud detection // J Big
Data. 2023. Vol. 10, № 1. P. 6. doi: 10.1186/s40537-023-00684-w
38.
Buczak A.L., Guven E. A Survey of Data Mining and Machine Learning
Methods for Cyber Security Intrusion Detection // IEEE Commun. Surv. Tutorials.
2016. Vol. 18, № 2. P. 1153–1176. doi: 10.1109/COMST.2015.2494502
39.
Vilone G., Longo L. Explainable Artificial Intelligence: a
Systematic Review. 2020. doi: 10.48550/ARXIV.2006.00093
40.
Xiaorong Z., Dianchun W., Changguo Y. A New Feature Extraction
Method of Intrusion Detection // Proceedings of the 2009 First International
Workshop on Education Technology and Computer Science - Volume 02. USA: IEEE
Computer Society, 2009. P. 504–507. doi: 10.1109/ETCS.2009.373
41.
Siddiqi M.A., Pak W. An Agile Approach to
Identify Single and Hybrid Normalization for Enhancing Machine Learning-Based
Network Intrusion Detection // IEEE Access. 2021. Vol. 9. P. 137494–137513.
doi: 10.1109/access.2021.3118361
