For
a detailed analysis of the general pattern of water circulation in various
regions of the World Ocean, it is necessary to visualize the current velocity
vector. This procedure is necessary both when interpreting the velocity field
of geostrophic currents calculated from the data of altimetry measurements from
spacecraft [4] and when interpreting the results of calculations carried out
within the framework of hydrodynamic models [5, 6]. Visualization is also
useful in the analysis of atmospheric processes. And with such interpretations,
it would be much easier and faster to use domestic development instead of
powerful, and moreover, foreign packages. The universal system we are
developing should eventually become exactly so.
Earlier in article [2], which
became a kind of first part of the topic considered here, a program was
developed in the PHP programming language [7] for visualizing georeferenced
parameters on the Yandex satellite map [8]. As input data in the program, a
text file with the CSV extension was used, consisting of three columns:
- latitude/longitude in the
first two columns;
- the actual value of the
parameter (in that example it was a truncated geostrophic, that is, only one of
the two velocity components).
In this case, until the universality
of the input text data is implemented, the extension in the name of the text
file matters only so that a function designed specifically for this extension
is used to open this file in the PHP program.
It should be noted that the
current velocity differs from other geophysical characteristics, such as
temperature, salinity, etc., since it is a vector. Therefore, in order to unify
the visualization process, it was necessary to develop a modification of the
previously made program, which will be discussed in this paper.
Unlike the method of representation
of geophysical parameters in a text file as three columns (longitude, latitude
and the parameter itself), in the case of a velocity parameter, the input text
file contains four columns - longitude and latitude values, as well as two columns
with the latitudinal and meridional components of the vector speed. The
presence of four columns will serve in the future with the development of the
universality of the system as a sign that the input file contains a vector
parameter, and not any other geophysical parameter.
The task of constructing an image of a vector parameter has
been significantly simplified due to the fact that a program for constructing
images of scalar geophysical parameters was previously implemented [3].
Based on the
already made program, we will build an image of the velocity vector.
We will not repeat the reasons for using the PHP language,
they are described in detail in our previous article [2].
We only add
that the previously implemented program in the PHP programming
language works both as part of a Web
page [3] with a Yandex satellite map [8], and completely independently you can
see the result of its work on the monitor screen, but without being tied to a
satellite map using
reason for not having this card.
So, since the main part of the program has already been
done earlier, it remains for us to calculate the actual velocity parameter
based on its zonal and meridional components from the data of the input file,
and also put arrows on the resulting image of the velocity parameter indicating
the direction of the velocity vector.
The
modification of this program in the PHP programming language is devoted to
these tasks.
The problem of visualization of the velocity vector will be
solved in several stages.
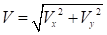
At the first stage, we determine
the modulus of the velocity vector, and since its two components are known, it
can be calculated as:
|
 ,
,
|
(1)
|
where
 –
zonal (projection onto the
horizontal axis x) component of the velocity vector,
–
zonal (projection onto the
horizontal axis x) component of the velocity vector,
 –
meridional
(projected
onto
the
vertical
y
-
axis)
component
of
the
velocity
vector.
–
meridional
(projected
onto
the
vertical
y
-
axis)
component
of
the
velocity
vector.
Based on the initial data array in text form containing
four columns, the program forms an additional array containing three columns.
The first two
columns (latitude and longitude) remain unchanged, the third column contains
the modulus of the velocity vector.
As a result of the PHP script, we get an image of the speed
module
 , as well as any other
geo-referenced (having longitude and latitude) scalar parameter [2].
The image of
the speed module is shown in Fig. 1 using the palette shown on the right side
of the figure.
, as well as any other
geo-referenced (having longitude and latitude) scalar parameter [2].
The image of
the speed module is shown in Fig. 1 using the palette shown on the right side
of the figure.
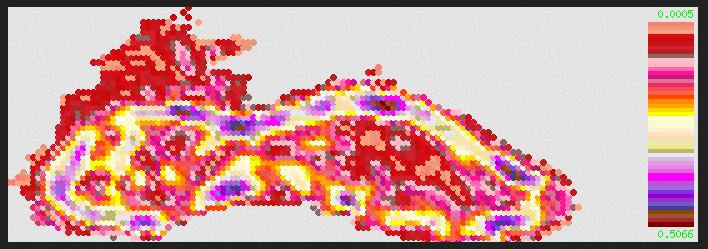
Fig.1
Image of the
speed parameter without indication of directions
For
illustration, the data from February 29, 2012 are taken from the current field
in the Black Sea [9].
The spatial resolution is 0.125⁰
in latitude and longitude.
The velocity vector of current will be represented as an
arrow, the length of which is proportional to the vector modulus, and the
azimuth angle
 corresponds
to the direction.
corresponds
to the direction.
The angle
is determined
by the known relation
|
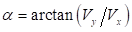 .
.
|
(2)
|
Note that in the PHP
programming language there are many mathematical functions, including two
functions atan() and atan2(), for calculating arc tangents. But the atan2()
function is also good because it gives the result taking into account the
quarter of the trigonometric circle to which the velocity vector belongs (+/-
signs for components). Therefore, in further calculations, when mentioning the
arctangent, we will assume that the atan2() function is used.
The
straight line segments indicating the direction and strength of the flow are
superimposed from above on the previously constructed (see Fig. 1) image of the
parameter (in this case, the velocity modulus). Depending on the spatial
resolution with which the data on the velocity vector was obtained, in order
not to overload the image, we will display only every n-th arrow. The program
provides that the number n can be changed. In our case, we will display only
every fourth arrow, otherwise, when each arrow is displayed, the image will be
too overloaded and lose visibility.
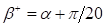
First, let's look at the intermediate result of
superimposing only the velocity vector itself (without arrows) in Fig.2.

Fig.2.
Image of the speed parameter with the
speed vector plotted on top without indicating the direction
From Fig. 2, it is obvious that the resulting image is not
informative enough - it is required to indicate the direction of the velocity
vector itself, and this will be possible only by adding “wings” of arrows to
the velocity vector, the construction of which will be dealt at the next stage.
It should be noted that the PHP programming language, even
with the built-in GD library with all the variety of functions for building
images, does not have a function for displaying arrows in its arsenal.
The closest
function is the imageline() function for constructing lines, which allows you
to represent a vector as a straight line segment, the length of which is proportional
to the vector modulus.
So the arrows will have to be
built "manually", based on the fact that any arrow is a set of three
lines converging at one point.
When constructing arrows, we will assume that
- “wings” of the arrow are oriented relative to the
velocity vector at an angle
 radians (9◦);
- the distance from the origin to the ends of the
arrowheads is equal to 3/4 of the arrow length;
- velocity vector has
 ,
,
 as initial coordinate values;
- coordinates of the end of the velocity vector
 and
and
 correspond to
and
.
correspond to
and
.
The coordinates of the end of the velocity vector
and
must
coincide with the end of the "wings" of the arrowhead, otherwise the
future display of the direction will simply "disperse".
Our task is
to find the coordinates of the initial points of the "wings" of the
tip
 and
and
 on both sides of the velocity
vector (Fig. 3).
on both sides of the velocity
vector (Fig. 3).
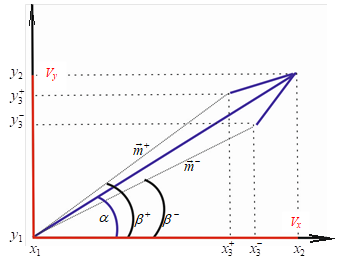
Fig.3
Graphical representation of the
arrow
Fig.
3 shows the angles
 and
and
 , which, according to the above assumptions,
can be determined as
, which, according to the above assumptions,
can be determined as
 on one side
of the velocity vector, and
on one side
of the velocity vector, and
 on the other
side, respectively.
Then two pairs of required
parameters (
and
on the other
side, respectively.
Then two pairs of required
parameters (
and
 ) can be
defined as
) can be
defined as
where
 and
and
 –
vectors
connecting the origin of coordinates with the ends of the wing of the arrow.
According to
previously accepted conditions
–
vectors
connecting the origin of coordinates with the ends of the wing of the arrow.
According to
previously accepted conditions
 .
.
After the end
of the arrow construction procedure, its initial coordinates are assigned
geographic coordinates taken from the source text file.
Thus, now we
have all the necessary data for drawing arrows, which we use in the image being
built.
The
result of such a construction of an image with printed arrows is shown in Fig.
4.
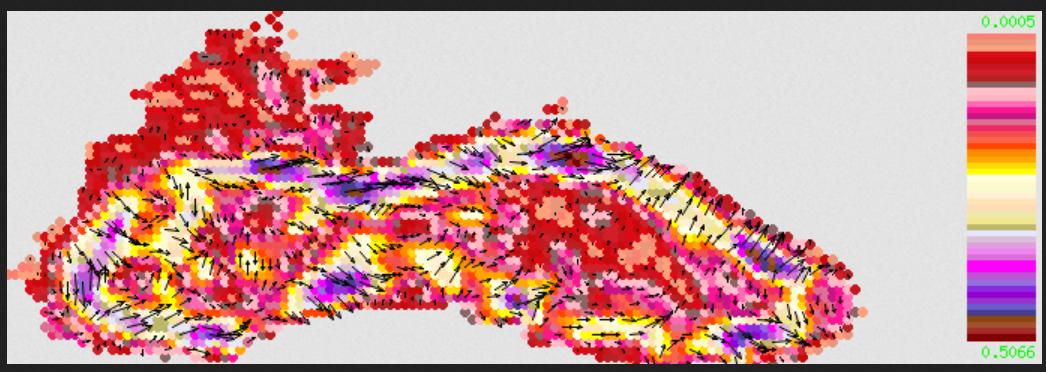
Fig.4.
Image of
the speed parameter with arrows applied
In
conclusion, it remains to lay out the finished image on the Yandex satellite
map [10].
To
do this, we will transfer the image built using the PHP script with the
necessary parameters (coordinates of points with the parameter, the center of
the future map, etc.) to the JS script [11], since this script is responsible
for building the Yandex API satellite map [12].
As a result,
we obtain the image shown in Fig.5.
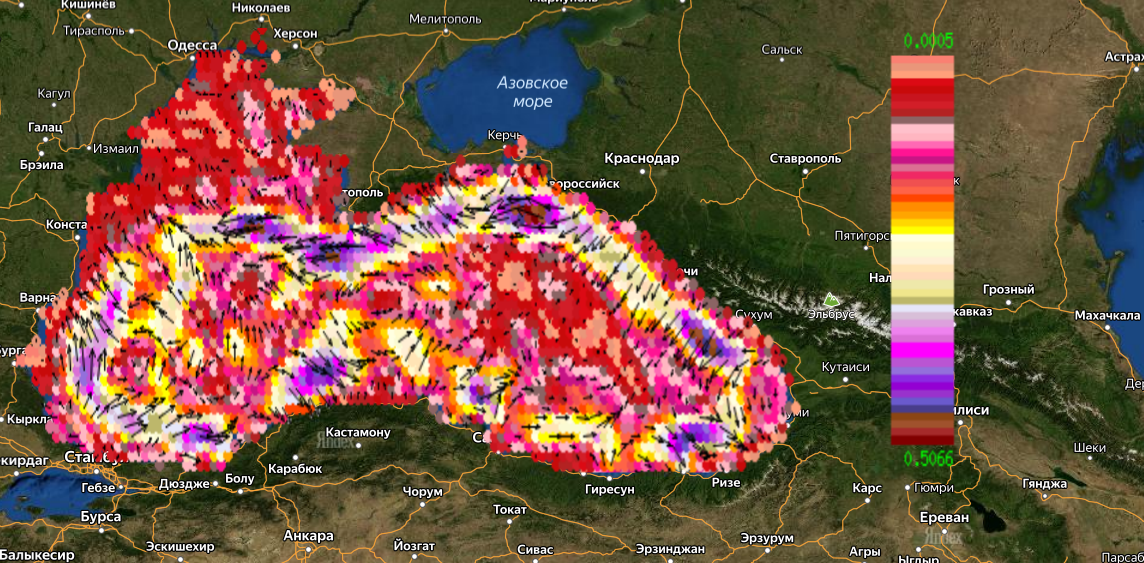
Fig.5.
The
image
of
the
speed
parameter
with
arrows
on
the
Yandex
satellite
map
We
add that the decision to draw arrows over the already constructed image of the
velocity module will allow in the future to separately work out the image
quality before laying it out on a satellite map.
Now
that everything is ready, as an experiment, let's try to replace the palette file,
using a palette with a small number of colors for this.
Then
the
same
image
will
look
like
shown
in
Fig.6.
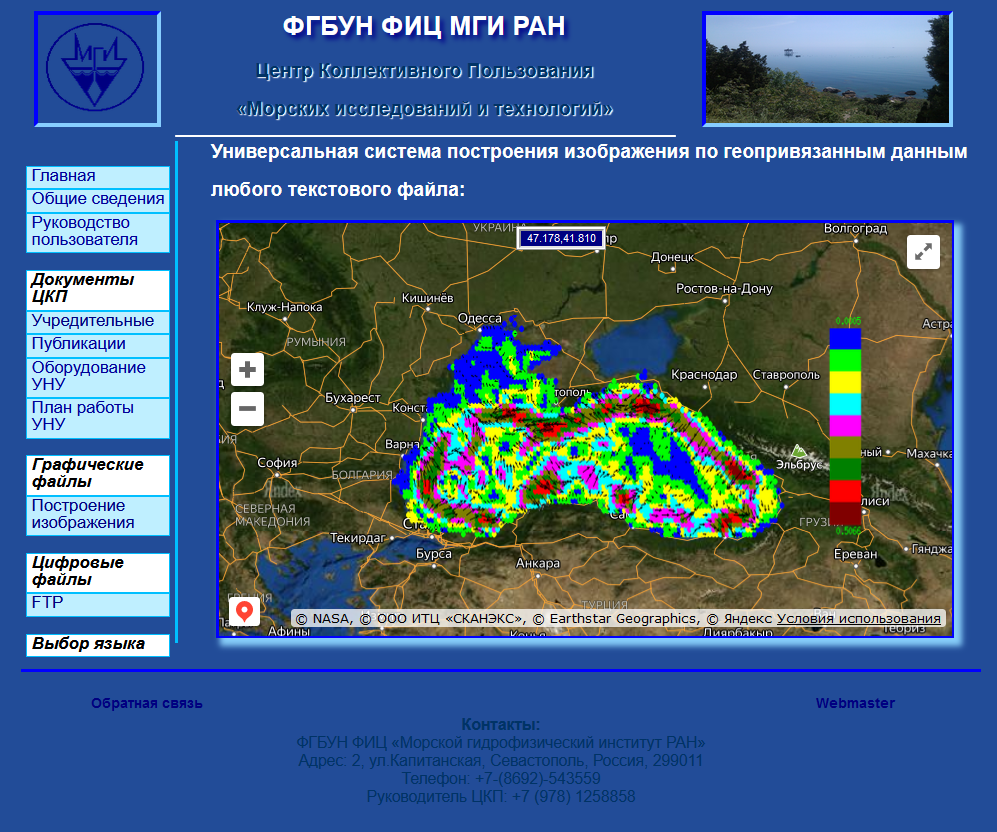
Fig.6.
Image on
the Yandex satellite map with a different palette
In
the future, the user himself will decide and accordingly choose which palette
he is more comfortable using, but this will be a future subject of research.
Note that this working script will serve as the basis for
our further developments in the direction of universality.
And this
further work is already underway [13].
The
versatility lies in the fact that the script allows the user to select any text
file with geophysical parameters, a file with a palette, set some constants
used in the program, as well as change the values of the assumptions adopted in
this work (the number of displayed arrows, arrow sizes, etc.), which is
important in any research work.
This
universality
will
be
developed
on
the
site
[13]
with
a
Yandex
satellite
map,
which
will
form
the
basis
of
the
topic
for
another
article.
In addition to the above
universality, questions about the use of various combinations are already
emerging, that is, it is interesting for researchers to observe the behavior of
any parameter (temperature, for example) under the influence of flow velocity,
which, of course, is possible with such an approach, but more on that in
another article.
When referring to examples of
the global level, for example, to the COPERNICUS site [14], which presents a
huge number of images of geophysical parameters, we can conclude that the
finished PHP software product can also be used in systems-analogs of
Copernicus. Also, this PHP software product, due to its autonomy, can serve as
the basis for work in any region of the map on the cartographic surface.
The
work was carried out within the framework of the state task on the topic
FNNN-2021-0004 "Fundamental research of oceanological processes that
determine the state and evolution of the marine environment under the influence
of natural and anthropogenic factors, based on the methods of observation and
modeling" (code "Oceanological processes").
1. Voronina N. N., Inyushina N. V., Mamchur N. L., Kryl' M. V.
Analiz i sopostavlenie programmnyh sredstv vizualizacii morskih prognozov na
osnove raschetnyh dannyh operativnoj okeanografii po chernomorskomu bassejnu
na primerah sevastopol'skogo i krymskogo regionov. // Nauchnaya vizualizaciya.
Elektronnyj zhurnal, ISSN 2079-3537, № 1, T. 8, 2016. – s. 146 - 155.
[Electronic resource]. URL:
http://sv-journal.org/2016-1/09.php?lang=ru
2. Voronina N. N. Universal System for
Visualizing Geo-Referenced Data From a Text File on a Yandex Map// Nauchnaya
vizualizaciya. Elektronnyj zhurnal, ISSN 2079-3537, № 1, V. 15, 2023. – s.83
- 89.
[Electronic resource]. URL:
http://sv-journal.org/2023-1/07/
3. [Electronic resource]. URL:
http://ckp.mhi-ras.ru/generate_image_do-sh.php
4. Pustovojtenko V.V., Zapevalov A.S. Operativnaya
okeanografiya: Sputnikovaya al'timetriya – Sovremennoe sostoyanie,
perspektivy i problemy // Seriya. Sovremennye problemy okeanologii,
Sevastopol': NPC “EKOSI-Gidrofizika”. 2012. Vyp. № 11. 218 s.
5.
A. Bogdanov, A.
I. Mizyuk, A. A. Kubryakov Evolution of Submesoscale Cyclones on the
Batumi Anticyclone Periphery Based on the Numerical Simulation Data //
Physical Oceanography vol. 29, No. 6 pp. 550-566
6. Demyshev S.G., Zapevalov A.S., Kubryakov A.I.,
CHudinovskih T.V. Evolyucii polya koncentracii 137CS v CHernom more posle
prohozhdeniya chernobyl'skogo oblaka // Meteorologiya i gidrologiya, 2001,
№10, S.49-61.
7. Zandstra M. PHP 8. Obekty, shablony i metodiki
programmirovaniya // Dialektika, 2021. [Electronic resource]. URL:
https://php.ru/manual/
8. Koptenok Ye. V., Savenko A. V., Fomin I. I., Trunnikov M.
V., Sukharev Ye. A. Analiz vozmozhnostey servisov dlya realizatsii
virtualnykh turov na primere ispolzovaniya API Yandeks. Kart. // Molodoy
uchenyy. № 19 (309), 2020. - S.130-133. URL:
https://moluch.ru/archive/309/69891/
9. [Electronic resource]. URL:
http://dvs.net.ru/mp/data/201202vw_ru.shtml
10. Mokhov V.A., Kubil V.N., Kuznetsova A.V., Georgitsa I.V. Rekursivnyy
algoritm sinkhronizatsii Api-zaprosov k gis-servisu Yandeks.Karty //Fundamentalnye
issledovaniya. № 9-1, 2015. – S. 33-38. URL:
https://fundamental-research.ru/ru/article/view?id=38961
11.Marijn Haverbeke Vyrazitel'nyj JavaScript // 2020, 480 s.
ISBN 978-5-4461-1226-5.
12. Foerderer J., Bender M., Heinzl A.
Regulation of digital platform ecosystems: evidence
from russia's google vs yandex ruling.
// V sbornike: International
Conference on Information Systems 2018, ICIS 2018. 39. 2018.
13. [Electronic resource]. URL:
http://ckp.mhi-ras.ru
14. Servis Programmy «Kopernikus» // [Electronic
resource]. URL:
https://data.marine.copernicus.eu