BPMN notation has become a universal standard for graphical
representation of multidirectional processes occurring in commercial and
scientific organizations of various sectors. For example, using this approach,
it is possible to describe both the air ticket booking system and the process
of obtaining a degree. However, BPMN provides a static representation of the
process, which may impair the understanding of the scheme by the user, does not
give an idea of time and resource costs. This paper discusses an original
approach for visualizing business processes using BPMN notation. A program was developed
which allows to build a simulation model based on a BPMN scheme. The metrics
for evaluating the results of modeling have been developed, which include
calculating the average time spent by applications in the system; the average
time of resource’s occupation.
Let's consider examples of existing notations used to describe
business processes. IDEF0 is a modeling methodology used for plotting diagrams,
maintaining documentation [1]. The result
of using IDEF0 is a model consisting of a hierarchical series of diagrams with
accompanying explanatory text, illustrating graphic images. The two main
components of diagram modeling are functions (represented by named blocks) and
data objects that interconnect these functions.
As a function modeling language, IDEF0 has the following
advantages:
•
consistent
and simple language that allows you to briefly describe the business process;
•
used
by the U.S. Air Force and other government agencies, as well as private
industry.
Disadvantages of IDEF0:
•
it
is impossible to see the algorithm for executing business processes;
•
requires
some training to develop and read notation;
•
the
absence of a formal theoretical model, as well as the lack of tools to describe
artifacts and information flows;
•
does
not reflect the reaction of the participants in the process to the events of
the external environment. In most cases, due to changes in processes from the
outside, either a delay or cancellation of the process at some stage follows,
but not a rollback, as it happens in the IDEF0 notation. That is why the IDEF0
notation seems more acceptable for describing technological processes, rather
than business processes;
•
when
adding parallelism in execution to IDEF0, all parallel functions will be
executed simultaneously.
IDEF0 is used for top-level modeling of business processes.
Another alternative notation is EPC [2]. Notation is used at the lower levels of
the business model description when the task is to describe the detailed
progress of the business process.
Advantages – it has the ability to describe the execution of a
business process in great detail and accurately, to graphically show all the
performers, all the objects used. The advantage of EPC diagrams is the fact
that, as in the IDEF0 diagrams, they can specify the input and output data of
each function, trace the logic of the movement of input and output data from
block to block. In addition, unlike IDEF0, it is possible to parallelize the
process by directing it only along one of the alternative branches.
Disadvantages – it has a very wide set of graphic elements, which
can be difficult to understand, compared to other notations. In order to
develop processes in this notation and read them, preliminary training of
employees is required. EPC diagrams do not describe the execution schedule,
they omit the issues of synchronizing branches of one process with each other
and with other, external processes.
Various models can be used to describe business processes. One of
them is UML diagrams [3]. This
tool can be used to describe a business process, but it is of little use for
further work, since there are a huge number of different UML formats, and there
is no single specification. Thus, when creating an application based on UML, it
will be necessary to take into account the possibility of obtaining different
UML formats, which can be avoided by working with other business process
description formats.
Data Flow diagrams (DFDS)[4] were
developed back in the seventies, and their purpose is to represent data flows,
not actions. Although business process analysts approve of data flow diagrams,
they generally agree that this method is outdated and has one big limitation:
it focuses on information rather than actions. Data flow diagrams are by
definition data-centric and do not provide a clear way to include all
stakeholders in the process.
Functional Flowcharts (FBD) [5] may have
existed for several decades, but they are still used in mapping business
processes. Their attention is focused on the order of tasks or functions in a
sequence of ordered blocks. Each functional block can be divided into a
separate diagram showing the subtasks in each functional block. Of course, this
leads to a large number of diagrams representing a single process, but they are
easy to match with a first-level diagram. Some businesses prefer FFD because,
despite the need for multiple diagrams, they are relatively easy to follow,
even if the process is quite complex.
BPMN (Business Process Modeling Notation) models are a tool
for understanding complex multi-level business processes. With the complication
of a certain process, there is a need to expand the documentation, knowledge
base, instructions that describe the relationship of this process with other
existing components. The solution to the problem of increasing complexity for
the decision-maker (LPR) to understand can be the construction of a BPMN model
describing current processes. The study of graphical visualization of processes
allows the LPR to detect inaccuracies, process cycling, potentially problematic
areas, and also collect data on the resources involved for subsequent analysis
and optimization.
The first version of the BPMN model specification was
introduced in 2006, then a number of updates were released, the last of which
was published in January 2011. [6] BPEL
(Business Process Execution Language) is a standard for the design and
execution of business processes, similar in structure to BPMN models. The BPMN
specification was introduced in order to bridge the gap between business
analysis and technical analysis by providing a standardized graphical notation
for the processes described in BPEL [7]. The BPMN and
BPEL paradigms use different elements to describe similar business processes,
which leads to further inconsistencies. BPMN and BPEL are used at various
stages of the BPM lifecycle. In [7], the authors
draw attention to the differences between these two approaches and present a
number of arguments that show the advantage of BPMN notation in business
process modeling. Difficulties in transferring models from BPMN to BPEL and in
reverse order were discovered and overcome in the article [8] by creating a
BPMN2BPEL system for automatic conversion. Thus, if necessary, schemes in more
advanced BPMN specification can be simplified to other BPM formats.
The BPMN specification can be implemented at enterprises of
various industries, scale, solving problems in different fields from each
other. Thus, in the work [9], the
structure of a situation center was created to manage emergency situations in
the oil industry. The paper [10] describes the
development of an end-to-end process for the implementation of state/municipal
services in electronic form using BPMN notation. Schemes for the implementation
of the traditional business model of a loan on a crowdinvesting platform, purchase
and sale of securities, tokenization of rights and their modification have also
been published. [11] Thus, it is
concluded that the design method using BPMN is universal and widespread, and
the approach can be applied both to the description of business processes and
as a basis for software designed for modeling.
Based
on the results of the comparative analysis, a table was compiled in which the
presence of the property was marked with a "+" sign. Based on the
results of the comparison, BPMN notation was chosen as the most universal and
widespread.
Table 1. Comparative analysis of notations.
|
|
BPMN
|
EPC
|
IDEF0
|
UML
|
DFD
|
FBD
|
|
Convenience of understanding the compiled
scheme
|
+
|
+
|
-
|
+
|
+
|
+
|
|
Quick learning of notation elements
|
-
|
-
|
-
|
-
|
+
|
+
|
|
Versatility
|
+
|
+
|
-
|
+
|
-
|
+
|
|
The ability to describe complex processes
|
+
|
-
|
+
|
+
|
-
|
-
|
|
Support
of
other software
|
+
|
-
|
-
|
+
|
-
|
-
|
Existing
software solutions are focused either on a static representation of the subject
area, without the possibility of conducting computational experiments and
optimizing solutions based on them, or on the use of non-standardized
representations, which, despite their effectiveness, are not always
understandable to users far from programming and mathematics [12].
At the
moment, there are already platforms for analyzing business processes based on
BPMN models. Each of the sites can offer different functionality for users.
Camunda is an
open source workflow automation and decision–making platform [13]. The Camunda platform comes with tools
for creating workflow models and solutions, operating deployed models in
production, and enabling users to perform workflow tasks assigned to them. It
is developed in Java and released as open source software under the terms of
the Apache license [14].
This platform provides services for the implementation of this
platform to the enterprise and further support. It is also possible to
implement it for free using open source code, but in this case Camunda does not
provide any assistance for the implementation and maintenance of the product.
Also on this platform there are tools for analyzing the
effectiveness of the business process, such as, for example, a heat map showing
the workload of certain nodes (Figure 1), but this platform does not provide
any visualization capabilities.
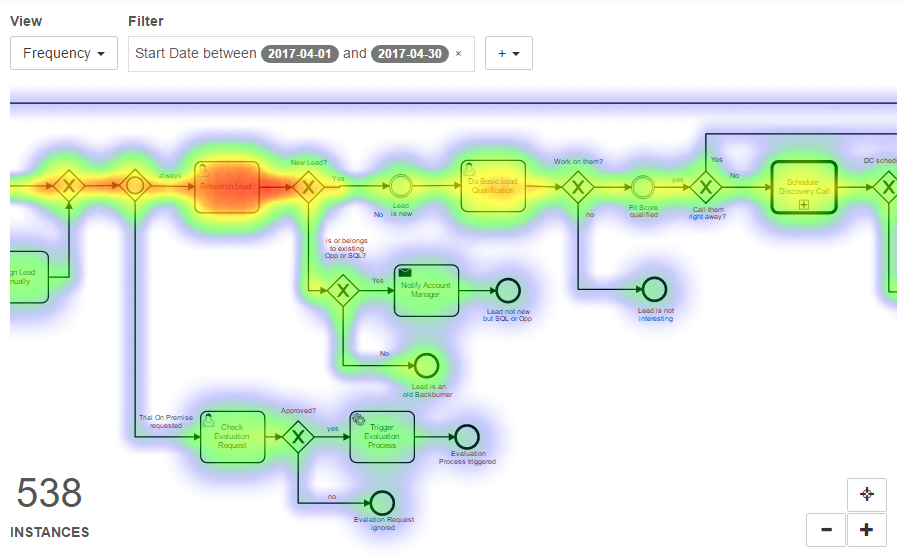
Figure
1. Heat map of node utilization in the Camunda product
Advantages:
•
A wide variety of tools offered
•
Availability of open source code
•
Product implementation assistance
Disadvantages:
•
Does not allow optimization
•
A very voluminous product that requires a lot of
resources for implementation
•
Is not a domestic software.
•
There is no possibility to animate the BPMN
scheme
ELMA365 is a
Low–code BPM system that builds the interaction of employees from different
departments into a network of interconnected business processes [15]. So, the platform allows you to get
high-quality and easy quick results without unnecessary bureaucracy. The
company's strategic goals are achieved through modeling, execution, control and
continuous improvement of business processes.
This platform
provides services for the implementation of this platform to the enterprise and
further support. The platform can also provide a free trial period, however,
unlike the previous service, it does not provide free open source code for
self-implementation of the product.
This platform
has various tools for controlling the business process, but there are no
automatic optimization tools as such. The proposed process improvement is
built manually, based on a specific business, which is an advantage in terms of
the accuracy of possible improvements, but a disadvantage in terms of the speed
of supply and the required resources for optimization calculations.
The product
also offers ready-made connectors for integration with various services, such
as 1C, MS SQL databases, Oracle, PgSQL. Convenient modules for integration with
REST and SOAP web services. ELMA loads data from external systems, performs
operations with internal systems automatically.
Advantages:
•
A wide variety of tools offered
•
User-friendly interface
•
Using a Low-code approach
•
The product is included in the register of
Russian software
•
Product implementation assistance
Disadvantages:
•
Does not allow optimization
•
A very voluminous product that requires a lot of
resources for implementation
•
There is no possibility to animate the BPMN
scheme
BPMN.Studio is a free online service for modeling business processes
[16]. In the online business
process designer, you can quickly simulate a process or a group of processes
using the popular business process modeling notation - BPMN 2.0.
This product allows you to create diagrams of BPMN models. In
addition, it allows you to import them in various formats, for MS Office or PDF
documents, as well as for printing. Also, this web service does not provide any
features.
So, there is no animated visualization in this service, and there
are also no opportunities to expand this product in the form of adding new
functionality by third-party users.
Advantages:
•
Convenient tool for creating BPMN schemes
•
Web application
Disadvantages:
•
Does not allow optimization
•
Lack of opportunities to expand the
functionality
•
There is no possibility to animate the BPMN
scheme
PETERSOFT: BPM is a complete set of tools for automating
enterprise management on the 1C: Enterprise 8 platform [17]. Depending on the
tasks set, process management technologies, adaptive case management or project
management can be used.
This platform allows you to create business process models - a
fixed chain of tasks, the sequential execution of which leads to the
achievement of the desired result. Models are configured in the visual editor
using the business process configuration mechanism. For any point in the
process, you can specify the performer and the time for which he must complete
this task. Once configured, the business process model can be run unlimited
number of times.
This platform has various tools for monitoring business
processes and their implementation, but there are no optimization tools. There
are only analysis tools, but improvements are not offered either in manual or
automatic versions.
Advantages:
•
A
wide variety of tools offered
•
User-friendly
interface
•
The
product is included in the register of Russian software
•
Product
implementation assistance
Disadvantages:
•
There
are no tools to optimize processes
•
A
voluminous product that requires a lot of resources for implementation
•
There
is no possibility to animate the BPMN scheme
Optimization of business processes requires either the
creation of your own proprietary solution, or the introduction of a complex
system that requires a large amount of resources.
The Bizagi platform is similar in functionality to the
development being created, but cannot be studied in detail, since it is not
available in Russia. Judging by the description, this system is focused on the
automation of current business processes, and not on the analysis of criteria
for evaluating the results of computational experiments, in order to further
optimize.
The general model of these products is similar to each other,
but each has its advantages and disadvantages. Each of the platforms allows you
to work with business processes, but these platforms provide comprehensive
solutions for deep manual analysis of business processes in the company. This
implies a long and extensive work on auditing and providing possible solutions,
which requires a lot of resources.
A large number of software uses color as a way to
improve the quality of visualization. Indeed, color accents can simplify the
understanding of some types of visualization, such as graphs. However, there is
no color specification in BPMN notation, the blocks have black borders, white
background. The difference in colors can distract users when modeling a highly
composite process, as it happens in EPC notation. However, for customization
purposes, the developed software has the ability to customize the image for
animation. For example, an image of a part can be used to model a plant, and an
image of a document can be used to simulate the processing of an application in
a call center. Thus, the LPR is easier to navigate in the scheme, the resource
involved is clear, the visualization becomes more visual than when using
classical notation elements.
When solving the problem of optimizing a business process, it
is not enough to rely only on the BPMN model, testing hypotheses in practice is
necessary. Such a test in a real business environment can be time-consuming,
moreover, during testing, the possibility of experimenting with various
settings in the BPMN nodes of the model is limited. In this case, it is
necessary to apply modeling – to build a virtual model and conduct research on
it.
The advantages of modeling are the speed of process
simulation; the ability to change parameters in such a way that allows you to
test and investigate various hypotheses, and these changes will not affect the
real process. Based on a variety of computational experiments, it is necessary
to choose the best combination of parameter values based on the criteria for
evaluating the simulation results, after which the model can be applied to
modify business processes.
To solve the described problem, software was developed that
allows implementing a simulation model based on the BPMN model, visualizing the
flow of elements in this model with the ability to change the parameters of the
model for its optimization.
When analyzing a specific business process, it is necessary to
initially make a description of it using BPMN notation. For correct modeling by
the developed program, the compiled model must meet certain rules that are not
included in the notation. So, some blocks must have a description of certain
parameters, for example, the name of the function and its parameters for
implementing the input stream generator.
The compiled model is transferred to the developed program, in
which its further configuration can be implemented. It is indicated in what
form the simulation should take place – using the web interface or in console
mode. The web interface is clear, easy to understand, it has the ability to
configure simulation parameters. Console mode is necessary to speed up the
simulation, which reduces the operating time for multiple launches of the model
in case of selecting its optimal parameters in any way.
After the end of simulation process, the resulting parameters
can be obtained from the model. Statistics are uploaded on the occupancy of
specific nodes, as well as on the number of generated and released entities in
each individual block.
For the entity generator node, statistics on the total number
of generated entities are displayed. For the final node releasing entities from
the model, the number of released entities, the total time spent by all
entities inside and the average time of one entity are output. Such statistics
are displayed separately for each such block, which allows you to compare
different "paths" of entities. For example, when modeling the
application acceptance process in some department, the application may be
rejected at the very beginning, or it may be accepted and processed. Similar
values for the number of rejected and processed applications may indicate
imperfection of the selection process, problems in the system or in the
business process as a whole.
The algorithm described in the previous paragraph is
implemented in a software package designed to visualize business processes
based on the BPMN model. The program was executed in the Python3 and JavaScript
programming languages using HTML in the PyCharm development environment. The
PixiJS library (a package for visualizing dynamic interfaces in web pages) was
used as auxiliary libraries. The choice of the Python3 programming language is
due to its flexibility when working with both the mathematical apparatus and
the web interface. JavaScript and HTML markup language were used to animate the
processes described in the BPMN scheme.
Functionally,
the complex is divided into four parts (Fig. 2):
1.
Blocks
responsible for the functionality of a particular node of the business model.
For example, a block generator or a block responsible for emulating
"work". Such blocks have a common interface and the program can be
easily supplemented with new blocks with other functionality.
2.
The
kernel module, which is responsible for creating a specific model from blocks, implementing
the collaboration of these blocks, as well as for the type of visualization of
the model.
3.
An
XML file parsing module that receives data from a model description file and
translates it into a format convenient for the kernel.
4.
A
web application module that is used when visualizing a business process using a
web page, and not using a console.
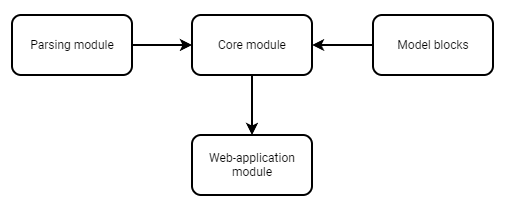
Figure 2. Block diagram of the software package
Figure 3 shows the scheme of operation of the software
package. The first step is to send the file to the parsers, which filter out
the redundant information contained in the BPMN notation, convert the
components into specific blocks. After conversion, these blocks fall into two
separate independent cores – logical and visual.
The logical core is responsible for modeling all processes
occurring in the simulation. The following logical core blocks are implemented:
•
Start
– the block responsible for generating entities. The start_functions module is
connected to it, which contains various functions of ways to generate entities.
For example, constant is the generation of a constant number of entities every
unit of time, or random is the generation of a random number of entities in a
given interval every unit of time.
•
Delay
– the block responsible for simulating the operation of entities within the
block. It stops the progress of a specific entity for a certain time in order
to simulate any action performed on the entity at a specific point in the
process. It also has a separate module of delay_functions functions, which
prescribes various ways to set the working time in the block. To add a new
function in this or the previous block, it is enough to add the function itself
to the corresponding module and adjust the BPMN file.
•
End
– the block responsible for releasing entities that have reached the end point
in this process. Collects various statistics on the average time of entities
inside.
•
Selection
– the block responsible for the logical fork in the path of the entity.
•
Parallel_open
and parallel_close are blocks responsible for dividing one entity into several
parts and then combining these entities into one.
The visual core is responsible for outputting information to
the user. It can be a console or web application. It has separate visual
blocks, each of which is attached to the corresponding logical block. All
visual blocks have a common interface, so the logical block does not change its
behavior when changing the type of visual core.
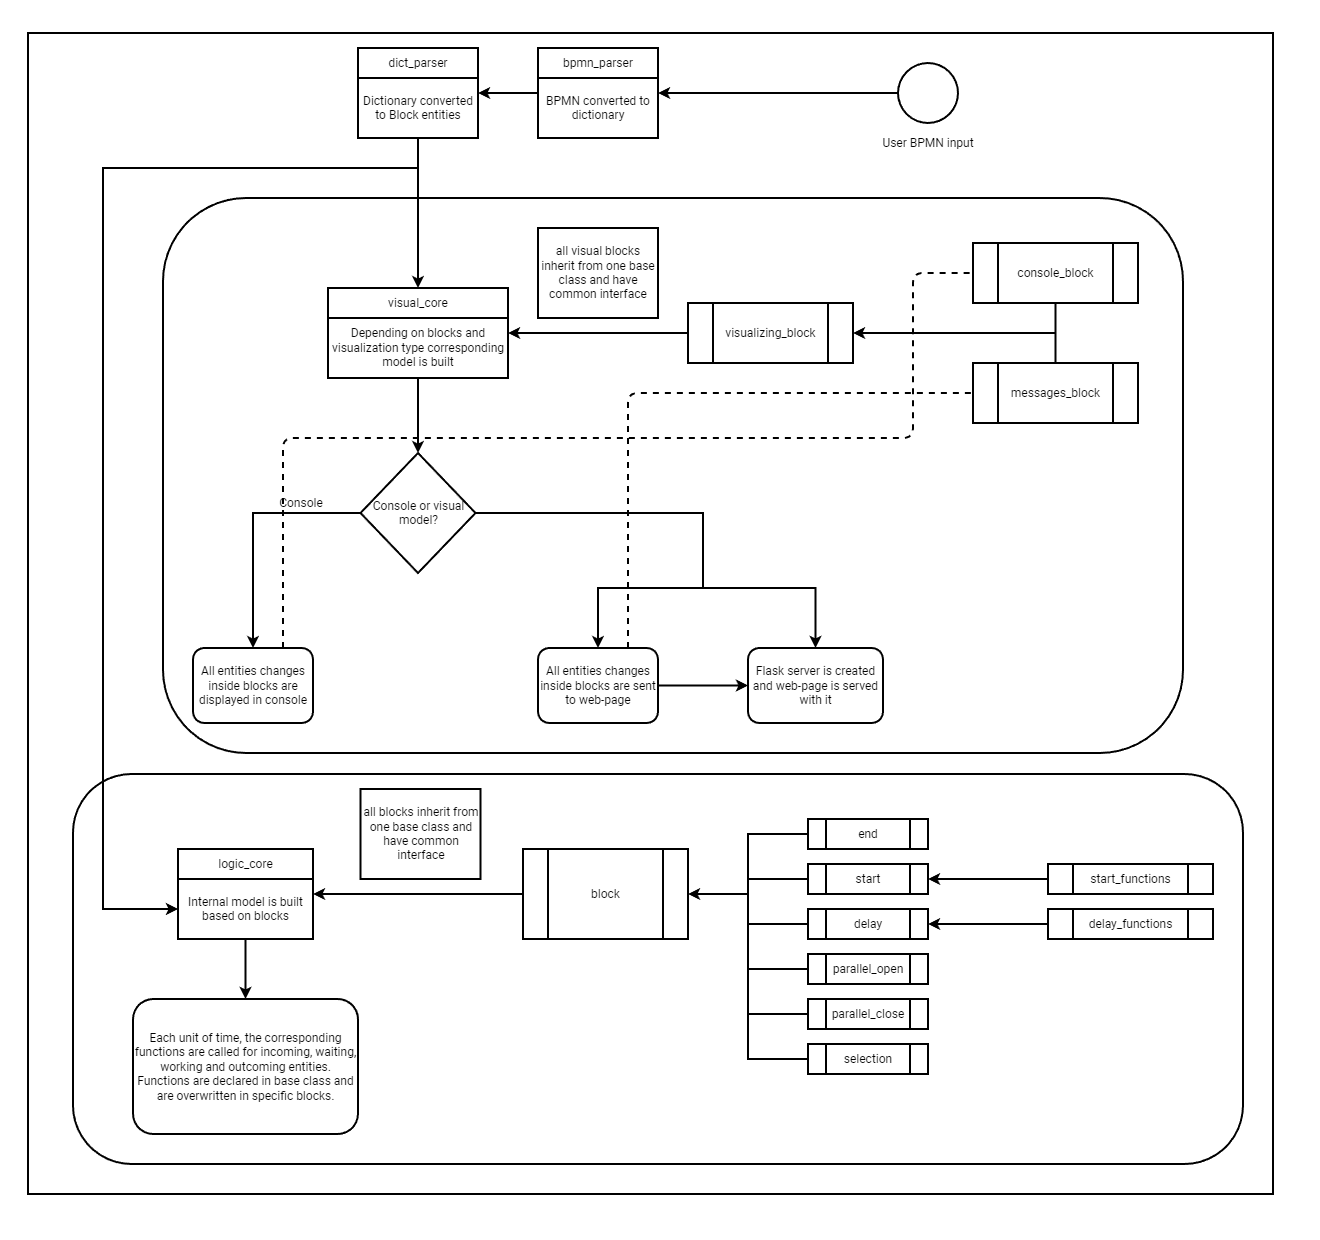
Figure 3. Scheme of operation of the software package
The
provided software package has already implemented some functions for modeling
pseudo-random delays and input flows in the delay and start blocks,
respectively.
Both
blocks have a random function, which, when created, takes two values - minimum
and maximum, and returns a random number in the specified interval each time it
is called. For a delay block, this number means how long a particular entity,
whose actions led to the function call, will be delayed in a particular block.
In the start block, this function is called every unit of time, and the
resulting value indicates how many entities will be generated in the block at a
particular point in time.
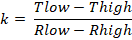
Also,
for the Delay block, a function was written that allows you to introduce the
concept of "performance" and allocated resources into the model - a
linear function of the dependence of time on resources. This function is
defined by five values - the minimum and maximum values of resources that can
be in the block (Rlow
and
Rhigh), the values of time that the
entity will spend inside the block with the minimum and maximum resource values
(Tlow
and
Thigh) and the amount of
Rcurr
resources that
are allocated in the current block in the current model.
The
current number of resources is a value that can be changed, thus changing the
“performance” of the block and affecting the “performance” of the model as a
whole, which is necessary when conducting research and optimization. To
calculate the delay time in such a function, first, the coefficient k of the
straight line that passes through the points of minimum and maximum performance
(formula 1) is calculated, and then, based on this coefficient and the
straight-line formula for two points, the time is calculated (formula 2)
|
|
(1)
|
|

|
(2)
|
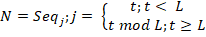
There
is also a separate function for the Start block, which returns the number of
entities that need to be generated in the block at a particular point in time
based on the initially given
Seq
sequence, which has length
L. To
determine the number of generated entities
N
at time t, the formula 3 is
used
|
|
(3)
|
Using
this function, you can simulate the uneven flow of entities at different times.
For example, to denote a different number of requests on different days of the
week, you can take one unit of model time per day and provide the value Seq =
[10,12,13,11,12,40,35]. Thus, a higher load on the system during the weekend
will be shown. Also, using Seq = [1,0,0] you can show that entities are
generated in the model only once every three units of time.
However,
the functions provided may not be sufficient and the user may need to use their
own function. For example, add a function that uses the normal distribution.
This is easy to implement - all you need to do is add your own function to the
start_functions.py or delay_functions.py file for the Start and Delay blocks,
respectively. For example, to add a normal distribution function to the Delay
block, you need to write the code in Figure 4 in the corresponding file.
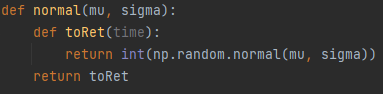
Figure 4. Function generator code for the Delay
block
This
function generates a new function based on the passed distribution parameters.
This function must accept the value of the current time of the model, even if
it does not use it. The example uses a normal distribution generator from the
third-party numpy library. Also, the generated function must return integer
values.
After
adding this function, to apply it, you only need to update any block in the
model by changing the name of the function it uses to normal and changing the
parameters to the appropriate ones.
Figure
5 shows the user interface of the developed software package.
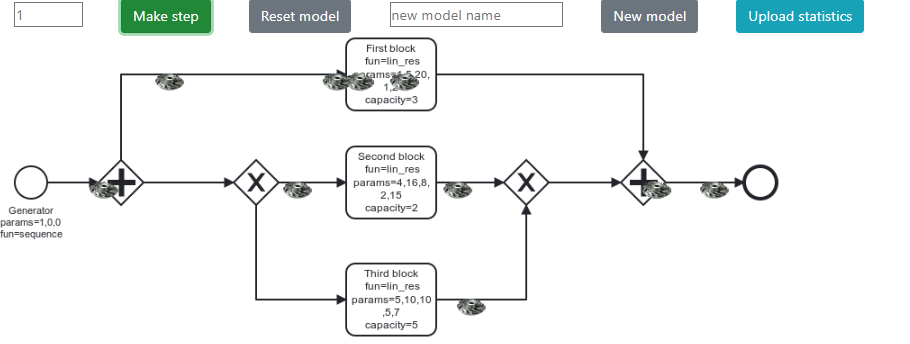
Figure 5. User interface of the software package
The
application window consists of two parts - the model setting part and the model
itself. The model is presented as a .png image, on top of which the parts
moving around the model are displayed. At the top part of user interface are
buttons used to configure, optimize, and get statistics.
•
The
"Make step" button allows you to run the model for one unit of time.
Also, this button is connected to the input field before it - you can enter a
non-negative integer into it to run the model immediately for the entered
number of steps.
•
The
"Reset model" button allows you to completely clear the model of all
entities inside and reset the internal time of the model to the initial value.
Thus, the model and all statistics collected on it will be reset to the
original value.
•
The
"New model" button allows you to replace the model with a new one, if
it exists in the path specified in the program. The path to the folder with
BPMN format models must be specified when launching the model inside the code.
•
The
"Upload statistics" button allows you to download a file with
statistics for blocks in json format. This file can be used to analyze the
performance of the model.
As
an example of visualization, a simplified scheme of a parts painting plant is
used (Fig. 6).
Figure 6. Visualization of the process of painting parts
The animation fragment shown in Figure 6 shows a simulated
plant diagram, where the main resource is a part that can be stored or sent for
painting. Visualization allows you to reduce the likelihood of errors when
modeling complex systems. From the example diagram, the user can conclude that
there is no handling of the case where the part was sent to the paint shop by
mistake. Thus, to optimize production, you can add an XOR to the block with the
question “Which shop is it sent to?” another branch - re-sending to the
warehouse.
To study the results of the model for the purpose of
subsequent optimization, analysis of processes, the functionality of unloading
statistics is implemented. Figure 7 shows the statistics for three different
blocks after running the model shown in Figure 5 for 200 time units.
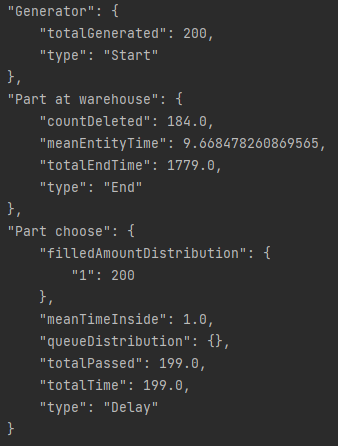
Figure 7. An example of the resulting model
statistics
The statistics show the results of three blocks - Start, Delay
and End. The model itself has only one Start and End block each, but the number
of created and released entities varies. This suggests that at the time the
statistics were taken, 16 entities were inside the model.
Entities pass through various blocks and stay there for a
certain time. However, different entities may pass through different blocks,
and as a result, the total time spent by an entity in all the blocks through
which it passed may be different for different entities. Therefore, it is
necessary to calculate the average time spent inside the Tmean model for all
entities. To do this, it is necessary to count the number of all entities that
have completely passed through the Ntotal model and the total time that these
entities spent inside the model. This time can be calculated by formula 4 based
on the time spent by each such entity inside the model (
 )
)
|

|
(4)
|
This statistic is calculated for each block separately, and is
immediately provided in the meanTimeInside field, but to calculate the global
statistics, the totalPassed and totalTime values
are also
provided separately.
Also, the selected Delay block "Part selection" is
the block following the generator, so all entities pass through it. However,
only 199 entities came out of it instead of 200 generated, which indicates the
presence of one entity inside the block. The empty queueDistribution field indicates
that there are no queues in the block, and the filledAmountDistribution field
indicates that one part was in operation for 200 units of time in the block.
The model was run for another 200 steps to analyze the
changes. The statistics results after an additional 200 steps are shown in
Figure 8
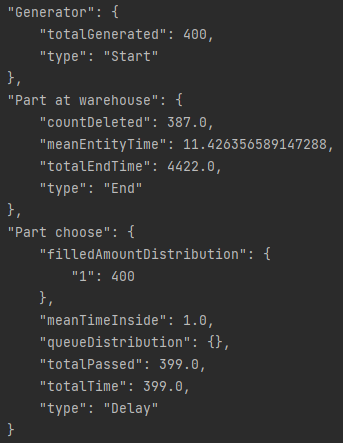
Figure 8. Changes in statistics after an
additional simulation run
It can be seen that the generator created another 200
entities. However, according to the number of entities removed by the End
block, there are still 13 entities inside the model. The average time of the
entity inside the model has increased, which may indicate that there is a
certain queue inside the model, which only increases with time, or may be an
acceptable error due to the presence of forks with a random choice in the
model. For a more accurate study of this phenomenon, the model should be run
several more times, resetting it and not resetting it, collecting more
extensive statistics for conclusions.
It is worth noting that the time moments of the events that
are indicated in the statistics can be considered as continuous random
variables due to the fact that as a result of the test (at the start of the
program), these variables take one of the random possible values
of the interval
of the numerical axis. Denote the random variable as
X. Then
X=f(ω)
is a function
defined in the space of elementary events. The most comprehensive way to define
a random variable is the distribution law. A continuous random variable is
normally distributed if its probability density can be described by formula 5.
|
|
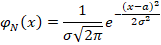
|
(5)
|
Where a,
σ
are the parameters of the normal distribution
law. The distribution function of a random variable
X, distributed
according to the normal law, is expressed in terms of the Laplace function
according to the formula 6.
|
|
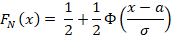
|
(6)
|
To investigate changes in the model and the impact of these
changes on the results, it is necessary to change the model during use. The
software package has such functionality. So, you can change the function
parameters and the capacity of a particular block, as shown in Figure 9. The
delay inside the block is changed from one unit of time to three, and the
capacity is reduced from ten to one unit.
Figure 9. Example of changing simulation parameters
Obviously, such a change will lead to the appearance of a
queue at the entrance to this block. This change will be reflected in the
statistics. To do this, you can run the model for 10 steps and see the
difference in this block (Figure 10).
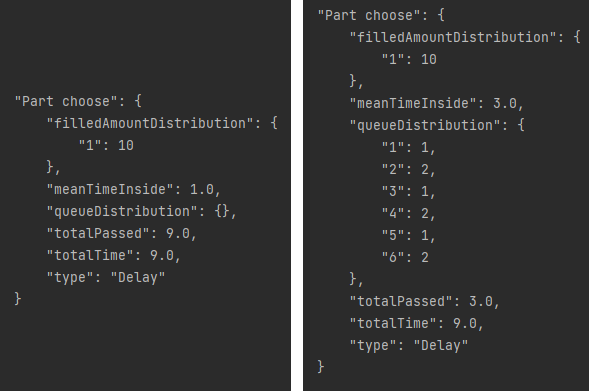
Figure 10. Statistic for a model with a
modified parameter.
It can be seen that a queue has appeared in this block, which
will probably grow, since the throughput of this block after the change is less
than the output stream of the generator. Also, with the help of statistics, you
can see how the average time of a part inside the model changes when running by
200 units of time (Figure 11).
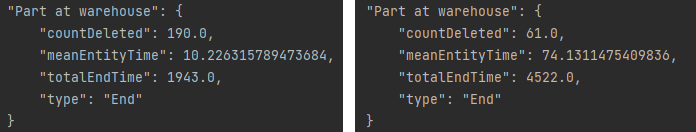
Figure 11. Statistic for a model with a
modified parameter.
You can notice that the average time has increased significantly,
and the number of entities that have completely passed through the entire model
has also significantly decreased.
This article describes the principle of operation
of the developed software package for visualizing business processes based on
the BPMN model. The program was developed to improve the existing way of
analyzing visual representations of business processes.
The functionality of this program allows you to
load various models into it, described in BPMN format, run a simulation model
in web format with animation or in console format, stop and resume the
simulation, and reset the simulation results or use another loaded model for a
new simulation.
Based
on the conclusions of the program, the decision maker can make decisions on optimizing
the modeled organizational, technical and socio-economic systems. The examples
showed the possibilities of visualization, as well as the possibility of
changing the model for analyzing processes. A technique for modeling a certain
amount of the model's operation time is described, a method for loading
statistics obtained after simulation is developed.
The
novelty of the research lies in the creation of a unique software package ready
for use in the commercial sector. The development is aimed at decision makers
who are interested in optimizing business processes, collecting statistics and
making decisions based on the information received. Visualization functionality
based on familiar BPMN notation facilitates rapid integration of the program
into an existing business diagramming system, and additional animation provides
improved understanding of processes.
The work was financially supported by Plekhanov
Russian University of Economics.
1.
Wikipedia:
[web-resource]. URL: https://ru.wikipedia.org/wiki/IDEF0 (date of application:
26.06.2022)
2.
Wikipedia:
[web-resource]. URL: https://en.wikipedia.org/wiki/Event-driven_process_chain
(date of application: 26.06.2022)
3.
Makarov
N. S., Uml: podderzhka proektirovania i instrumentalnie sredi [Uml: design
support and tooling] // Journal of Applied Informatics. 2007. №2 [in Russian].
4.
Tasvaeva
A. N., Diagrammi potokov dannih i variantov ispolzovania kak instrumenti
proektirovania informazionnih sistem [Data flow and use case diagrams as information
system design tools] // Models, systems, networks in economics, technology,
nature and society. 2012. №2 (3) [in Russian].
5.
Functional
block diagrams [web-resource] / URL:
https://rus-visio-blog-archive.github.io/2016/04/06/4605.htm (date of application:
26.06.2022).
6.
Chinosi,
M., Trombetta, A. BPMN: An introduction to the standard. Computer Standards
& Interfaces, 2012. 34(1), pp. 124–134. doi:10.1016/j.csi.2011.06.002.
7.
Recker
J., Mendling J. On the translation between BPMN and BPEL: conceptual mismatch
between process modeling Languages, in: Thibaud Latour, Michael Petit (Eds.),
Proceedings 18th International Conference on Advanced Information Systems
Engineering, Proceedings of Workshops and Doctoral Consortiums, 2006, pp.
521–532.
8.
Ouyang C., Aalst
W.M., M. Dumas, Hofstede A.H. From business process models to process-oriented
software systems: the BPMN to BPEL way // Technical Report BPM-06-27, BPM
Center, 2006.
9.
Kulikov
G. G., Shamsutdinov R. R., Alimbekova S. R., Gabbasov, R. K. Application of Business
Processes Models Generating Methodics Using BPM Notation while Regular, Project
and Situation Management in Oil Sector // Bulletin of USATU, 2010. № 14 1(36),
с. 136-147 [in Russian].
10.
Kulikov G. G.,
Gabbasov, R. K., Navalihina N. D., Timchenko A. A. he adaptation of the
priciples of system engineering and BPMN to the process of transferring the
governmental and municipal services into electronic form along with foundation
the interdepartmental electronic relations // Bulletin of USATU, 2013. 17 (5 (58)),
с. 12-19 [in Russian].
11.
Popov E. V.,
Veretennikova A. YU., Fedoreev S. A. Modelirovanie biznes-processov
kraudinvestingovyh platform na osnove tokenizacii aktivov [Modeling of business
processes of crowdinvesting platforms based on asset tokenization] // The world
of new economy, 2022 [in Russian].
12.
Chetverushkin
B.N., Sudakov V.A. Factor Model for the Study of Complex Processes // Dokl.
Math. 2019. V. 100. – pp. 514–518.
13.
The Universal
Process Orchestrator [web-resource] / URL: https://camunda.com/ (date of
application: 26.06.2022).
14.
APACHE LICENSE,
VERSION 2.0 [web-resource] / URL: https://www.apache.org/licenses/LICENSE-2.0
(date of application: 26.06.2022).
15.
Low-code
platform for automation and robotization of business processes and CRM
[web-resource] / URL: https://elma365.com/ru/ (date of application:
26.06.2022).
16.
Free online
service for business process modeling [web-resource] / URL:
https://bpmn.studio/ (date of application: 26.06.2022).
17.
Software
product "PiterSoft: BPM" [web-resource] / URL: https://piter-soft.ru/bpm/
(date of application: 26.06.2022).
