HENP experiments generate vast
volumes of data. As a result, HENP became one of the first scientific domains
that faced the need for the processing and analyzing of exascale data and
associated metadata.
The rapid growth and complexity
of the distributed computing infrastructure of modern scientific HENP
experiments as well as the exponential growth of the processed data volumes led
to the emergence of new issues, whose solution can be significantly simplified
with the use of visual analytics. Historically, the scientific experiments in
the HENP domain used various visualization tools for data representation and
for the different classes of tasks: detector functional simulation, the
analysis of physics events, representing the results of research for
information exchange within the scientific community. Such applications as HBOOK[1], PAW[2], ROOT[3], Ganglia[4], Geant4[5] have
visualization tools which can be used for the purposes of visual data analysis.
In this paper we present the
results of our studies of the metadata of the ATLAS experiment [6]. Information
accumulated during many years of operation of the ATLAS data processing and
analysis system (ProdSys2/PanDA [7,8]) contains data about the execution of
more than 10 million tasks and 3 billion jobs (for more details about
production system tasks and jobs see sections 2 and 3). The existing tools
provide real-time control, monitoring and estimates of many parameters and
metrics of the system. However, the current monitoring infrastructure does not
have instruments for measuring the correlations among many different properties
of the objects, as well as to analyze the time delays and its possible reasons during
the execution of the computational tasks or jobs in the distributed computing
environment.
In order to address these issues,
visual analytics methods can be applied to derive new (implicit) knowledge
about investigated data objects and to provide efficient interaction with data,
relevant to the human cognitive system used for complex information processing.
In this paper we describe the
cluster analysis of the computational jobs with the use of visual analytics
methods. This is the first stage of the project of leveraging visual analytics
for studying ATLAS distributed data processing system operations. This analysis
will allow users to visually interpret the jobs with similar parameters by
using 3-dimensional projections and, at the same time, to monitor the
correlations among different combinations of parameters.
The LHC experiments use computing
Grid infrastructure that is provided by the Worldwide LHC Computing grid
project (WLCG) [9], supercomputers and cloud computing facilities to process
large amounts of data.
The second-generation ATLAS
Production System ProdSys2 is designed to run complex computing applications, described
by the concepts of computing tasks and jobs.
•
A task contains
the description of data processing applied to one dataset (a group of files
with statistically equivalent events) in the ATLAS experiment, with processing
parameters specified by the user/coordinator and the parameters describing the
processing conditions. It also contains a “transformation” script to derive the
output data files from the input files, and the version of the compiled
software. Tasks are split into jobs that are then executed in the distributed
computing environment. The results of task execution, i.e. the files,
constitute the output datasets.
o
ProdSys2 orchestrates the workflows of tasks,
including the chaining of tasks that act in sequence on the same datasets. It
manages tasks related to event simulation (event generation from physics
models, detector simulation etc.) and to event reconstruction and analysis.
Tasks are split into jobs that are then executed in the distributed computing
environment. The results of task execution, i.e. the files, constitute the
output datasets.
o
The processes of creating chains of tasks, their
fragmentation into jobs, scheduling jobs execution, and their launching on
computing resources, are performed by ProdSys2/PanDA and are fully automated.
•
A job is
the unit of processing (i.e., "payload" for a computing node). The
job record contains information on the input and output files, the code to be
run and, after execution, the parameters of the computing node on which it ran
and some performance metrics.
Currently (2018), the
computational workload of the distributed data processing and analysis system
ProdSys2/PanDA manages on an average 350K tasks per day in over 200 computer
centers (totalling more than 300K computing nodes) by thousands of users [7]. Figure
1 shows that the system processes on an average 129 PB of data per month, while
figure 2 shows the number of completed jobs, which is about 23.8 million per
month. It is important to note that during the periods preceding important
events (such as international conferences in HENP) the number of completed jobs
reaches up to 2 million per day.
The scale of the system described
above, its internal complexity, heterogeneity and distribution, as well as the
volume of data processed requires non-trivial analytical tools to analyze and
forecast the state of system functioning. The first step that needs to be done
in this direction is the development of a toolkit that provides a convenient
and understandable way of identifying correlations through data clustering; it
will allow not just the use of various clustering algorithms, which are often
represented as "black boxes", but also provide the researcher with
the opportunity to interact with clustering parameters and have a visual
presentation of their results. This will strengthen the human control over the
analysis process of complex multidimensional data and make this analysis more
meaningful.
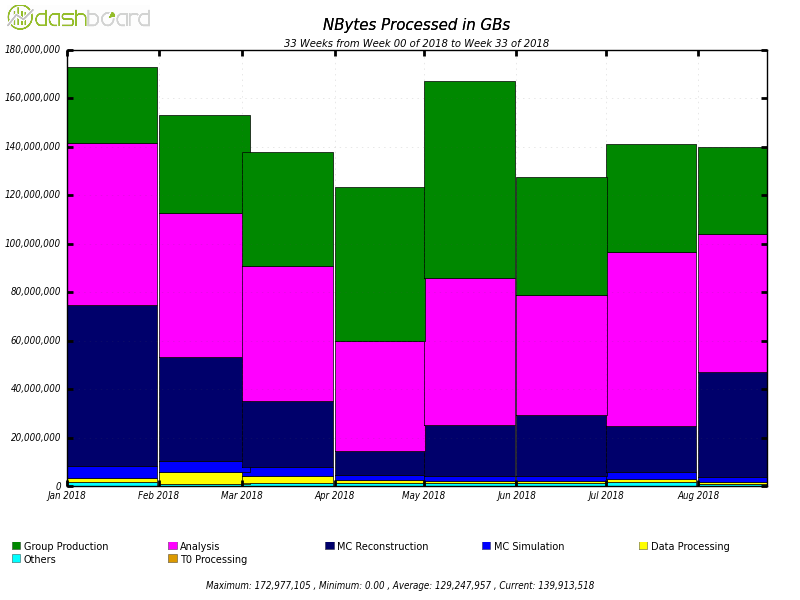
Figure 1. The volume of data processed
by ProdSys2/PanDA in the ATLAS experiment from January to August 2018 as function
of the job type
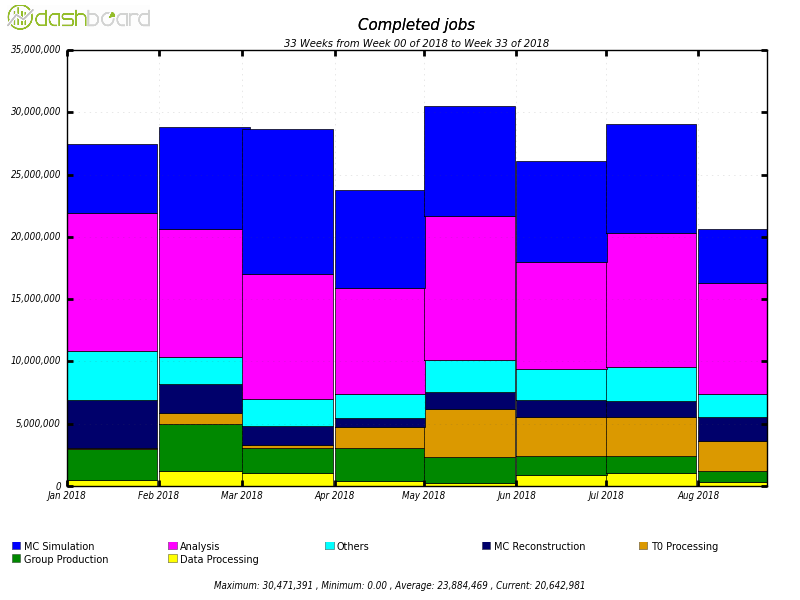
Figure 2. The number of completed jobs
in the ATLAS experiment from January to August 2018 as function of the job type
The first stage of the research is
searching for the relevant input data and its preprocessing for the further
analysis. In our case we have chosen the performance metrics of ProdSys2/PanDA
jobs belonging to particular tasks. ProdSys2/PanDA keeps the state and all the
running parameters of jobs in an Oracle database. Jobs themselves send
monitoring information back to Oracle, from where it can be collected and
preprocessed for subsequent analysis.
Following this we can generate the
visual 3-dimensional projections of the values of the jobs parameters and
analyze them. This allows exploring and understanding the progress
of data processing for tasks as their jobs have the same executable code and
the same size of the input data. The following test parameters that
characterize the resource consumption were chosen to describe computing jobs:
•
Task ID in ProdSys2/PanDA: ID
(integer)
•
Duration of the computing
job execution: duration (integer)
•
Volume of input data for the
job: inputFileBytes (integer)
•
Volume of output data of the
job: outputFileBytes (integer)
•
Processor efficiency (the
ratio of total processor power times
duration by the product of the job execution
time by the number of cores): CPU eff per core (integer)
o cpu_eff = cpu_time / (wall_time * num_of_CPU)
•
Consumption of the processor
time: CPU consumption (integer)
•
Average size of memory pages
allocated to the process by the operating system and currently located in RAM: avgRSS
(integer)
•
Average portion of memory occupied by a process,
composed by the private memory of that process plus the fraction of shared
memory with one or more other processes: avgPSS (integer)
•
Average size of the
allocated virtual memory: avgVMEM (integer)
In order
to perform a cluster analysis using visual analytics
methods, the sequential projections method was used [10]. This method
was developed by the research group of MEPhI (“Scientific Visualization”
laboratory) and its main idea is to transform the multidimensional data objects
and the distance between them into geometrical objects.
It allows the analysis of the data directly
within the initial multidimensional space, without the need to use the
dimensionality reduction techniques. This method was described in the “Scientific
Visualization” journal [11]. The report was
presented at the GraphiCon’2014 conference, and the article was published based
on the conference materials [12]. The proposed method was tested on credit organizations’ data to
distinguish those with anomalous
characteristics [13].
The ProdSys2/PanDA computing job
parameters were given as multidimensional tabular data. Then every row of this
table was mapped to a point in multidimensional space  with the coordinates of points expressed as normalized parameters
values:
with the coordinates of points expressed as normalized parameters
values:  . In this work, the Euclidean
distance between points
. In this work, the Euclidean
distance between points  and
and  was chosen as the measure of differences
between computing jobs p and q:
was chosen as the measure of differences
between computing jobs p and q:  . To evaluate the distance
between n-dimensional points, the visual interpretation of those points
is used.
. To evaluate the distance
between n-dimensional points, the visual interpretation of those points
is used.
The initial set of points is
projected into a 3-dimensional spaces. Each multidimensional point pi
is projected to a 3-dimensional point, which then is represented as a sphere Si
(using the central perspective, that is, all the other coordinates, besides
those three in use, are equated with zero). A graphical projection of the
obtained spatial scene is presented to the user (Figure 3). Thus, the user has
tools to control the image and the spatial scene (affine transformations,
gathering the information about the points corresponding to spheres).
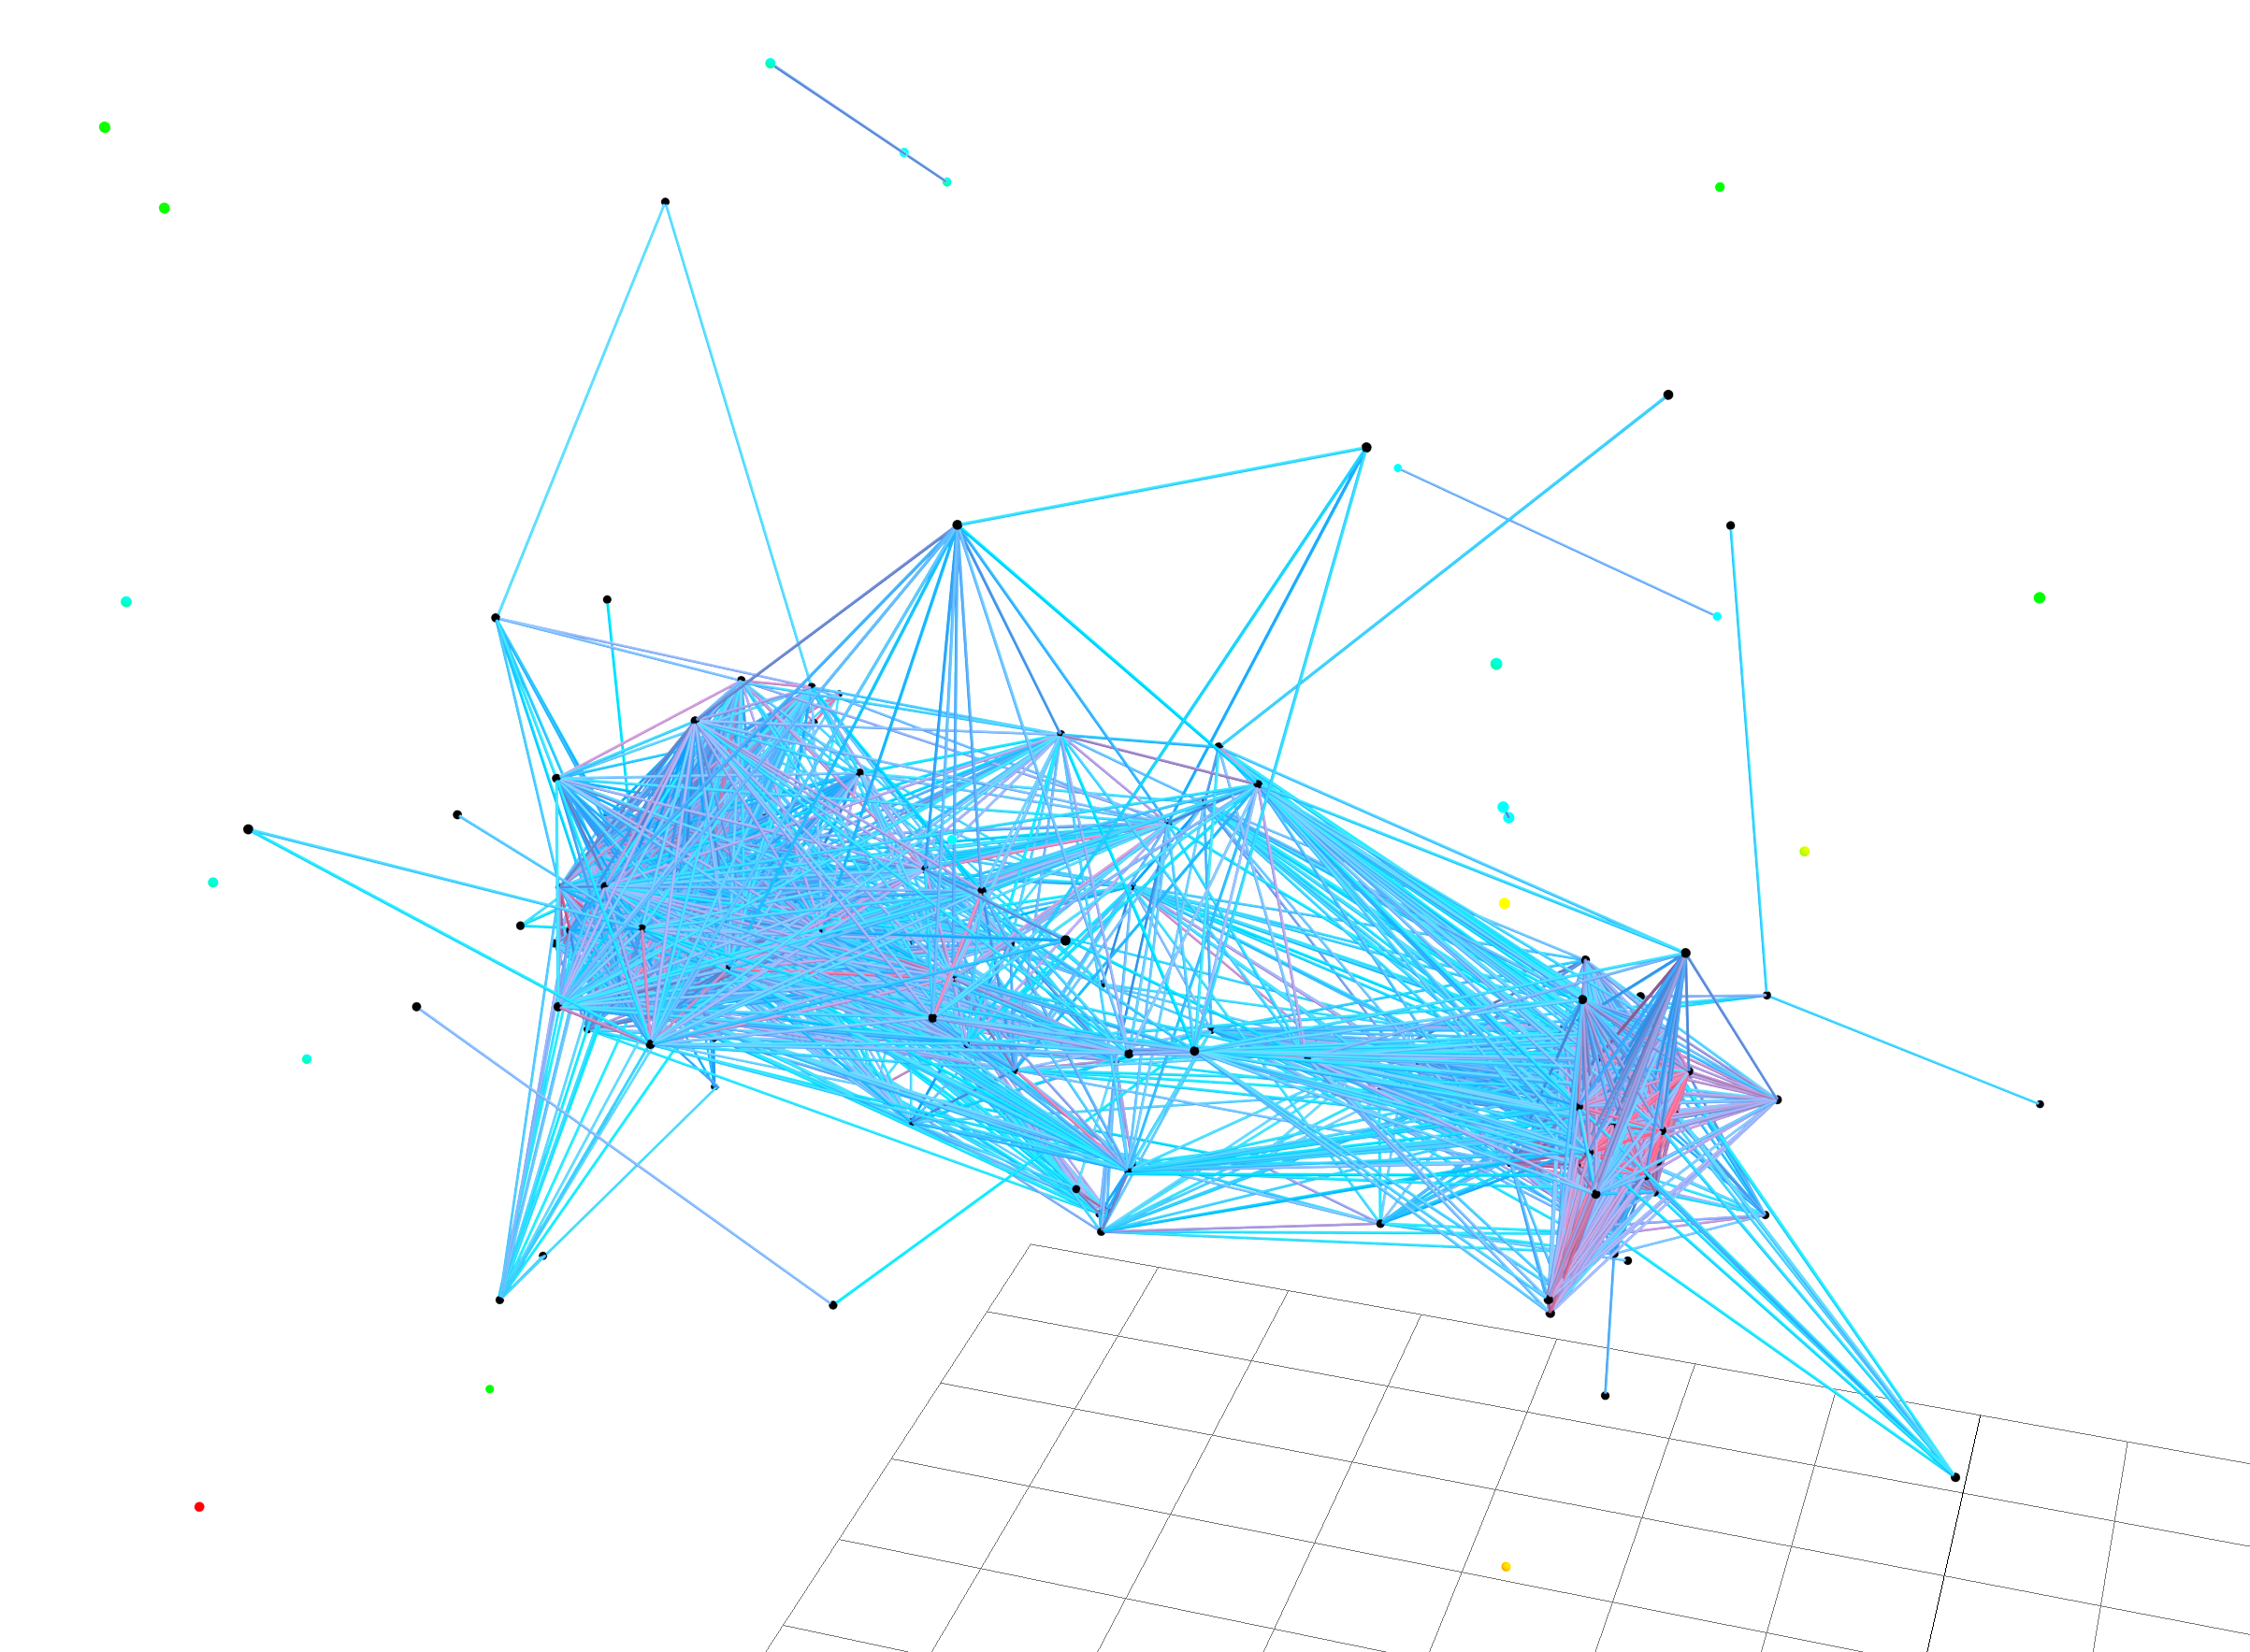
Figure
3. Spatial scene projection
For visual representation of
objects connectivity the threshold distance d (the maximum distance inside
the cluster), given by the analyst in an interactive mode, is used as shown
in Figure 4. If the distance between n-dimensional points is less than d,
points are connected with a segment, visualized as a cylinder, the color of
which changes from red (the distance is small) to blue (the distance is close
to d ). The groups of connected points form clusters. Separate points,
located far from all other points in the multidimensional space, represent the
anomalous data points that will be the object of more detailed investigations.
Thus the visually observable
presence of cylinders between spheres allows the analyst to visually capture
the closest points in space, forming a cluster, and corresponding to them
closest source objects, also forming their own clusters. Assigning different
colors to cylinders allows to make judgements about the distance in the
multidimensional space by only observing a 3-dimensional spatial scene.
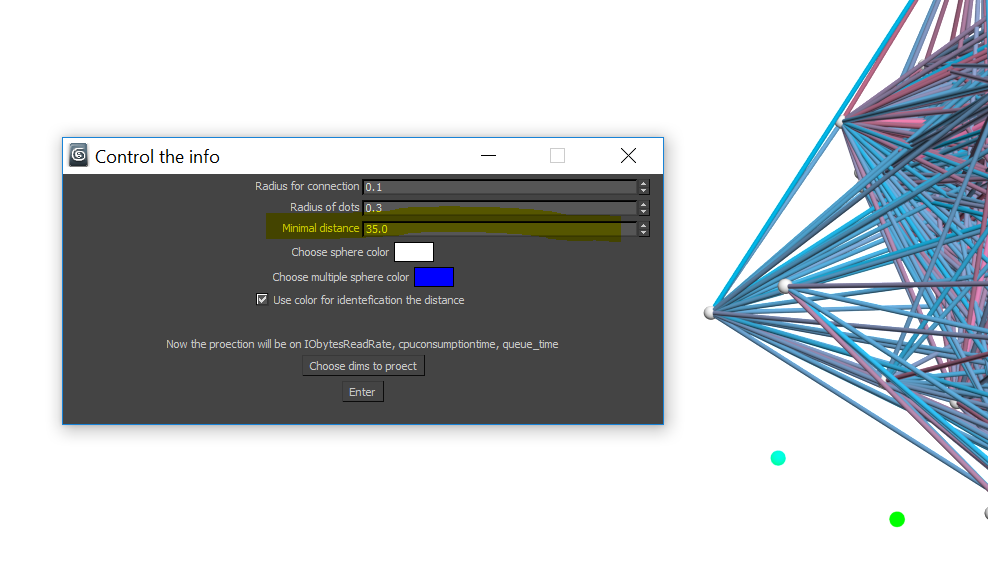
Figure
4. Control window of geometrical and optical
parameters. The threshold value d is marked in yellow.
Scientific
papers analyzing the description of specific applications using visual methods
suggest that interactive systems working with multidimensional data are often
given less importance than the results representation systems which use Data
Analysis methods. For example, there are systems such as the AdAware
situational alert system [14], the visual analysis system in aircraft tasks [15]
and the SAS Visual Analytics software package [16], designed to handle and
analyze large volumes of financial and economic information. All these systems
are industrial and commercial. They provide to the users a huge number of
interfaces and possibilities of visual representation of the data. At the same
time, there are no publications on the use of such systems in the field of
particle physics. As practice shows [17, 18], the classical methods of parallel
coordinates, Andrews curves, faces of Chernov [19] and other similar mnemonic
graphic representations are widely used for such visual representation of
multidimensional data. All these visual methods are based on the fact that the
analyzed tuples of numerical data are interpreted as values of parameters of
such mnemonic graphical representations.
However,
the majority of the visual analytics systems are tuned to the internal
processing of data and its representation in a form suitable for the user.
These systems do not allow the user to interact directly with the visual
representation of multidimensional data.
The
above method of clustering analysis of multidimensional data was implemented in
an application named IVAMD (Interactive Visual Analysis of Multidimensional
Data) [20]. This application allows users to interact directly with the initial
n-dimensional data. These data are not preprocessed. The analyst
manipulates the initial data in a targeted way providing the visual analysis of
the obtained results.
IVAMD was
written in MAXScript and a module written in C#. Its main
functionality includes displaying a spatial scene using customizable
visualization parameters (threshold
distance d, radius of the spheres and cylinders, three-dimensional
subspace for projection), performing affine transformations of the
three-dimensional space, calculating the distance in the original n-dimensional
space, splitting into clusters (clusters are denoted with colors), and conducting
the microanalysis (2-dimensional scatter plots) of the spaces. In the microanalysis, that is the analysis of distant points, it
is important which coordinates make a greater contribution to the distance -
whether it is due to all the coordinates or due to the large difference of only
few coordinates. To determine this, graphical projections of the original set
on the plane  are built and then all these projections are
viewed for different values of i. The results of clustering can be seen
while using the program, and they can also be exported to an Excel spreadsheet
marked with different colors, corresponding to the clusters and anomalous
points. An example of such a table is shown in Figure 5.
are built and then all these projections are
viewed for different values of i. The results of clustering can be seen
while using the program, and they can also be exported to an Excel spreadsheet
marked with different colors, corresponding to the clusters and anomalous
points. An example of such a table is shown in Figure 5.
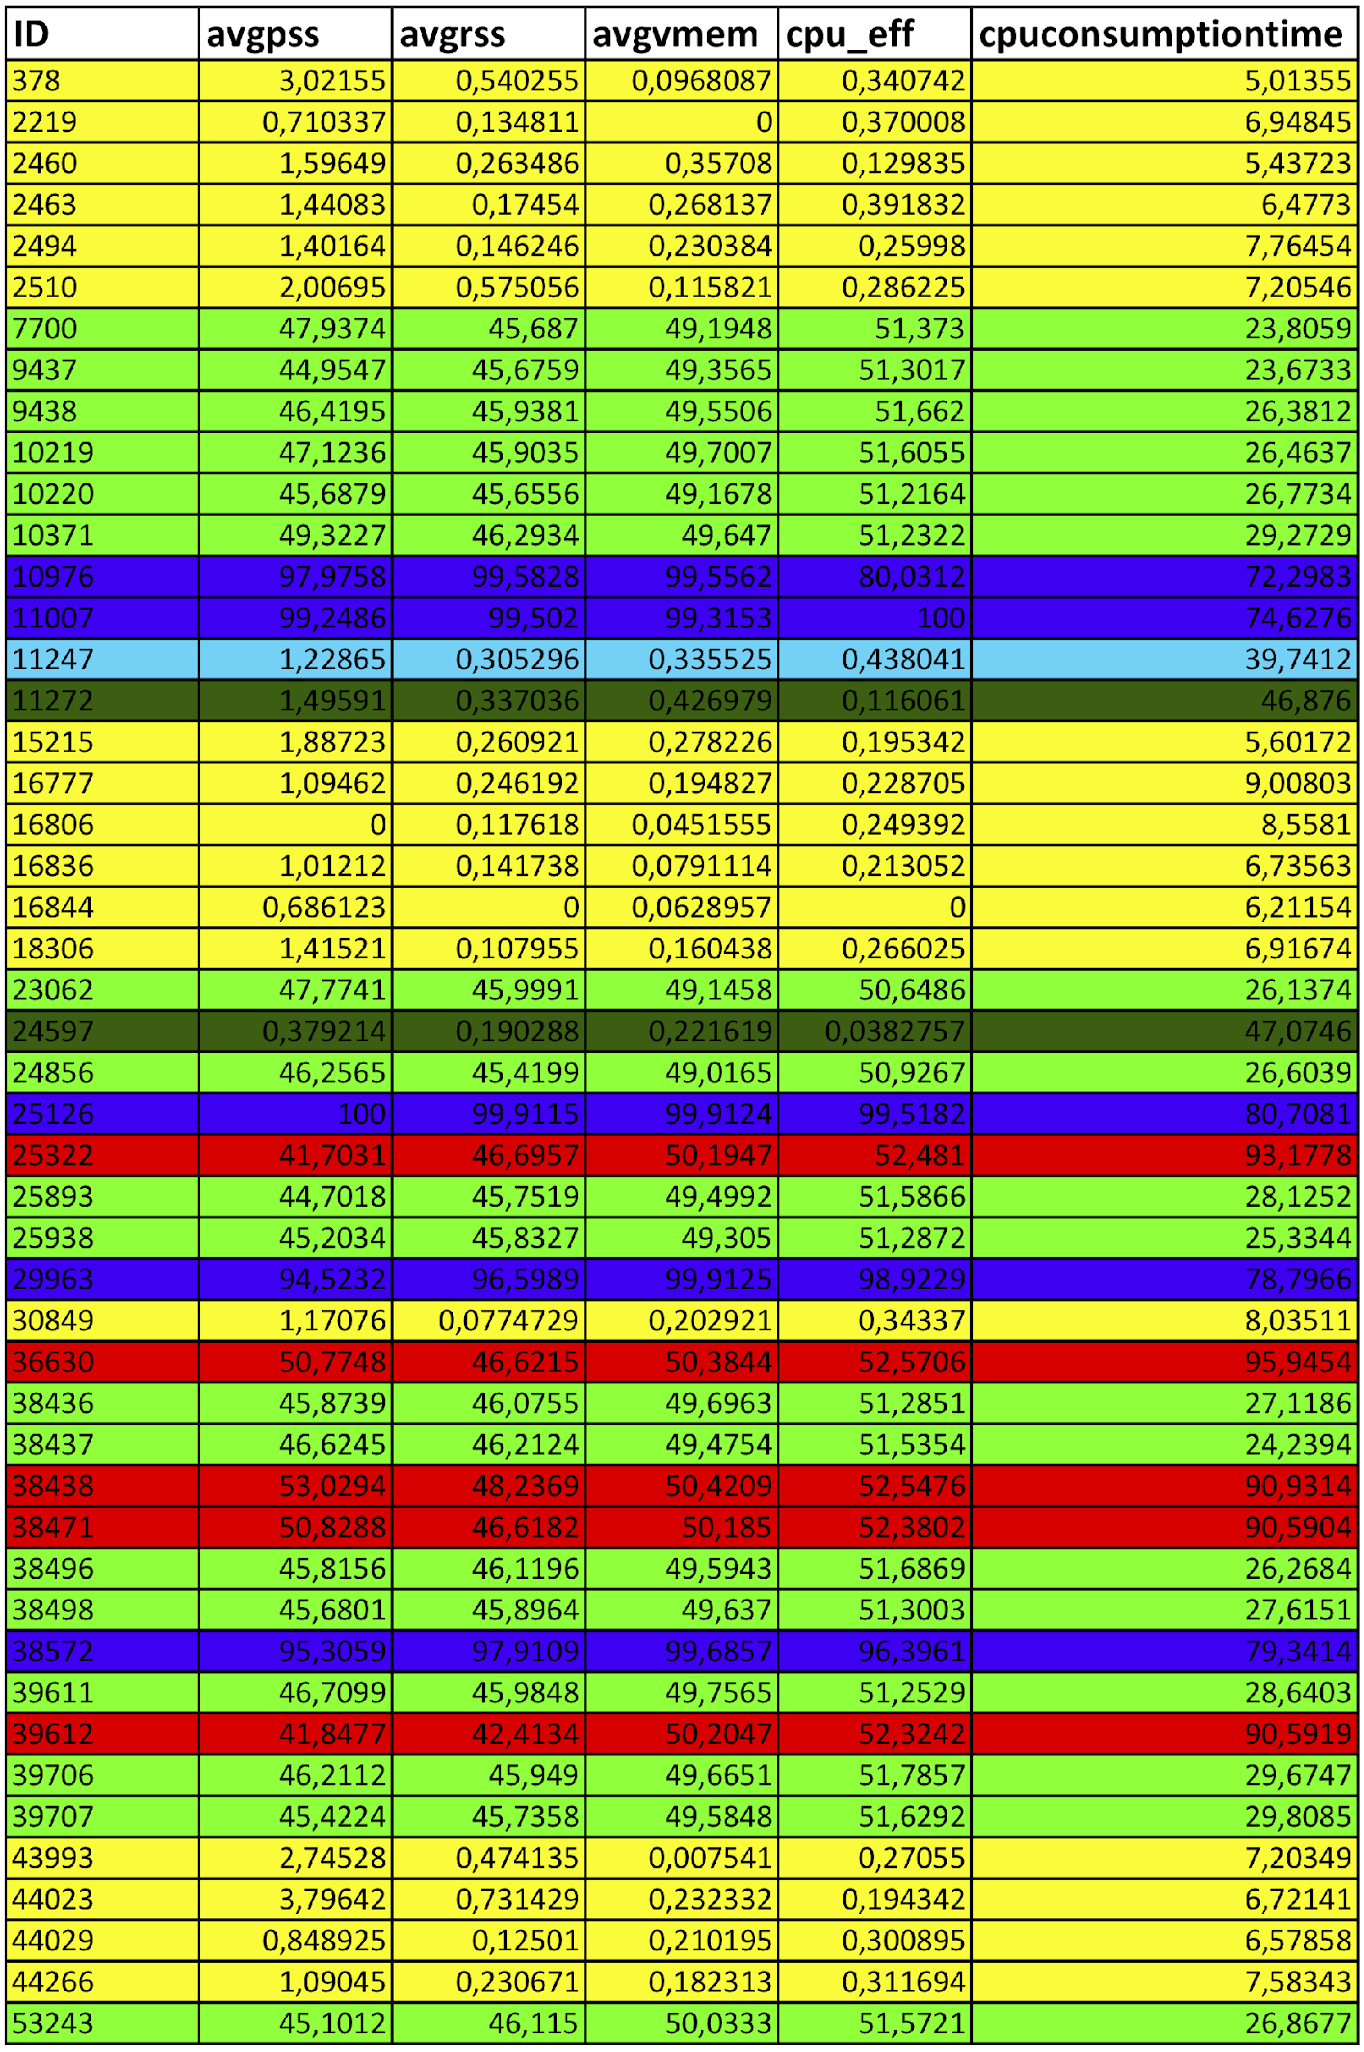
Figure 5. The resulting table with color highlighting of clusters and anomalous
objects
Due to the peculiarity of the
method, the necessary number of objects for visualization to solve the problem
(m rows, n columns) is m spheres (equal to the number of
rows) and the number of cylinders is equal to  . Resulting in
  objects to display; such that to display 100 lines, it is necessary
to display about 5050 3DSMax primitives. The described software is a prototype
of the implementation of the method and has a limit on the number of processed
objects. Further development and improvement of the prototype, and optimization
within the framework of high-performance hardware and software infrastructure
will eliminate the current limitations.
objects to display; such that to display 100 lines, it is necessary
to display about 5050 3DSMax primitives. The described software is a prototype
of the implementation of the method and has a limit on the number of processed
objects. Further development and improvement of the prototype, and optimization
within the framework of high-performance hardware and software infrastructure
will eliminate the current limitations.
The main advantage of this software
prototype is the interaction between the user and both the data and the spatial
scene. Changing the threshold distance iteratively, the researcher can visually
investigate the changes in the cluster data structure, track the state of anomalous
data objects like becoming abnormal at some threshold distance. In addition,
all spheres of the spatial scene are clickable, allowing the user to see their
multidimensional coordinates at any time. It allows the researcher to estimate
which coordinates make the greatest contribution to the formation of clusters.
To test the method, a visual
analysis of computational tasks consisting of dozens of jobs was performed. For
example, task number 12196428 from the data collected on 02-10-2017 consists of
74 jobs. The first step was a macro analysis of the entire subspace, i.e. the
original 7-dimensional space was clustered. The three-dimensional projection
was made on the subspace: avgPSS, duration, outputFileBytes (presented in
Figure 6). The results consist of 6 clusters (with a multiplicity of 31, 17, 8,
5, 3 and 2) as well as 2 disconnected points (clusters with a multiplicity of
1).
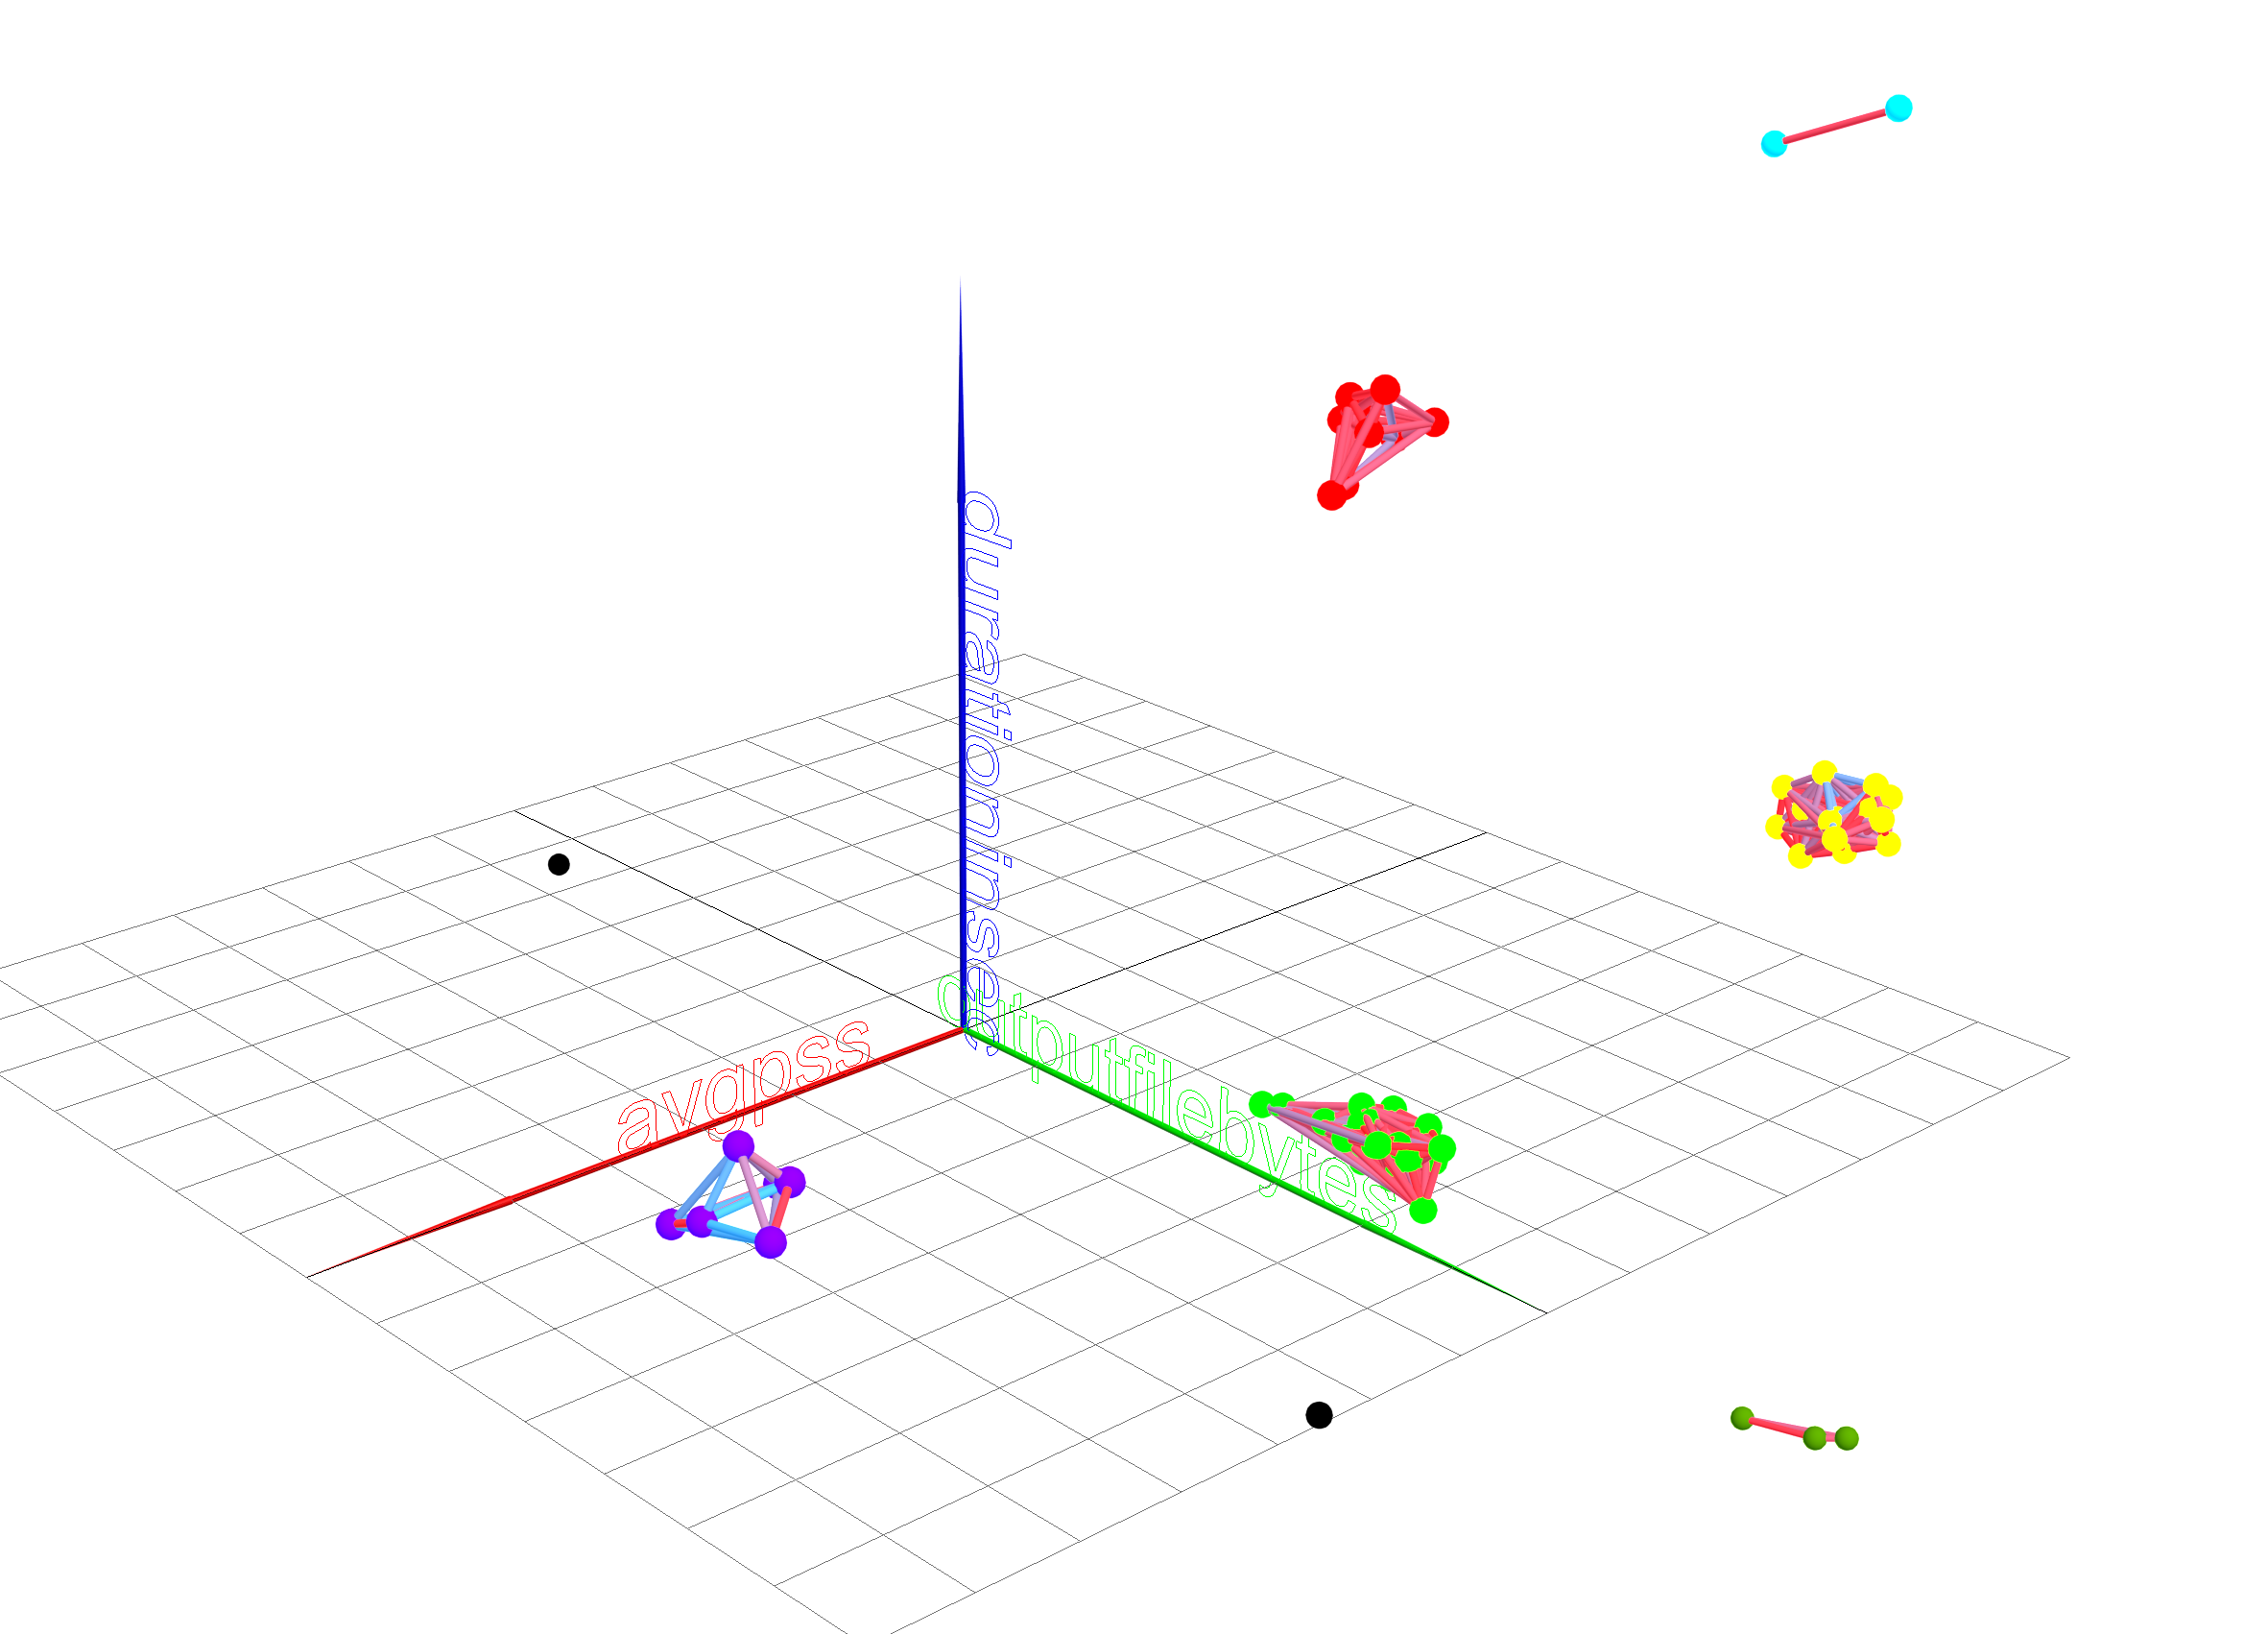
Figure 6. Partitioning into clusters in a three-dimensional projection (red axis
- avgPSS, green axis - outputFileBytes, blue axis - duration in sec)
Next, a microanalysis was carried
out to determine the contribution of various parameters to partitioning into
clusters, as well as assessing the influence of various parameters of objects
on the duration of the execution of computational tasks.
In
Figure 7, one can see that with the same avgPSS, the difference in duration
between the red and green clusters is significant. A similar pattern is
observed for the avgRSS and avgVMEM parameters, which allows us to conclude
that the listed parameters contribute to the duration of the tasks, but only at
moderate values. This
relationship requires additional research on more points.
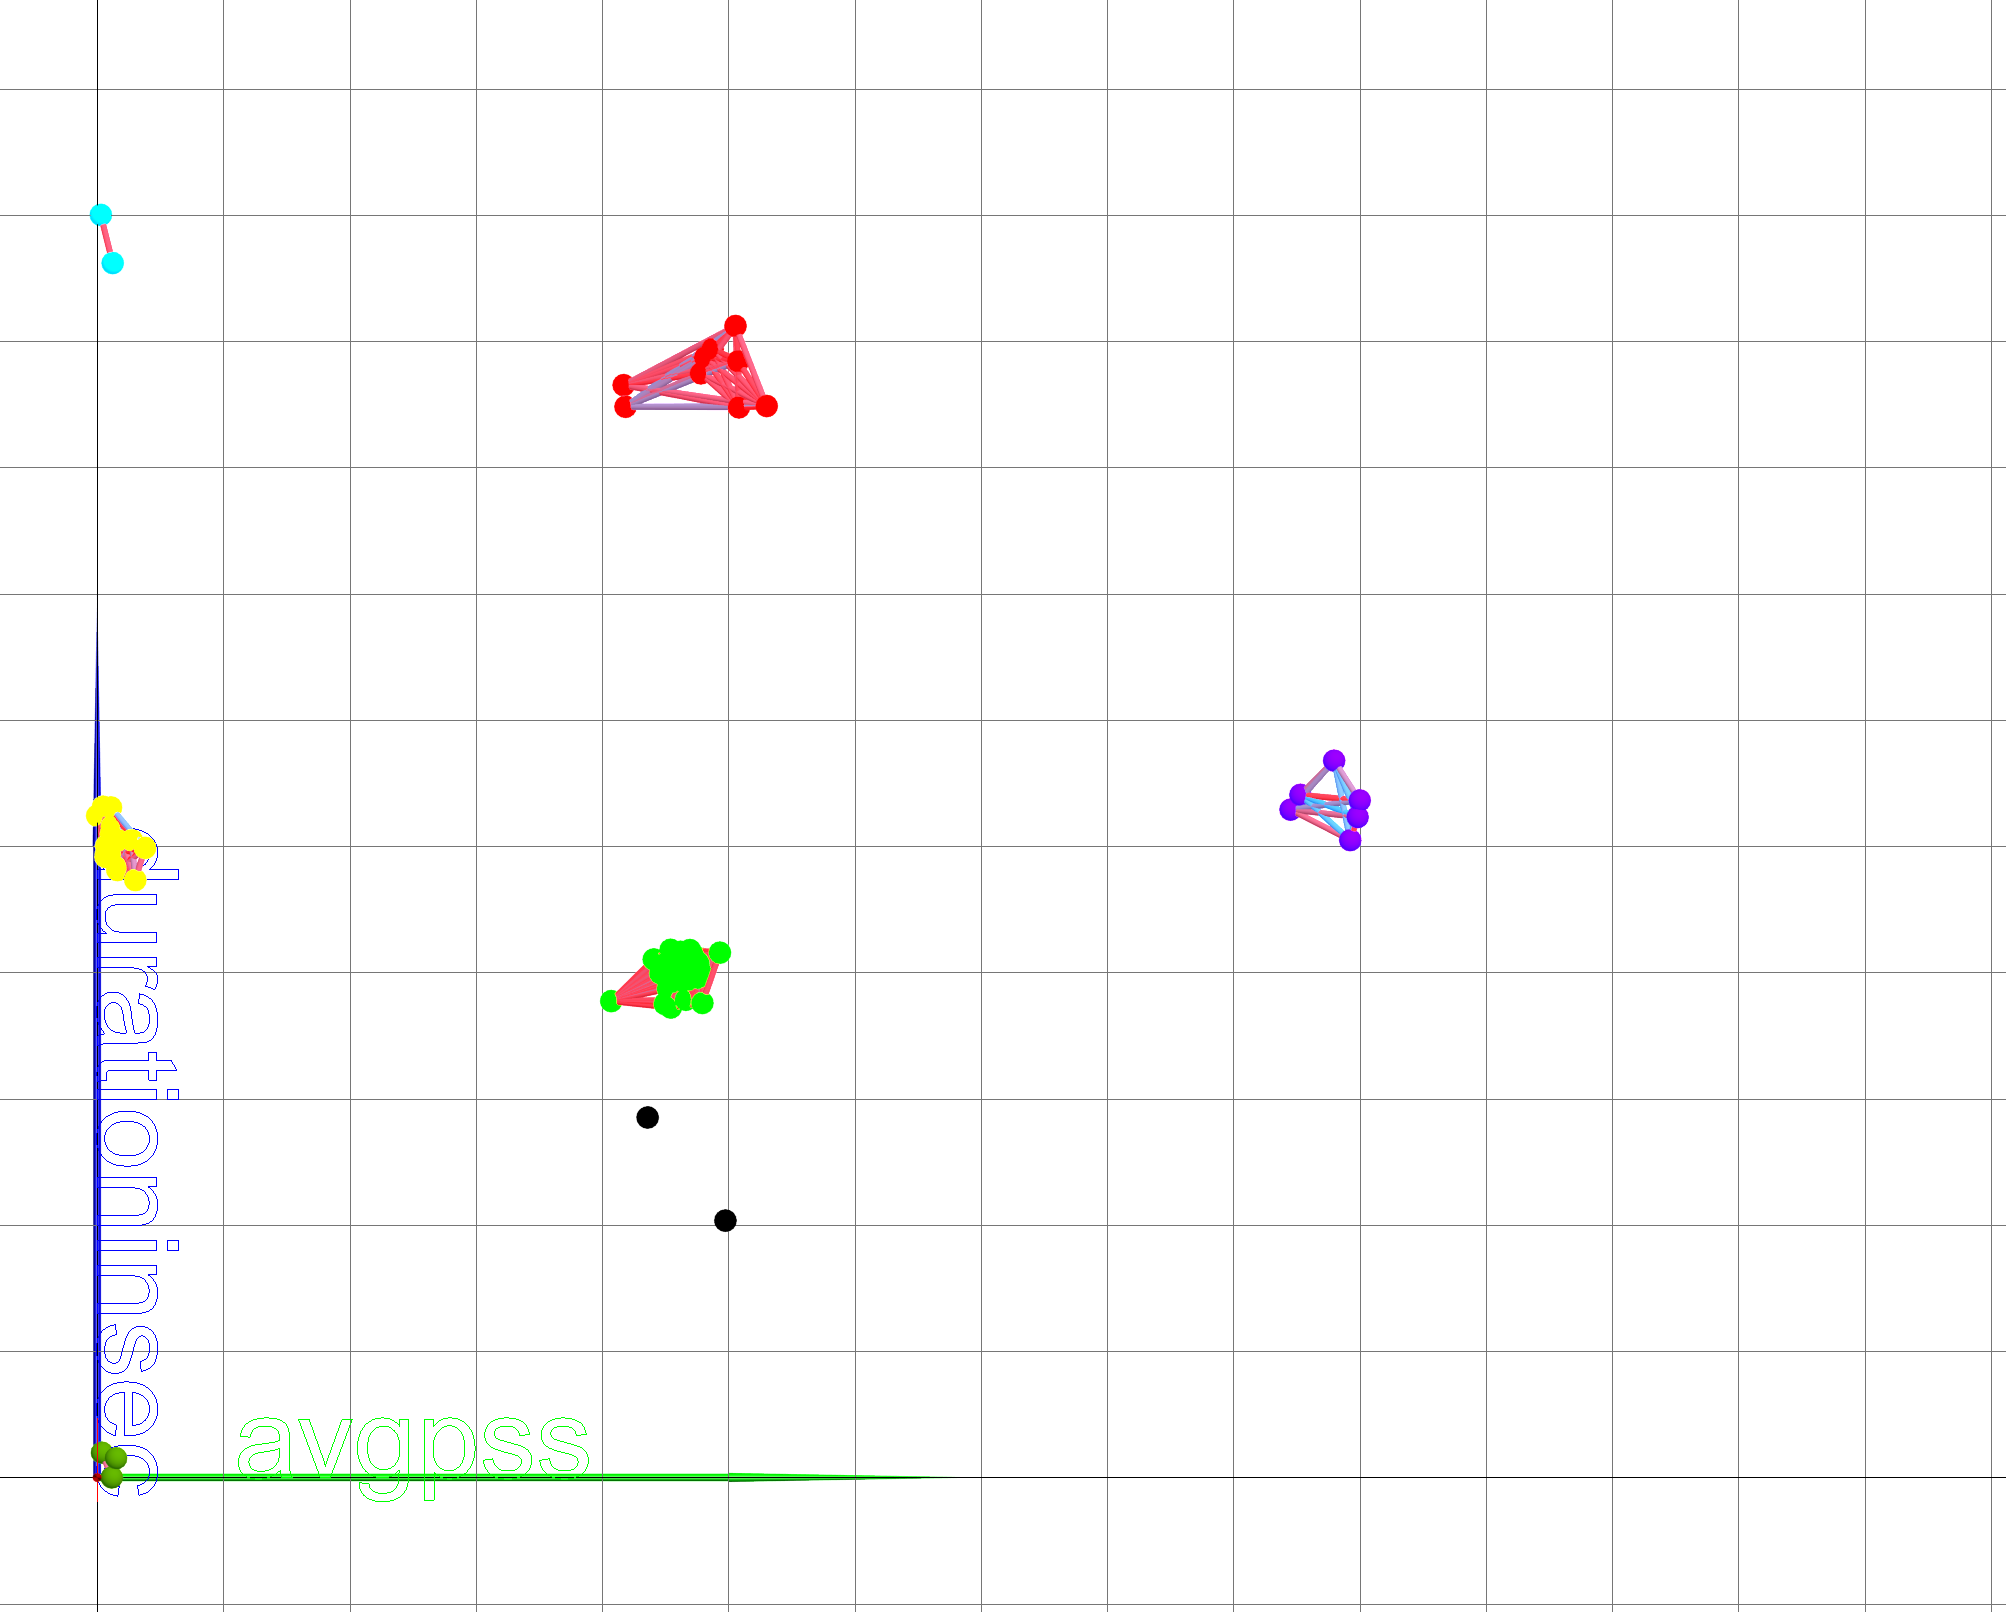
Figure 7. Graphic projection on the plane (avgPSS, duration)
In Figure 8 it can
be seen that the difference in CPU consumption is directly proportional to the
duration, as expected.
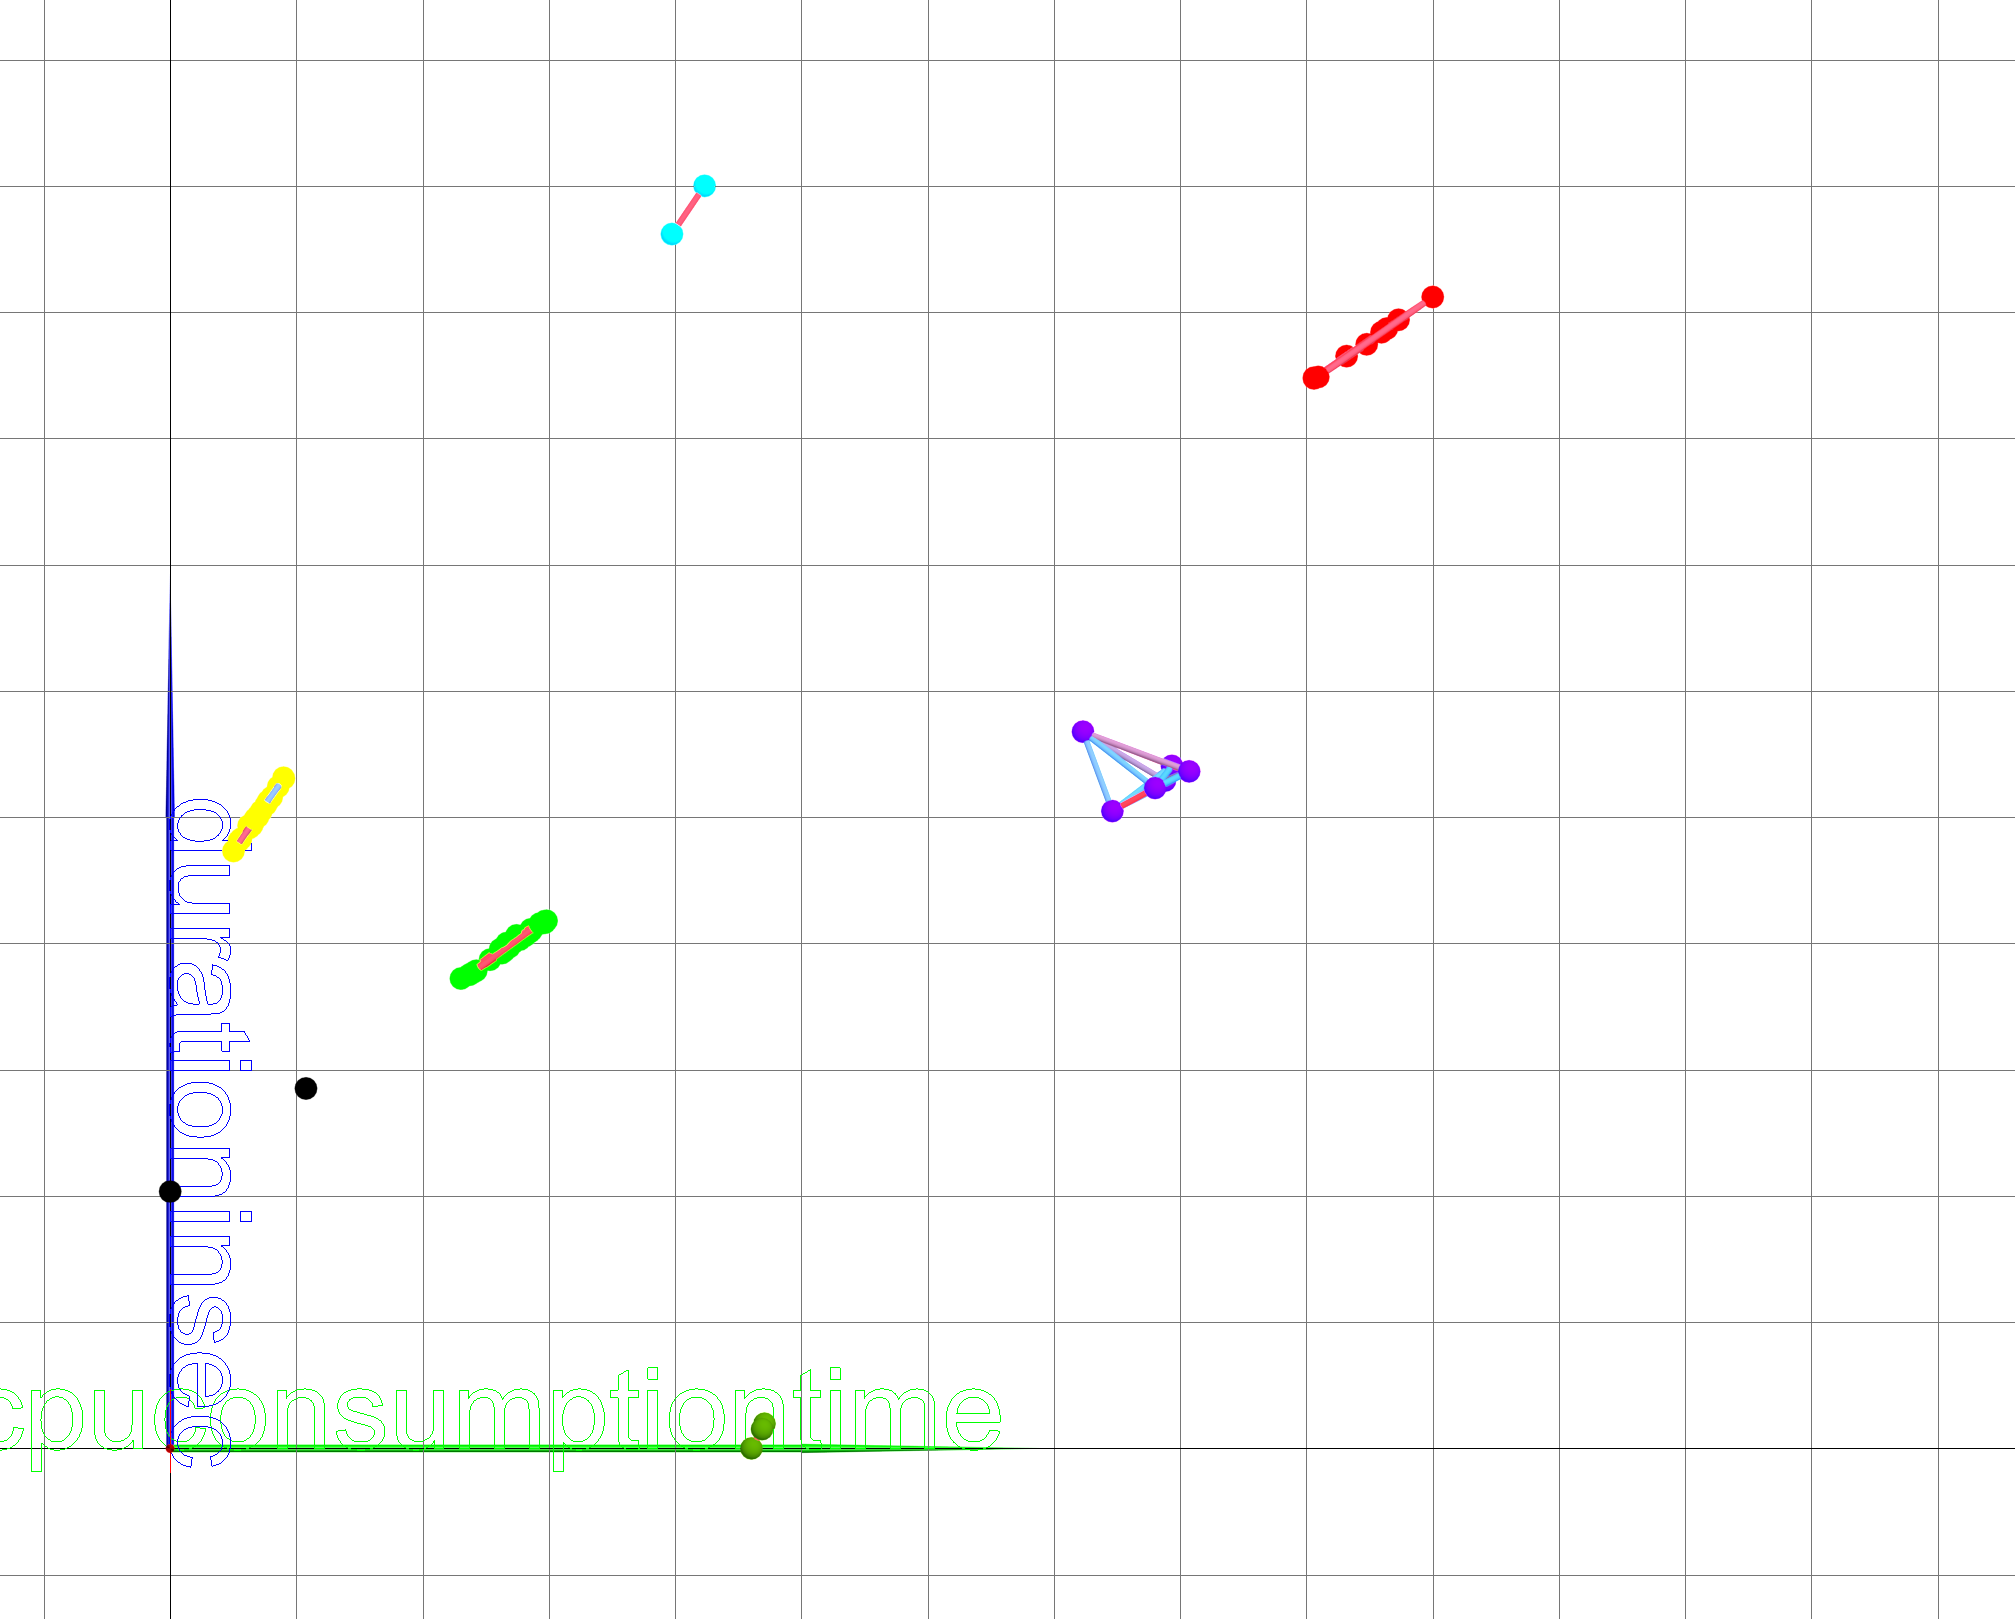
Figure 8. Graphic projection on the plane
(cpuConsumptionTime, duration)
Figure 9 shows
that the degree of influence of the input file size (inputFileBytes) on the
duration of processing and analyzing data is not decisive for distributed
processing. This also applies to the output data files (outputFileBytes) as it
is shown on figure 10. To quantify the impact of data volume on the duration of
the tasks, additional research is needed on more statistics, which will be
carried out in the future.
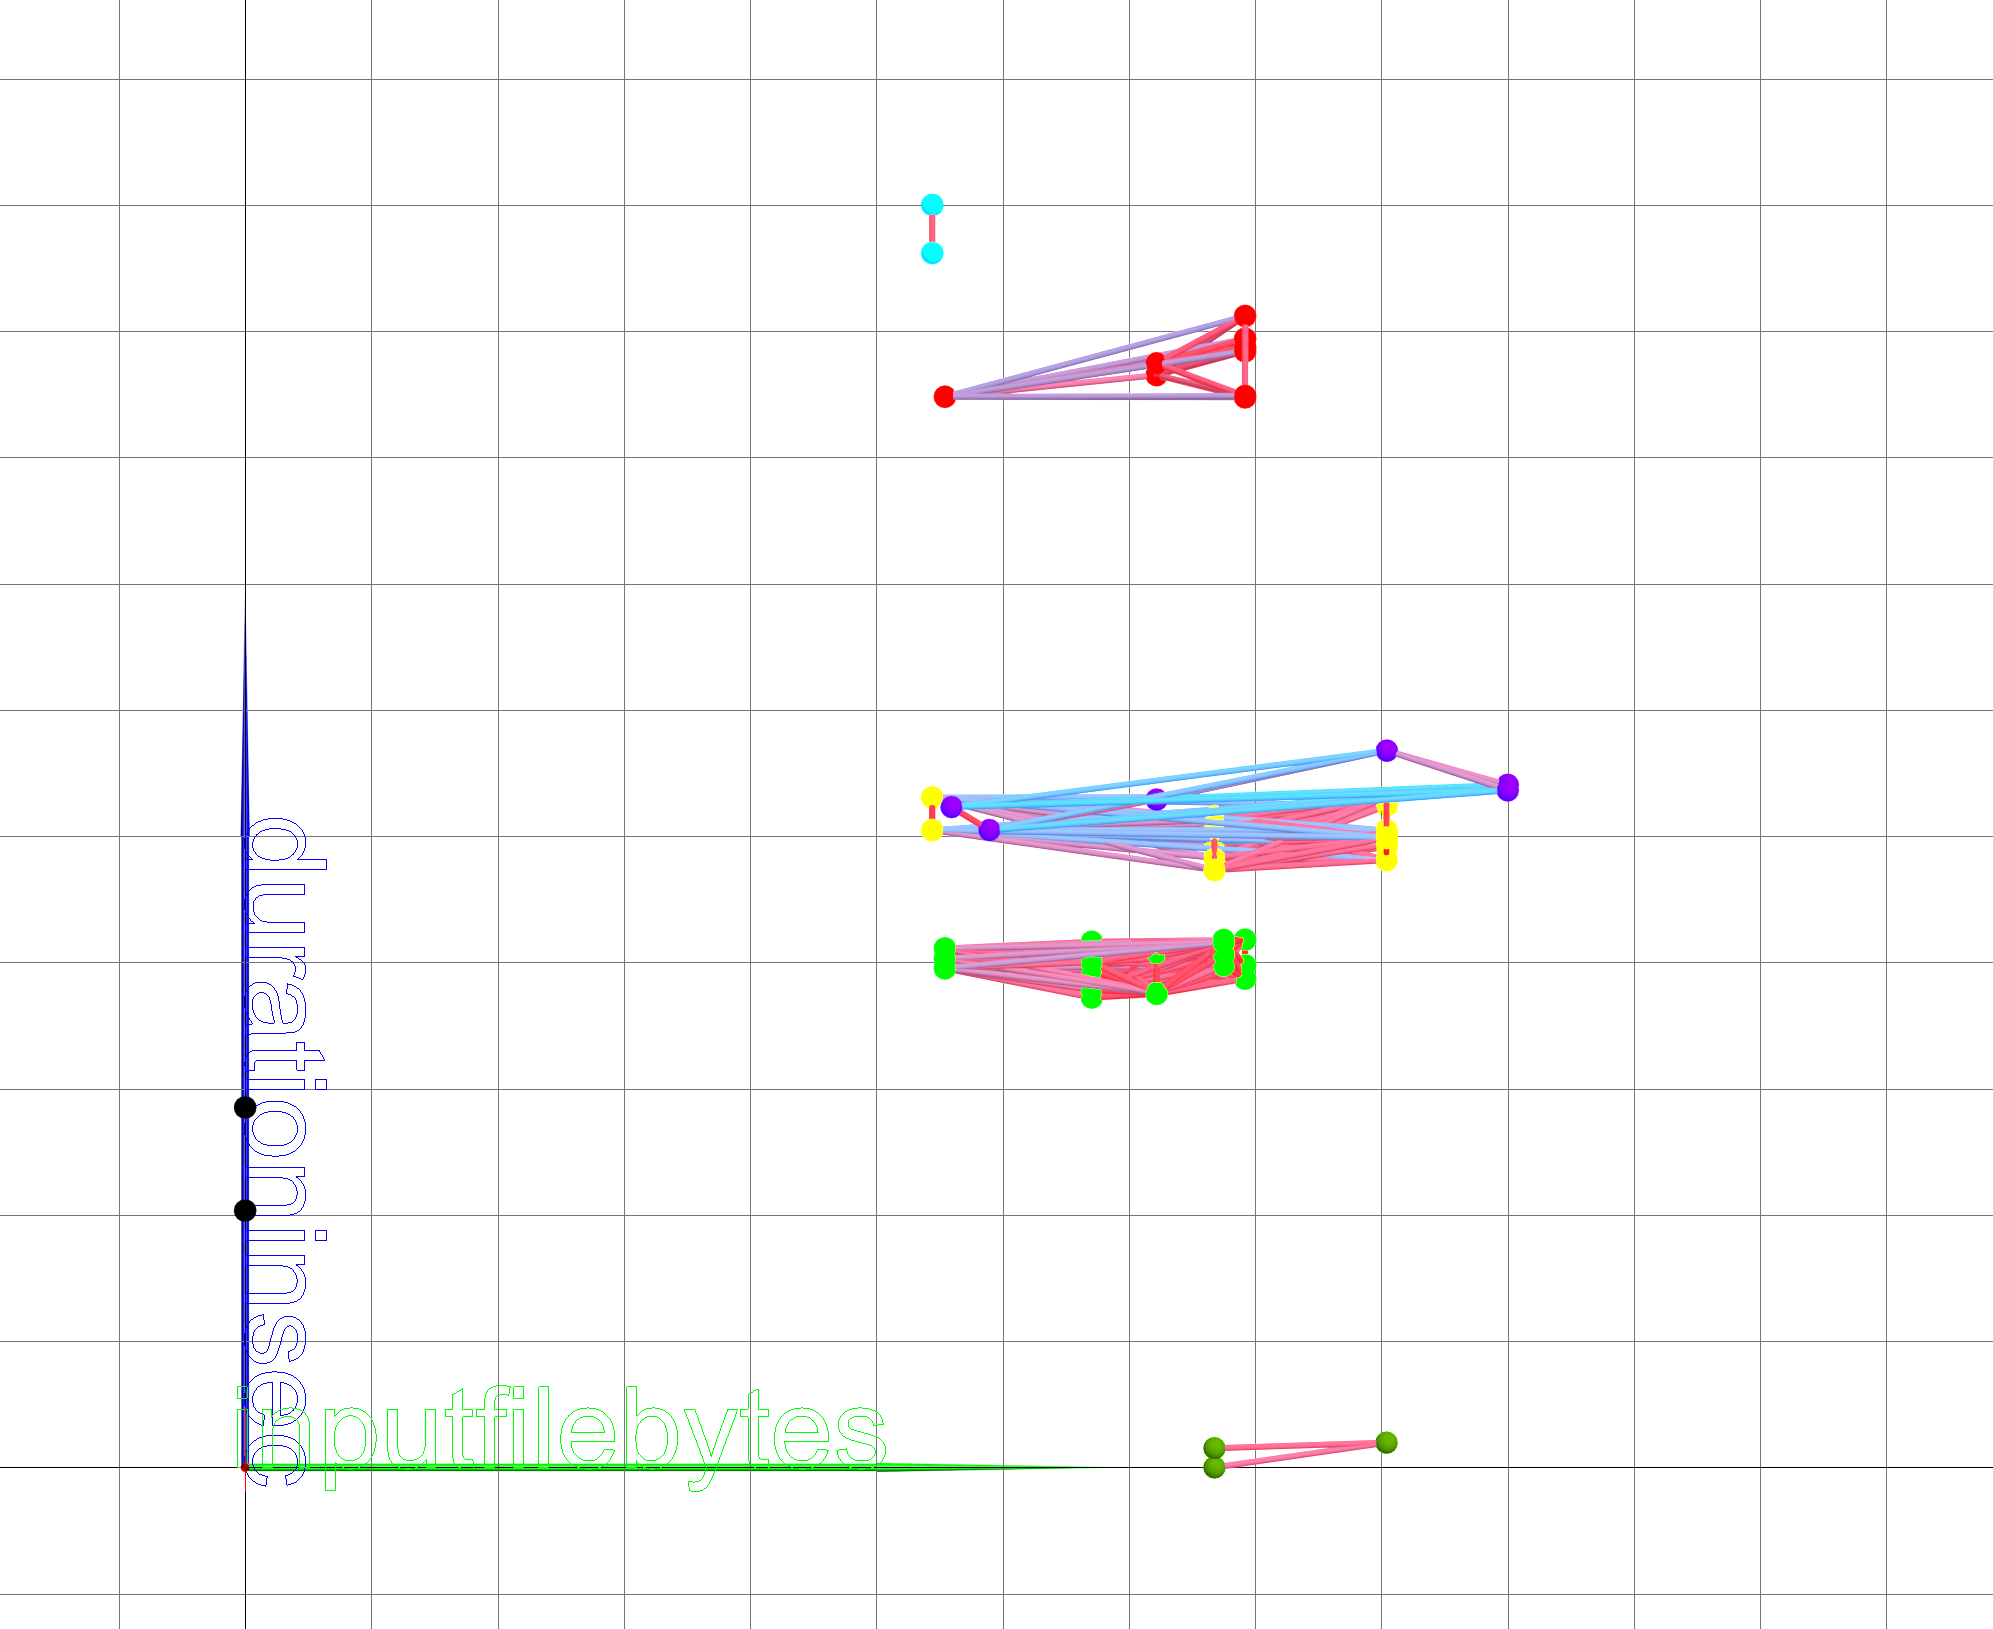
Figure 9. Graphic projection on the plane (inputFileBytes, duration)
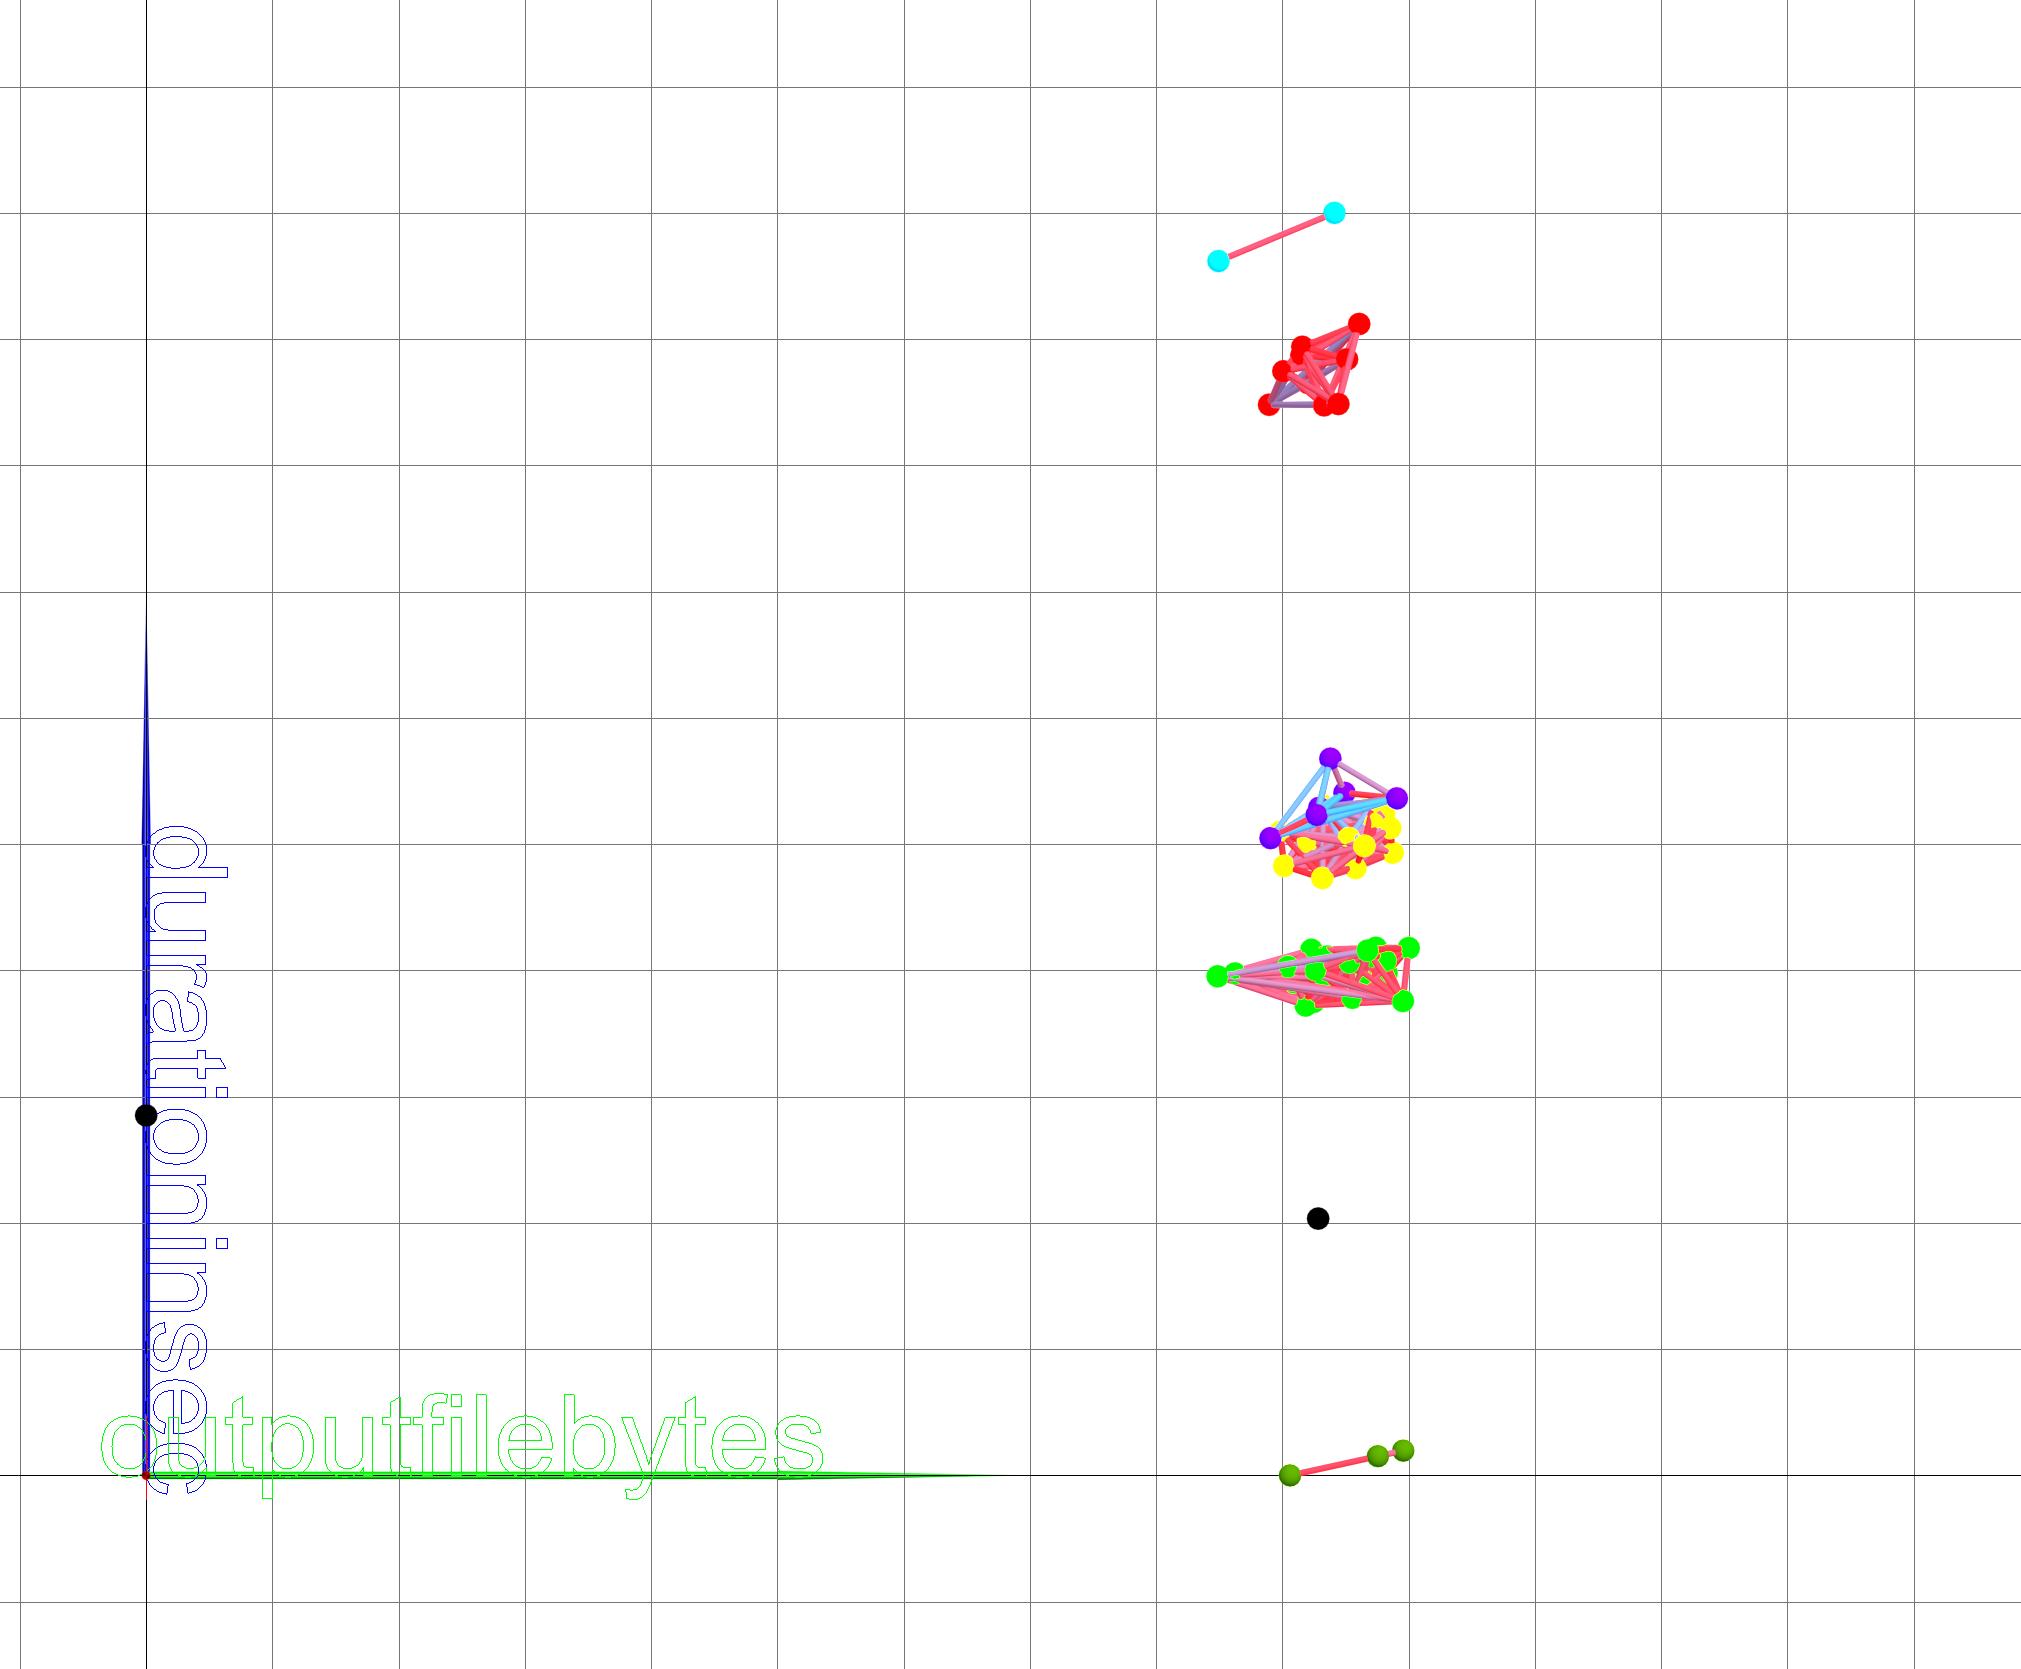
Figure 10. Graphic projection on the plane (outputFileBytes, duration)
This work is the first attempt to
apply visual analytics methods to the analysis of ATLAS distributed computing
metadata. Due to great amount of data and its complexity and
multidimensionality, the existing Machine Learning and Statistical methods of
data analysis need visualization tools, allowing to increase the human
supervision of the analysis process. This paper demonstrates the method of
visual analysis through clustering and categorization applied to jobs of the
ATLAS distributed data processing system. This method is based on the
geometrical representation of multidimensional data in 3-dimensional space in
form of spheres with precalculated n-dimensional distances between them.
The closest spheres are connected with segments, forming clusters. The analyst
interacts with the spatial scene, change the distance threshold and observe the
changing structure of the clusters.
As further development it is
planned to implement a multi-layered model of interactive visual clustering.
This model implies the concept of Superpoints: as the initial data samples can
be too large to have all data points visible, the visual representation can be
reduced by using Superpoints, which are collections of similar points [21].
Superpoints are computed using clustering algorithms and constitute the first
layer. Each Superpoint can then be analyzed separately as the collection of its
data objects, leading to the next layer of clustering. Furthermore, it is
planned to refine the visual analytics platform with the ability to
interactively switch among different layers of clusters. In this way the
researcher will be provided with a convenient method to interpret the results
of clustering based on different levels of data granularity.
The
results can be used for the visual monitoring of ATLAS distributed data
processing system as well as for the implementation
of optimisations of the jobs execution time.
This work has been
supported by the RSCF grant No. 18-71-10003. This work was done as part of the
distributed computing research and development programme of the ATLAS
Collaboration, and we thank the collaboration for its support and cooperation.
1. R Brun and P Palazzi. Graphical Presentation for Data Analysis in
Particle Physics Experiments: The HBOOK/HPLOT Package // Proceedings Eurographics
’80, pp.93--104, 1980.
2. R Brun, O Couet, C Vandoni and P Zanarini. PAW, a general-purpose
portable software tool for data analysis and presentation // Computer Physics
Communications, vol.57, no.1, pp.432-437, 1989.
3. I Antcheva et al. ROOT - A C++ framework for petabyte data storage,
statistical analysis and visualization // Computer Physics Communications,
vol.180, no.12, pp.2499--2512, 2009.
4. M Massie, B Chun and D Culler. The ganglia distributed monitoring
system: design, implementation, and experience // Parallel Computing, vol.30,
no.7, pp.817--840, 2004.
5. S Agostinelli et al. Geant4 - a simulation toolkit // Nuclear
Instruments and Methods in Physics Research Section A: Accelerators,
Spectrometers, Detectors and Associated Equipment, vol.506, no.3, pp.250--303,
2003.
6. The ATLAS Collaboration, The ATLAS Experiment at the CERN Large Hadron
Collider // Journal of Instrumentation, vol.3, S08003, 2008.
7. F H Barreiro et al. The ATLAS Production System Evolution: New Data
Processing and Analysis Paradigm for the LHC Run2 and High-Luminosity //
Journal of Physics: Conference Series, vol.898, no.5, 2017.
8. T Maeno et al. PanDA for ATLAS distributed computing in the next decade
// Journal of Physics: Conference Series, vol.898, no.5, 052002, 2017.
9. The Worldwide LHC Computing Grid, http://wlcg.web.cern.ch
10. A R De Pierro. From Parallel to Sequential Projection Methods and Vice
Versa in Convex Feasibility: Results and Conjectures // Studies in
Computational Mathematics, vol.8, pp.187--201, 2001.
11. Maslenikov, I Milman, A Safiullin, A Bondarev, S Nizametdinov, V
Pilyugin. The development of the system for interactive
visual analysis of multidimensional data // Scientific Visualization, vol.6,
no.4, pp.30--49, 2014.
12. Maslenikov, I Milman, A Safiullin, A Bondarev, S Nizametdinov, V
Pilyugin. Interactive visual analysis of multidimensional
data // 24th International conference of computer graphics and vision
GraphiCon, pp.51--54, 2014.
13. I Milman, A Pakhomov, V Pilyugin, E Pisarchik, A Stepanov, Yu
Beketnova, A Denisenko, Ya Fomin. Data analysis of credit organizations by
means of interactive visual analysis of multidimensional data // Scientific
Visualization, vol.7, no.1, pp.45--64, 2015.
14. Y Livnat, J Agutter, S Moon, S Foresti. Visual correlation for
situational awareness // IEEE Symposium on Information Visualization (INFOVIS),
pp.95--102, 2005.
15. D Mavris, O Pinon, D Fullmer. Systems design and modeling: A visual
analytics approach // Proceedings of the 27th International Congress of the
Aeronautical Sciences (ICAS), 2010.
16. SAS the power to know, [Online]. Available:
http://www.sas.com/en_us/home.html [accessed on 10.02.2018].
17. K Xu, L Zhang, D Pérez, P H. Nguyen, A Ogilvie-Smith. Evaluating
Interactive Visualization of Multidimensional Data Projection with Feature
Transformation // Multimodal Technologies and Interaction, 2017, 1, 13;
doi:10.3390/mti1030013
18. J. Poco, R. Etemadpour, F.V. Paulovich, T.V. Long, P. Rosenthal, M.C.F.
Oliveira, L. Linsen and R. Minghim. A Framework for Exploring Multidimensional
Data with 3D Projections // Eurographics / IEEE Symposium on Visualization 2011
(EuroVis 2011), Vol 30, Number 3
19. S Murray. Interactive Data Visualization for Web // O’Reilly Media,
2013, ISBN: 978-1-449-33973-9
20. D Popov, I Milman, V Pilyugin and A Pasko. A solution to a
multidimensional dynamic data analysis problem by the visualization method //
Scientific Visualization, vol.8, no.1, pp.45--47, 2016.
21. B C Kwon, B Eysenbach, J Verma, K Ng, C deFilippi, W F Stewart, A
Perer. Clustervision: Visual Supervision of Unsupervised
Clustering // IEEE Transactions on Visualization and Computer Graphics, 2018,
10.1109/TVCG.2017.2745085
