Optical diagnostics methods largely
determine the level of experimental research in modern hydro and gas dynamics.
The choice of convective flows as an object of optical diagnostics is explained
by the special importance of convection in geodynamics, atmospheric and ocean
physics, in hydrodynamic and thermophysical processes with phase transitions
[1, 2]. Interest in these problems has escalated recently due to the
intensification of cyclic processes of melting and ice formation in the Arctic
and Antarctic regions, which have a huge impact on the world's oceans and
climate. Experimental and theoretical studies of convective processes and of
the dynamics of the water - ice phase transition, which take into account the
anomaly of water density in the region of 0 ÷ 4 ° C, are necessary for
numerous technical and technological applications [3]. The study of the
dynamics of phase transitions in a supercooled liquid and the evolution of convective
structures in a water-ice system requires the use of non-perturbing diagnostic
methods based on modern advances in optics, laser technology and information
technology. The present work is motivated by the need for such research.
A simplified diagram of a research complex
containing an optical diagnostics system and an experimental stand is shown in
Figure 1.
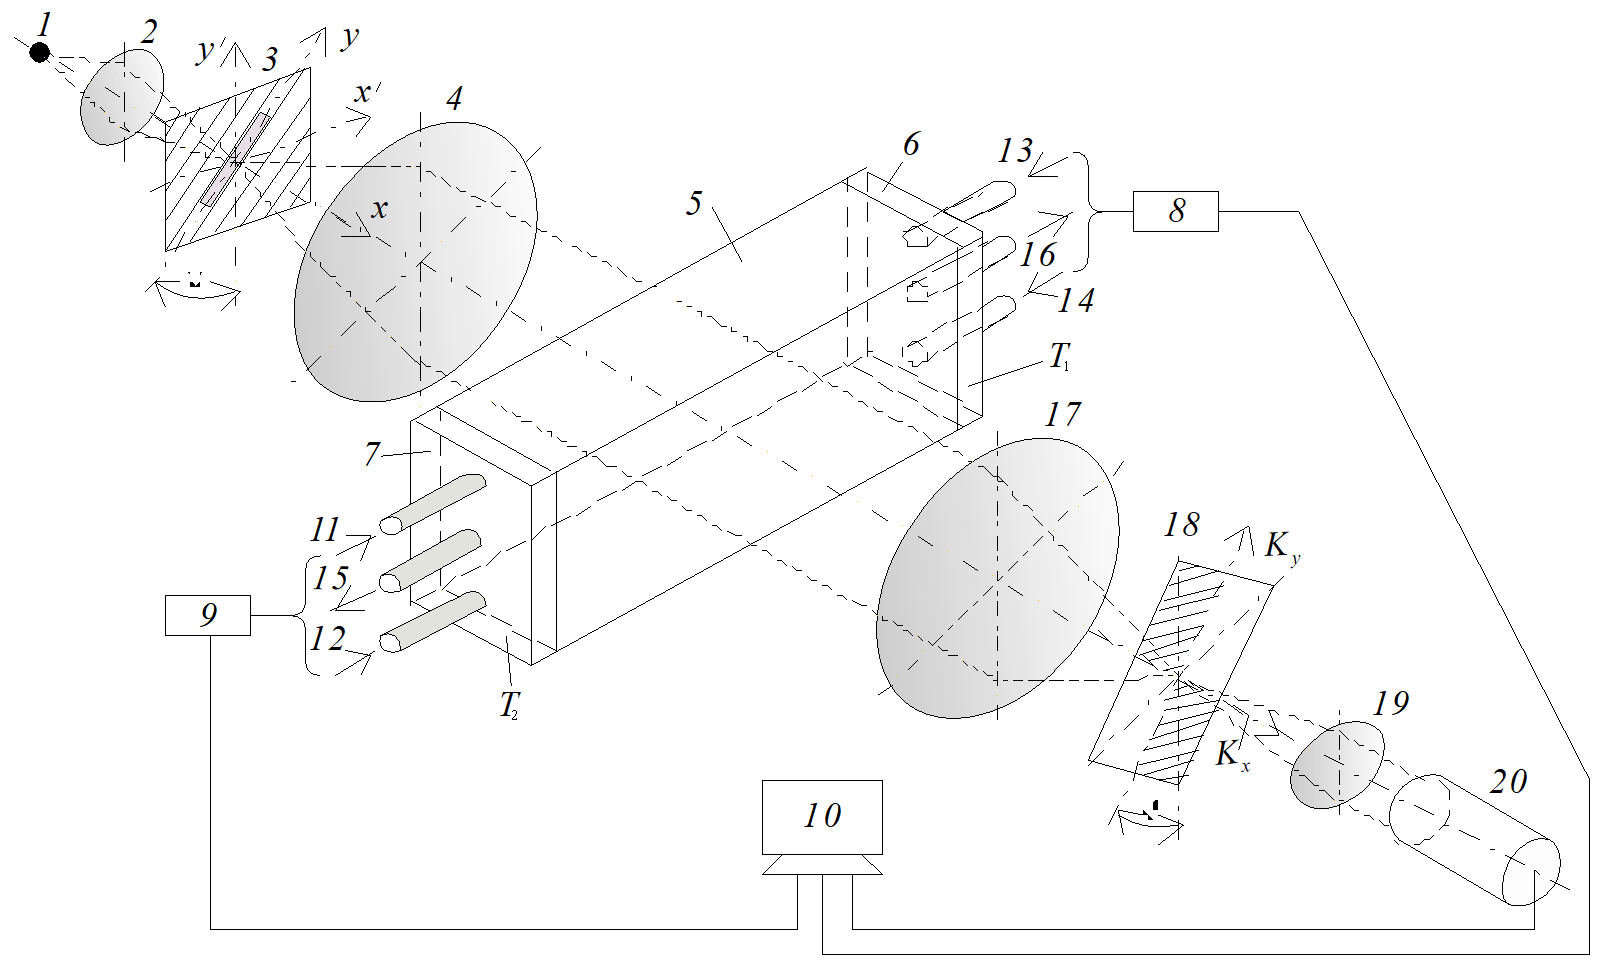
Fig.
1. Scheme of the experimental setup.

Fig.
2. The rectangular cavity with water. Optical tubes that feed the refrigerant
to the heat transfer side plates are visible.
The diagram contains a lighting module
consisting of a light source 1 (DRSh - 250 mercury lamp), a condenser
lens 2 and a slit diaphragm 3 placed in the front focal plane of
the lens 4, which forms a probing field in the test medium. Here water
is used as the medium and it fills up the rectangular cavity 5 with
transparent glasses of optical quality (Fig. 2). The internal dimensions of the
cavity are 136 × 86 × 30 mm, the side walls are formed by
high-quality cooled flat parallel copper plates 6 and 7. The
temperature of one of the plates (T1) is controlled and
maintained by a thermostat within up to -28°C. The temperature of the other
plate (T2) is in the range from room temperature to ~ 8.0°C.
Inside the plates there are cavities into which coolant is supplied from
thermostats 8 and 9. Thermostats are controlled by computer 10
according to a given program. The tubes supplying the refrigerant to the heat
exchange side plates are designated as 11-14, the outflow tubes
are 15, 16. The arrangement of the feed tubes and outflow tubes may vary
according to the conditions of the experiment. The distance between the tubes
is 80 mm. The lens 17 forms in the frequency plane the Fourier spectrum
of the probing light field perturbed by the medium under study. The quadrant
Hilbert filter 18 is placed in the Fourier plane of the lens 17.
The frequency axis Kõ of the Hilbert
filter is orthogonal to the direction of the image of the slit diaphragm of the
light source (ψ=45°). The lens 19 performs the inverse
Fourier transform of the Hilbert spectrum of the optical signal. The visualized
phase structure of the light field, perturbed by the medium under study, is
recorded by the digital video camera 20 connected to the computer 16. The
optical diagnostics system was implemented on the basis of the serial IAB-463M
shadow device [3], in which the following modules were modified: the light
source module, the Fourier filtering module of the optical signal and the image
recording module of the phase perturbations of the light field induced by the
medium under study. The probing field, formed by the lens 4, passes through the
test medium (water), in which the boundary conditions for temperature (T1
and T2, T1 <T2) are
set according to a given program by lateral thermostatted surfaces 6 and
7. In the space between the thermostatted surfaces, convective
structures arise, which appear as perturbations of the fields of optical phase
density. These structures are induced by Rayleigh-Benard convection and
complicated by the presence of a phase transition and an anomaly in the density
of water in the temperature range of 0÷4°C.
Near the lateral temperature-controlled
surface, as the temperature gradient grows, water turns into a supercooled
liquid, passing into a state of unstable equilibrium. In such a medium, the
transition from liquid phase to solid-crystalline state occurs. This is a phase
transition of the first kind. It becomes apparent through the appearance of a
crystallization wave and is accompanied by an energy release. In its turn the
release affects the dynamic distribution of the optical phase density gradient
in supercooled water and induces phase perturbations in the probing light
field, the Fourier spectrum of which  forms in the frequency plane of the lens 17.
The coherent transfer function of the
spatial-frequency filter 18 that performs the one-dimensional Hilbert transform
is described by the following expression:

+

(1)
where  and
and  are spatial frequencies;
  and
and  are Heaviside functions;
  is the phase shift defined by the corresponding quadrant of the
spatial-frequency filter. A filter with a coherent transfer function (1)
performs a one-dimensional Foucault-Hilbert transform.
In the Fourier plane  the spatial frequency axis
  is orthogonal to the image of the slot light source. Fourier
spectrum of the light field directly after the filter:


(2)
Here  is the spatial-frequency Fourier spectrum of the light field
perturbed by the medium under study;
  is the Fourier spectrum of the light field subjected to a
one-dimensional Hilbert transform along the axis
  . The phase shift
  is a function of the wave length
 of the probing light field:
  . When the wavelength
  , satisfies the condition
  , the Fourier filter 18 performs a one-dimensional Hilbert
transform:

(3)
If the medium under study induces only
phase perturbations of the probe field, the Fourier spectrum of the disturbed
field is described by the expression

Filtered Fourier-spectrum of phase
perturbations:


(4)
where  is the Fourier-spectrum of phase perturbations corresponding to the
mth-order Hilbert-fringe. Here it is taken into account that the
Hilbert-transform has quasi-differentiating properties. Therefore, the Hilbert
image reflects the structure of the phase perturbation field gradients.
The camcorder lens 19 performs the
Fourier-transform of the filtered Fourier- spectrum of phase perturbations

(5)
The phase structures (4) visualized by
one-dimensional Hilbert transform are recorded by a camcorder photomatrix.
Image of a one-dimensional Hilbert image of phase perturbations

is analyzed in the coordinate system (õÕ, óÕ), rotated relative to the coordinate system (õ, ó) by a=45°:

(6)
Where  .
.
In case of a broadband source, a
one-dimensional Foucault-Hilbert transform is performed with a coherent
transfer function of the filter (1). The result of filtering is the
transformation of the phase perturbations field into an analytical signal,
which is a superposition of the filtered signal and its Hilbert-image. Hence,
the signal detected by the photomatrix is a superposition of phase perturbation
images and its Hilbert-forms. The recorded image is a structure consisting of
Hilbert-fringes, displaying the gradients of perturbations of the optical phase
density in the medium under study.
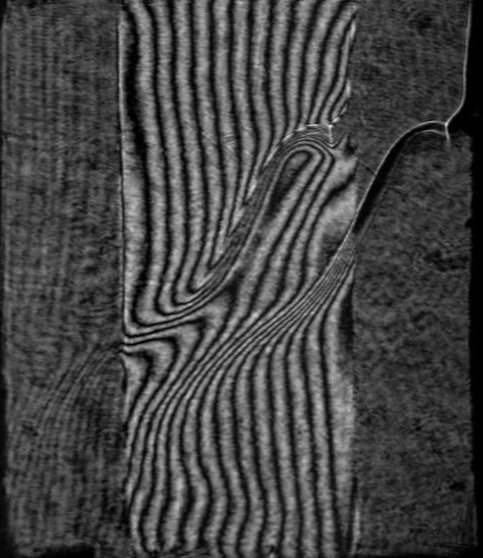
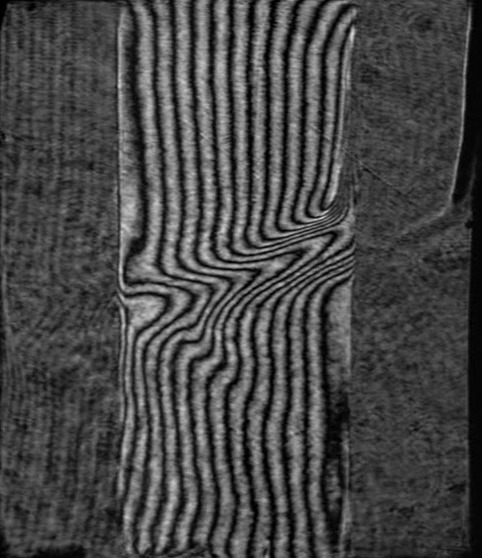
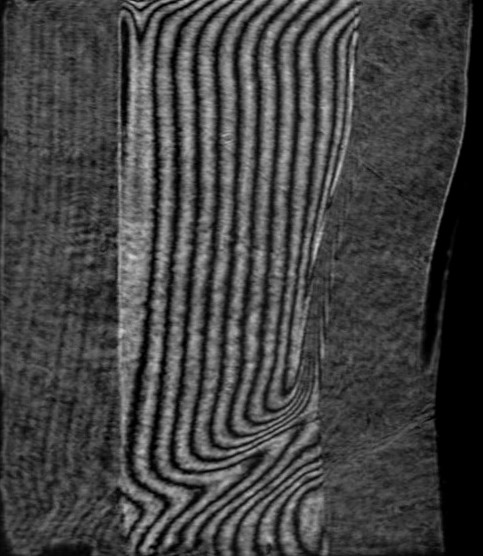
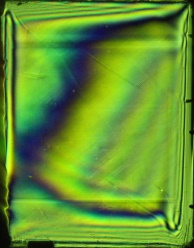
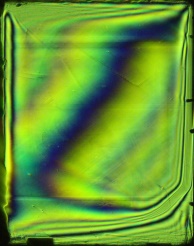
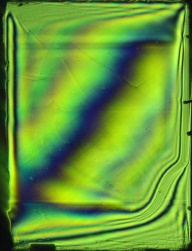
Figure 3 shows a selection of frames from a
video film which illustrates the Hilbert-visualization of convective structures
in a layer of fresh water bounded by vertical flat heat-transfer surfaces.
|
|
|
|
|
IMG-0503.jpg
|
IMG-0510.jpg
|
IMG-0518.jpg
|
Fig.
3. Video frames illustrating Hilbert-visualization of convective structures and
phase transition in water.
Figure 4 presents an example of convective
structures and a phase transition in the same layer, visualized by shear
interferometry. Hilbertrograms and shear interferograms display extremes of the
phase gradients and correspond to isotherms.
The usage for the approximation of
Bernstein polynomials allows you to build a grid that adapts to the
deformations of the interference lines. Figure 5 illustrates the approximation
of interference fringes by Bezier curves.
Fig.
4. Shear interferograms visualizing convective structures and phase transitions
in a vertical layer of fresh water.

Fig.
5. Approximation by Bezier curves of interference fringes on the shear
interferogram.
By approximating the interference and
Hilbert fringes by Bernshtein's polynomials, it is possible to build a uniform
grid over which two-dimensional spline interpolation is performed and the
temperature field is restored (Fig. 6, 7).
|

|

|
|
Fig.
6. The reconstructed temperature field using a shear interferogram (x - y
axis).
|
Fig.
7. Isotherms of the restored temperature field (x - y axis).
|
Figure 8 presents the results of numerical
modeling of the temperature-field isotherms induced by non-stationary
heat-exchange boundary conditions in the monotonic cooling mode of vertical
walls. As verification, reconstruction of shear interferograms and Hilbert
images from a numerical model of isotherms was performed.
Dimensions of the computational domain:
liquid layer thickness 84 mm., layer height 136 mm. The initial system
temperature is 20 degrees Celsius. The left wall cools linearly in time to 8°C within
2500 s, the right one to 0°C within the same time period. The upper and lower
horizontal borders of the cavity are 10 mm thick. Outer surfaces (Plexiglas) of
the horizontal walls are adiabatic. In Figure 8, the isotherm with T=4°C is
highlighted in red and with T=8°C in green.
|

|

|

|

|
|
t
= 236.12ñ
|
t
= 511.6ñ
|
t
= 838.22ñ
|
t
= 1223.9ñ
|
|

|

|

|

|
|
t
= 1680.37ñ
|
t
= 2219.51ñ
|
t
= 2853.1ñ
|
t
= 3604.73ñ
|
|

|

|

|

|
|
t = 4490.2ñ
|
t = 5536.96ñ
|
t = 6772.65ñ
|
t = 8370.4ñ
|
Fig.
8. Numerical simulation of the evolution of isotherms induced by unsteady
boundary conditions in a vertical layer of water.
Convective heat transfer in fluid in a
two-dimensional formulation is described by a dimensionless system of Navier-Stokes
equations, energy and continuity in the Boussinesq approximation, written in
terms of temperature T , vorticity ω and stream
function ψ:


(7)


Conductive heat transfer in massive (Plexiglas)
horizontal walls is described by the heat equation:

(8)
Designations in equations (7) and (8): νf - kinematic viscosity of fluid,
m2/s; λf - thermal conductivity of fluid, W/m•K; λw - thermal conductivity of
horizontal walls material, W/m•K; ρf - density of
fluid, kg/m3; ρw - density of horizontal
walls, kg/m3; ñpf - specific heat of fluid, J/kg•K; ñw - specific heat of
horizontal walls material, J/kg•K; g - gravitational
acceleration, m/s2; βf - thermal expansion coefficient of fluid, K-1; H
- height of fluid layer, m; Pr - Prandtl number; Gr - Grashof
number; x, y - dimensionless Cartesian coordinates; T - dimensionless temperature; ω - dimensionless vorticity; ψ
- dimensionless stream function; u, v - dimensionless velocity
components: horizontal and vertical.
The problems are solved numerically by the
finite element method in conjugate formulation. In solving the motion equation,
the dependences of the density and coefficient of volume thermal expansion on
temperature are considered. To calculate the constant parameters, we used fixed
values of the thermophysical properties of water at 0°C and of Plexiglas. Water
properties: density ρf = 999.839 kg/m3;
coefficient of kinematic viscosity νf = 1.793∙10-6
m2/s; coefficient of thermal conductivity λf
= 0.554 W/(m•K); specific heat ñpf = 4218 J/(kg•K); crystallization
heat R = 333.7 kJ/kg. Properties of Plexiglas wall: ρf
= 1180 kg/m3; λw = 0,195 W/(m•K); ñw =
1270 J/(kg•K).
At the solid boundaries in the system, the
no-slip condition is set for the velocity (and, as a consequence, for the
stream function). The boundary condition for the vortex is obtained from the
field of the stream function using the method of conjugate resultants [4]. At
the boundaries of the liquid with solid walls, the condition of continuity of
temperature and heat flux is set. A non-uniform triangular grid, condensed to
varying degrees to all borders of the computational domain, with the number of
nodes ≈4*104, was used. Linear basis functions have been defined on
elements. To build a triangulation, a cellular step-by-step algorithm using the
maximum angle was used [5].
The program implements an iterative process,
in which, if necessary, the desired values of variables from the previous steps
and the calculated values of the coefficients from the parameters were
substituted. The temperature field was calculated first, and then the vortex
and stream function fields. In an iterative process inside the time step, the
relaxation method was used. The finite-element system of linear algebraic
equations was solved by the iterative method of the local-optimal scheme (LOS)
with incomplete decomposition into lower and upper triangular matrices (LU) [4].
Hilbertograms and shear interferograms
synthesized from numerical models of isotherms related to time points: a)
- 122 s; b) - 305 s; c) - 710 s after turning on the thermostats
that control the temperature of the heat exchange surfaces, are presented in
Figure 9.
Fig.
9. Examples of numerically modeled fields of isotherms (a, b, c), reconstructed
from these fields of gilbertograms and shear interferograms (red line-isotherm
+ 4 ° ‘).
The isotherm corresponding to the inversion
of water density (+4°‘) is highlighted in red. It
divides the space into two areas. Above the isotherm (+4°C), a vortex motion of
convective structures occurs and is directed clockwise. Under this isotherm,
the vortex motion of convective structures occurs counterclockwise. The
conjugate vortices formed above and below the isotherm (+4°C) transfer the warm
water downwards, and the cooled water upwards.
Figure 10 shows the interferogram
corresponding to this convective structure: a) - experimentally
obtained; b) - numerical model.
|

a
|

b
|
Fig.
10. Shift interferograms: a - experimental; b - numerical model.
|

a
|

b
|
Fig.
11. Hilbertograms: a - experimental; b - numerical model.
Figure 11 shows: a - the
experimentally obtained gilbertograms; b - the gilbertograms synthesized
from the structure of numerically simulated isotherms. The Hilbert bands
corresponding to extremums of isotherm gradients are clearly visible. Figures
9-11 illustrate the qualitative adequacy of the results of numerical simulation
and experiment.
The study of convective currents induced by
non-stationary boundary conditions and their influence on the structure and
dynamics of the phase transition are relevant for the development of crystal
growing technologies [6], understanding the anomalies of formation and melting
ice in the Arctic and in the Antarctic regions. Studies to date have been
performed only with a narrow range of parameters and so far have no systemic
nature. Solutions of gallium, cadmium-mercury-tellurium and some other
substances and materials have similar dependences between the density and temperature.
Therefore, water can be used as a melt simulator fluid for testing
single-crystal production technologies. The scope of application of the results
obtained by methods of optical diagnostics and numerical modeling adapted to
this problem is not limited to currents of a convective nature. It can be
extended to solving fundamental and applied problems in experimental hydro and
gas dynamics, thermal physics, biology, and medicine.
This work was carried out with the partial
support of the Russian Foundation for Basic Research (18-38-00790 mol. a).
1. A. J. Smits, N. N. Lim. Flow Visualization. Imperial
College Press. 2010.
2. Lappa M. Thermal Collection: Patterns, Evolution and
Stability. Chichester: John Willey Sons. 2010.
3. V. A. Arbuzov, E. V. Arbuzov, Yu. N. Dubnishchev, V. S. Berdnikov,
O. S. Melekhina. Dynamics of the crystallization front induced by the
temperature gradient at the upper boundary of a horizontal layer of a a fluid.
Optoelectronics, Instrumentation and Data Processing. 2017, Volume 53, Issue 2,
pp 131-135.
4. Yu. G. Soloveychik, M. E. Royak, M. G. Persova. The
finite element method for solving scalar and vector problems. Novosibirsk:
NSTU, 2007. 896 p.[in Russian].
5. A. V. Skvortsov. Delaunay triangulation and its
application. Tomsk: TSU, 2002. 128 p. [in Russian].
6. V. S. Berdnikov, V. A. Vinokurov, V. V. Vinokurov. Effect
of nonstationary regimes of the natural and mixed convection of melts on heat
transfer and the forms of crystallization fronts in the Czochralski method.
Bulletin of the Russian Academy of Sciences: Physics 2017, Volume 81, Issue 10,
pp 1257-1264.


