Modern engineering design and development mostly
leads to the process of choosing the best suitable configuration among all
possible variants of the required device. A number of variable parameters of
the device or mechanism are defined with corresponding limitations for each
parameter. Then, criteria of the best device selection are defined. Thus, a
multicriteria optimization task is stated.
Multicriteria optimization is a process of
simultaneous optimization of two or more conflicting objective functions C on
given domain of definition T. Finding the optimal solution means finding one or
multiple set of parameters P in their limitations so the corresponding set of
criteria is acceptable for the problem originator.
Solution algorithm of multicriteria
optimization task with one objective function is presented in [1]. Several
existent approaches of solving the multicriteria optimization tasks are
considered in [2] and [3], which represent the evolution of American and French
schools of visual analysis. Appearance of multiple sets of analyzable data
caused by solving the task is similar in those approaches. The difference is,
on the other hand, in the process of the obtained data analysis: the
preconditions and the results are not the same.
All mentioned papers use visualization
heavily. Studied in those works programs generate images, which help analyst in
the process of problems solving. Those images can be used either in
illustrative purposes or, being in an intermediate state of research, to
clarify the following steps in the data analysis process. By that,
visualization naturally integrated into the multicriteria task solving concept.
Visual analytics paradigm, stated by James
Thomas, calls visual analysis a way of solving the data analysis tasks using
the supporting interactive interface. It is to join human imagination and enormous
processing power of modern computers. While a highly computational modeling job
is being processed by a computer, the analyst always has feedback through an
image on a computer display. The implementation of visualization method is
given in [4]. It consists of visualization pipeline, which is an interactive
and iterative image rendering algorithm, and an analysis process of the resulting
image.
This article describes the development of
visual multidimensional data analysis tool. The concluding parts of the work
contain detailed capabilities of designed tool and examples of its applications
to multicriteria optimization tasks solving process. This tool also allows
applying visual analysis to given data. Then it will become a part of a
software package, designed to solve multicriteria optimization tasks.
Development of this package is a big project of Institute of Cyber Intelligence
Systems, NRNU MEPhI. Visual analysis tool is being developed by “Scientific
Visualization” laboratory, NRNU MEPhI.
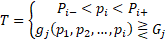
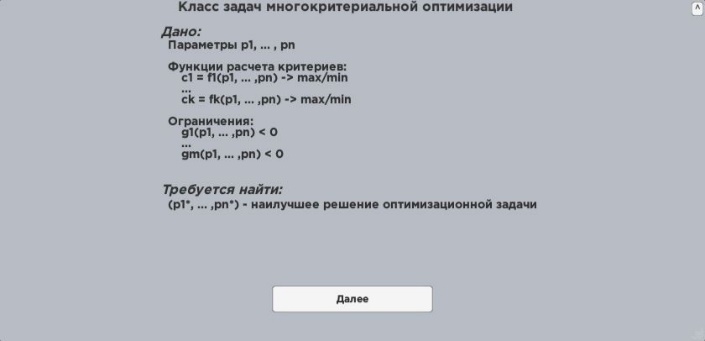
Multicriteria
optimization task solving includes multidimensional data analysis. General view
of this task is as follows:
Given:
 – q real variables on
given domain of definition.
– q real variables on
given domain of definition.
 – m procedurally stated
objective functions:
– m procedurally stated
objective functions:
 , where z ∈ [1 .. m].
 – k procedurally stated
functions, setting additional limitations on domain of definition T.
– k procedurally stated
functions, setting additional limitations on domain of definition T.
 ,
,
where  ,
, – real numbers, i ∈ [1 .. n], j ∈ [1 .. k].
Formulate:
Judgment about functions C joint behavior
on domain of definition T.
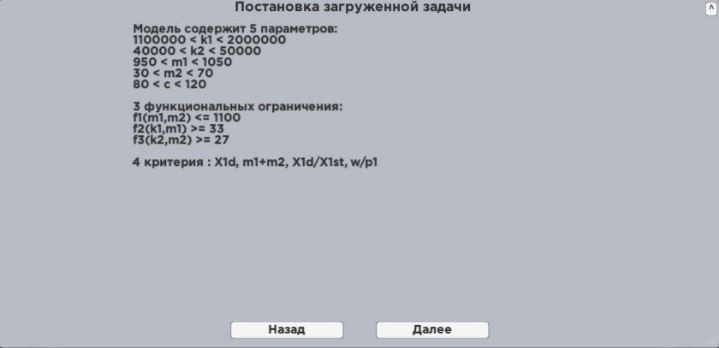
This article is about one particular
multicriteria optimization task, expanded in [5]. This task comes to data
analysis task with q = 5, k = 3, m = 4 and is stated
below:
Twomass dynamic model, see fig. 1,
contains: masses M1 and M2, rigidity K1 and K2,
shock absorption C. Thus, 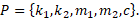 The harmonic force
  is
applied to M1, Р=2000 N; w=30 (sec-1).
is
applied to M1, Р=2000 N; w=30 (sec-1).
Figure
1. Dynamic model.
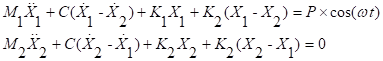
Movement equations are as follows:
Five variable parameters are:
p1 = К1,
p2 = К2, p3 = М1, p4 = М4, p5 = С
with variation boundaries, forming
parallelepiped П,
1.1×10⁶ ≤ p1 ≤ 2.0×10⁶ (Н/м);
4.0×10⁴ ≤ p2 ≤ 5.0×10⁴ (Н/м);
950 ≤ p3 ≤ 1050 (кг);
30 ≤ p4 ≤ 70 (кг);
80 ≤ p5 ≤ 120 (Н×с/м).
Three functional constraints (on mass sum
and partial frequencies):
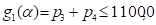 (kg);
(kg);
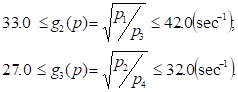
Superior limitation on  and
and  are flexible and can vary in some
limits. Domain of definition T is formed by joining parallelepiped П and
functional constraints G.
are flexible and can vary in some
limits. Domain of definition T is formed by joining parallelepiped П and
functional constraints G.
Optimization was conducted by four quality
criteria:
C1 = Х1∂ (mm) – first mass oscillation amplitude, minimized,
C2 = М1 + М2 (kg) – specific
quantity of metal in the system, maximized,
C3 = Х1∂ /Х1st and
C4 =w/g2 (non-dimensional quantities) – dynamic
characteristics of the system, where Х1st – static deviation of mass М1 under force Р action, both minimized.
Formulate:
Judgment about quality criteria joint
behavior on the domain of definition.
The visualization method was chosen for
solving the considering task. Main idea of visualization method is using the
visualization tools bring together the source data and the corresponding static
or dynamic graphic interpretation. Obtaining this graphic interpretation, one
can make decisions about the source data. Therefore, the method the method is
made out of two sequential solutions of tasks. They are a pure visualization
and the task of image analysis and interpretation.
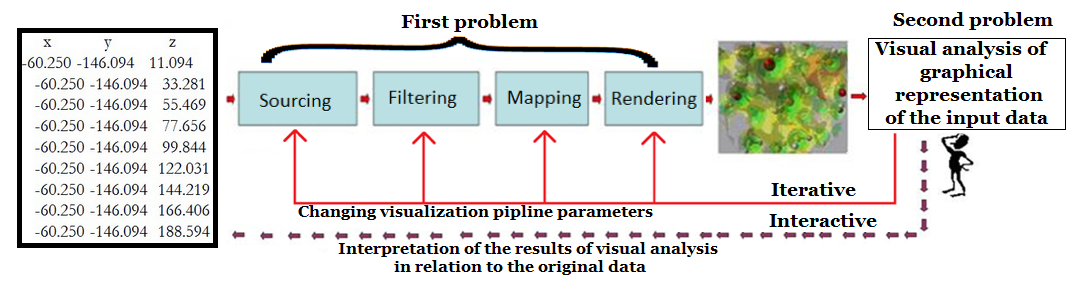
Figure
2. Data analysis
task solving using the visualization method.
Algorithm of obtaining graphic images from
the analyzed data consists of the following steps:
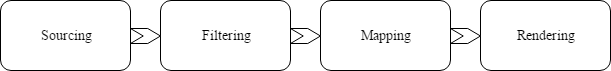
Figure
3. Visualization
pipeline.
Together those steps, performed one after
another, are called visualization pipeline.
Sourcing is the process of obtaining source
data of the visualization pipeline. The source data can be obtained in a
variety of ways, such as statistical processing or analytical function
assignment.
Filtering is an operation of preprocessing
the source data. Filtered data is used in the future steps of pipeline. For
example, it could include interpolation and smoothing of the source data. This
process is optional.
The spatial scene is built by the filtered data;
this process includes describing the geometric model of the scene and its
optical specifications. Geometric model of scene consists of geometric
primitives and complex geometric objects.
Rendering is a process of generating
graphic representations of the obtained scene. 3D rendering has a number of
settings:
1.
Camera
2.
Light sources
3. Environment of spatial scene
The visualization process cannot be formalized
strictly. Some of the scene analysis problems, solved in the process of
analysis by human, are: analysis of spatial object’s shapes, analysis of their
mutual arrangement, and analysis of their optical properties. When obtaining
unsatisfactory results, the whole visualization pipeline or its parts are rerun.
As the result, the analysis task becomes more complicated, iterative and
interactive.
The data analysis visualization method
consists of two tasks, executed consequently. The first is data visualization
and its visual analysis. Then, the results are interpreted towards the source
data. The designed algorithm of visualization pipeline is given below.
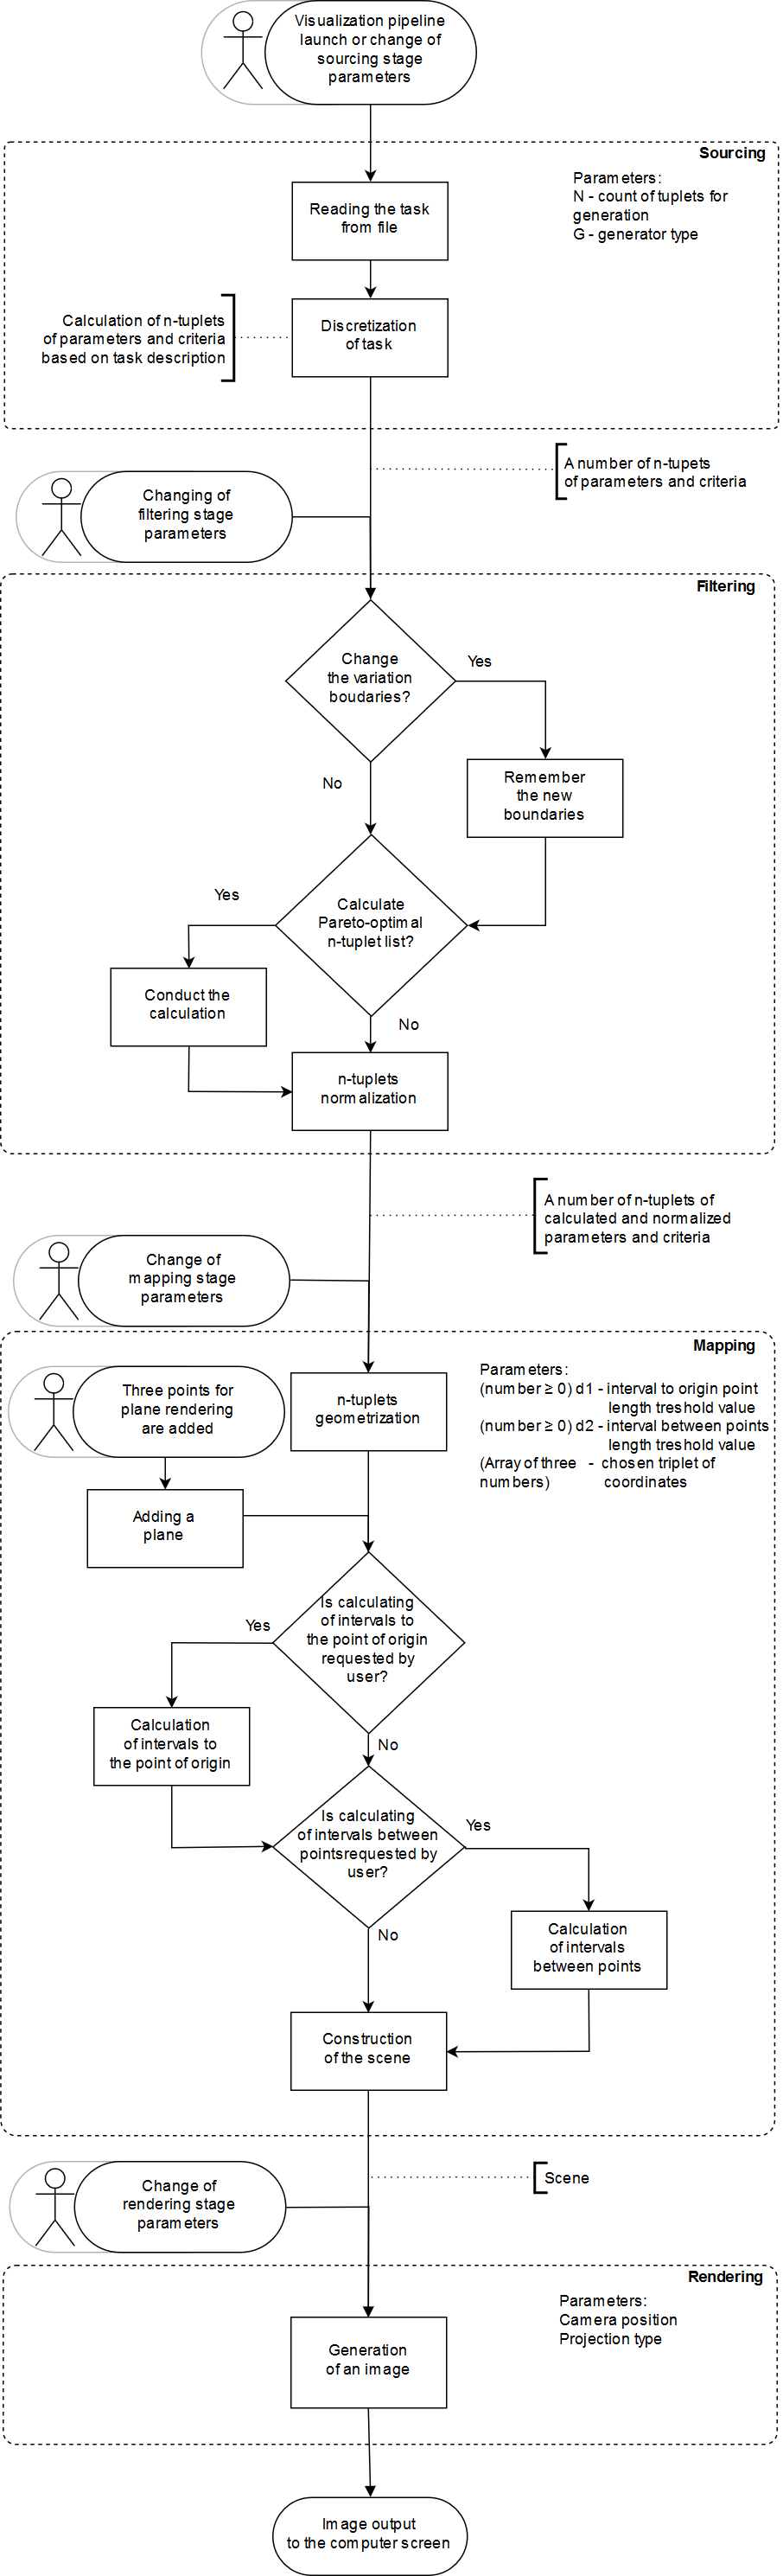
Figure
4. Algorithm scheme.
The visualization pipeline has four steps:
Sourcing, Filtering, Mapping and Rendering. All of them are iterative and
interactive, which means it’s possible to start the pipeline again from any
step. Entry points are marked as a sketchy man icon. Thus, once the image has
been obtained, one can restart the pipeline from the Mapping stage using other
parameters.
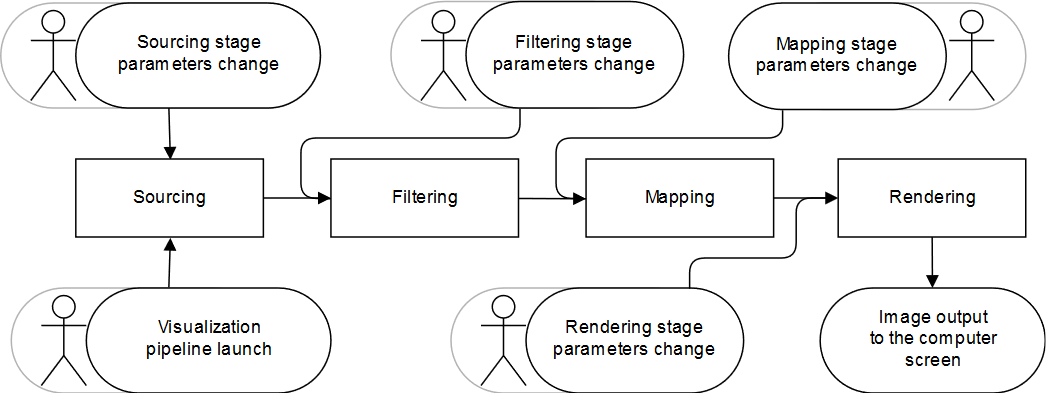
Figure
5. Visualization pipeline scheme.
Source data is obtained on this step.
Sourcing can be controlled; one can interactively change the input data. He/she
can:
- change the boundaries of the parallelepiped П;
- choose the method of generation for values of
parameters, there are two options: pseudo-random number sampling a uniform
distribution and Sobol sequences;
- set the amount of data for computations.
The sourcing stage consists of two parts.
First part is loading the problem from a .lua script file with a known
structure. Once loaded, the procedurally stated calculation functions inside
this file are discretized. It allows obtaining an n-tuplet, an ordered set of n
real values of function with corresponding variables.
Digitalization
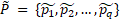
The user states N – a required number of
n-tuplets, which are then generated. Thus, a sequence number is assigned to
every n-tuplet,  =
=  . As every n- tuplet is an ordered set of numbers, the variable
value will be
. As every n- tuplet is an ordered set of numbers, the variable
value will be  , with corresponding objective function values
  , where
  and
and  . This way, the value of any variable or objective function is
uniquely determined for every n- tuplet.
. This way, the value of any variable or objective function is
uniquely determined for every n- tuplet.
Two random generation method was
implemented. The theory for the Sobol sequences algorithm was proposed by [7].
Data,
obtained on previous step, is preprocessed on this stage. One can change the
domain of definition and start the set of Pareto-optimal objective function
values to be calculated. The data is normalized. Output of this step contains a
number of n-sets and normalized n-tuplet.
Filtering stage consists of three parts. In
the first one Gj are changed, thus changing the domain of definition. The
second one is calculation of the Pareto-optimal values (optional). The third
one is data normalization.
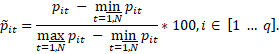
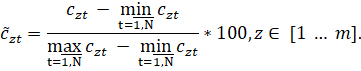
Normalization
To get a geometric model, obtained data is
linearly normalized, so the values of every variable and objective function are
contained in [0, 100].
First, the largest and the lowest values of
variables and objective functions are calculated from all n-tuplets. New
ordered sets of n real numbers of function and variable values are obtained for
each n-tuplet:
 , where the
  for each
  is calculated as follows:
 , where the
  for each
  is calculated as follows:
Completing this stage implies data geometrization
and building of a spatial scene. Ordered real n-tuplet are considered as points
in n-dimensional space. 3-dimentional subspace of initial n-dimentional space
is chosen, it will be used for creation of spatial scene. This approach was
introduced in [8].
Two entry points are present: first is on
the visualization pipeline initial launch or on control pass from Filtering
stage; second is activated when user marks plane points. Right after getting
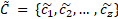
control, geometrization of data in question is implemented. Sets of normalized
parameters and criteria are presented as set of multidimensional spaces ℙ and ℭ. We name them parameter space and criteria space, respectfully.
Algorithm provides ability to enable
function of adding intervals between points in ℙ and ℭ spaces in pairs or to the point of origin, and adding planes.
The last block of this algorithm is
building the scene.
Obtained on Filtering stage sets of
normalized data are used to form 3-dimentional space {x, y, z} as
follows: triplet {a, b, c} is given by a, b, c ∈ [1 … q+m]; those numbers defines the space in the
way, so x =  ; y and z are
defined similarly.
; y and z are
defined similarly.
The multidimensional points are projected
on {x, y, z} as follows: set of triplets (xi, yi,
zi) is given by xi =  ; yi and zi
are defined similarly, i∈[1, N].
; yi and zi
are defined similarly, i∈[1, N].
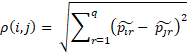
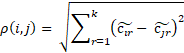
Using  and
and  obtained on Filtering stage, describe the following functions:
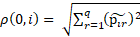
 – function of distance
calculation between points i and j,
– function of distance
calculation between points i and j, – function of
distance calculation between a point and the point of origin.
– function of
distance calculation between a point and the point of origin.
Those functions take values as follows:
All elements of {x, y, z} are contained in ℙ:
 ,
,  .
.
All elements of {x, y, z} are contained in ℭ:
 ,
, 
Otherwise, is not described.
First step of building the standard scene
is adding a set of lines, limiting the cube [0, 100], three cylinders to
describe axis X, Y and Z with corresponding text captions. Points are
complemented to spheres, intervals – to cylinders.
A sphere is a spatial object with the
following optical and geometrical parameters.
Geometrical parameters:
 ,
,
where pi – sphere center
coordinates,
r – radius, stated by the user, equals 1 by
default.
Optical parameters:
A cyllinder is a spatial object with the
following optical and geometrical parameters.
Geometrical parameters:
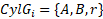 ,
,
where A и B - base
points of cyllined,
r – radius, stated by the user.
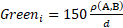
Optical parameters:
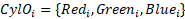
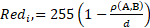 ,
, 
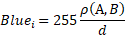
where d = d1 in case
of intervals connect points of ℙ or ℭ spaces with the point of origin,
d = d2
in case of intervals connect points of ℙ or ℭ spaces with each other.
A plane is a spatial object with the
following optical and geometrical parameters.
Geometrical parameters:
 ,
,
where A, B и С - points
for plane construction, stated by user.
Optical parameters:

The result of this stage consists of
geometrical and optical models of the scene. Those models are then used to
render a graphical representation of the scene on the next stage.
of geometrical and optical models of the
scene. Those models are then used to render a graphical representation
Rendering stage result is a graphical
representation of spatial scene, obtained on Mapping stage. The following
parameters of visualization process are given on this step: camera position,
positions of light sources, field of view, physical parameters of space. User
can change camera position and angle, choose between orthographic and
perspective projections.
The result of Mapping stage is a
geometrical and an optical models of the spatial scene. We came up with three
types of statements, which can be made in the process of spatial scene.
1)
A statement about difference between sphere
positions (values of criteria functions):
After marking several close to each other
in one subspace spheres with a color and then switching the subspace, one can
understand if this closeness remains in the other subspaces.
2)
A statement about difference between sphere
position and the point of origin:
•
An analyst can make decisions about sphere
closeness to the point of origin in the chosen subspace. Changing the subspace,
one can make similar decisions in the n-dimensional space. In the stated in the
section 1 multidimensional task point of origin is considered as an ideal
point.
•
Changing the d1 threshold
value, which influences creation of cylinders between the point of origin and
spheres, one can make decisions about closeness of spheres to zero. The degree
of how close spheres are to the point of origin can be evaluated by the color
of cylinders. Blue color means the length of the cylinder is close to the
threshold, while red – far from the threshold. Cylinder absence means the
distance between points is more, than threshold.
3)
A statement about spheres clusters:
•
Changing the d2 threshold
value, which influences creation of cylinders between the points, one can make
decisions about closeness of the n-tuplets between each other. Color
orientation can be of use in this case, like in the previous one.
•
Marking several spheres with color provides to
the analyst an ability to make judgements about spheres, which form a cluster
in criteria space, while working with criteria space.
The development of interactive visual
analysis program modules consists of four parts: designing the process of
storing and processing obtained multidimensional data, designing the process of
obtaining visual representation of data in question, designing the user
interface. Visual Analytics Tool has been developed to implement this
algorithm. Programming environment is Unity, using scripts on C# and UnityScript,
and Lua for problem definition.
The development methodology is iterative.
The development team has managed to perform three iterations during the process
of making this article. Also, Gitlab repository manager was used during the
development process. It provides abilities to not only exchange source code in
a fast and handy way, but also helps tracking current tasks, automatic project
building and storing current and previous build artifacts.
After program launch, user can see the
problem definition, choose the file with task, and proceed to the data
generation. The window which a user interact with has three sections. He uses
the first one to set discretization parameters and to make a decision about
highlining the spheres which correspond to Pareto-optimal solutions. The second
one allows to change limits of inequality that describe function limitations Г.
In the third one a user can see generated data in a table.
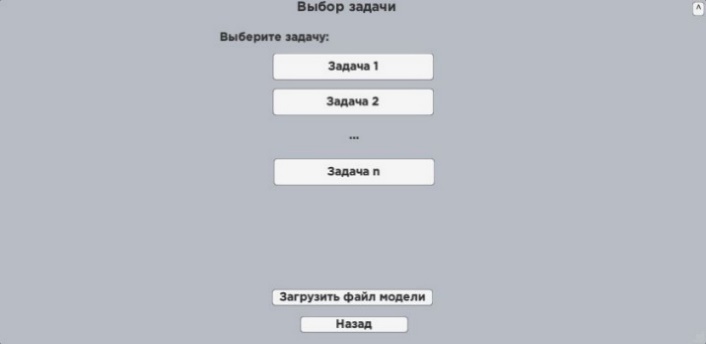

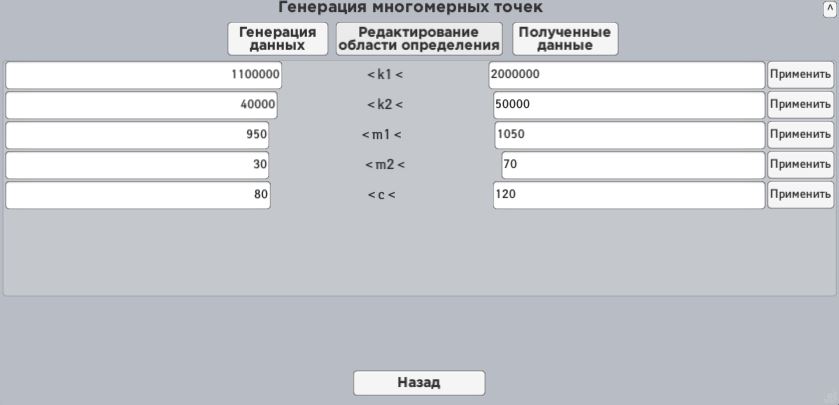
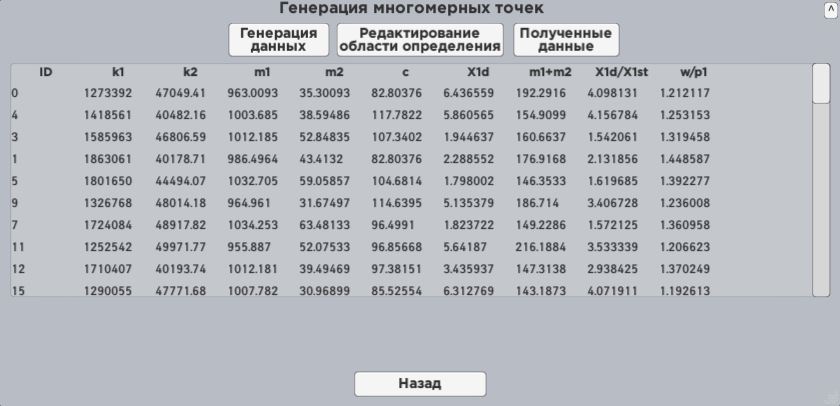
Figure
6. Windows of the program.
The scene is controlled with several
windows, capable of changing d1 и d2 limitations, sphere radiuses, camera projection,
also capable of sphere selection and adding limiting planes to the scene. Those
panels can be minimized.
The program is capable of generating the specified
amount of data, visualizing that data and timely reacts to user actions. The
process of testing included generation of 100’000 points. During testing, the
calculation process never took more than 60 seconds.
Let us note that the design of the user
interface allows an analyst to conveniently manipulate with data. He is able
to not only change the {x, y, z} subspace, to add the cylinders on scene, but
also to move camera and to switch its projections. We should highlight the
analyst also has an opportunity to see the generated data in a table.
Let us condust the visual analysis of the
spatial scene, described in section 3.2.
A cloud of spheres is marked in the
parameter’s space:
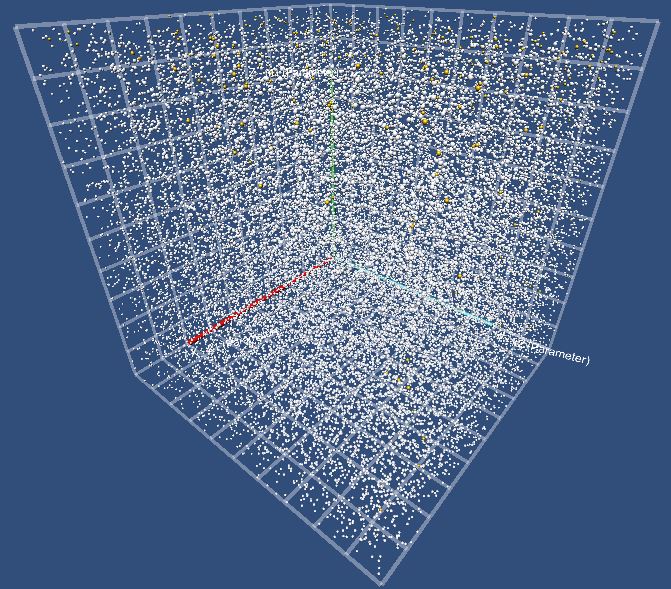
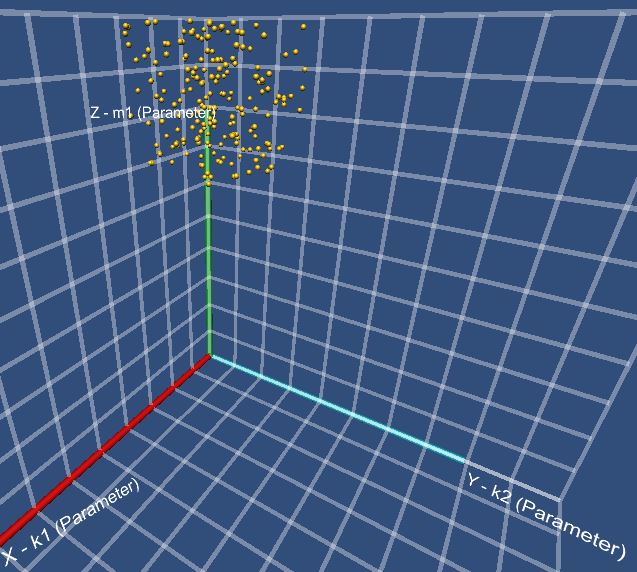
Figure
7. Spheres cloud
Next ranges of values are considered:
1.1×10⁶ ≤
К1 ≤ 1.37×10⁶;
4.0×10⁴ ≤
К2 ≤ 4.3×10⁴;
1020 ≤
М1 ≤ 1050;
30 ≤
М2 ≤ 58;
80 ≤
С ≤ 120.
The parameters space is changed to criteria
one. The threshold value is assigned and then the spheres from the cloud are
grouped by the cylinders. That is to say, the clusters are build up.
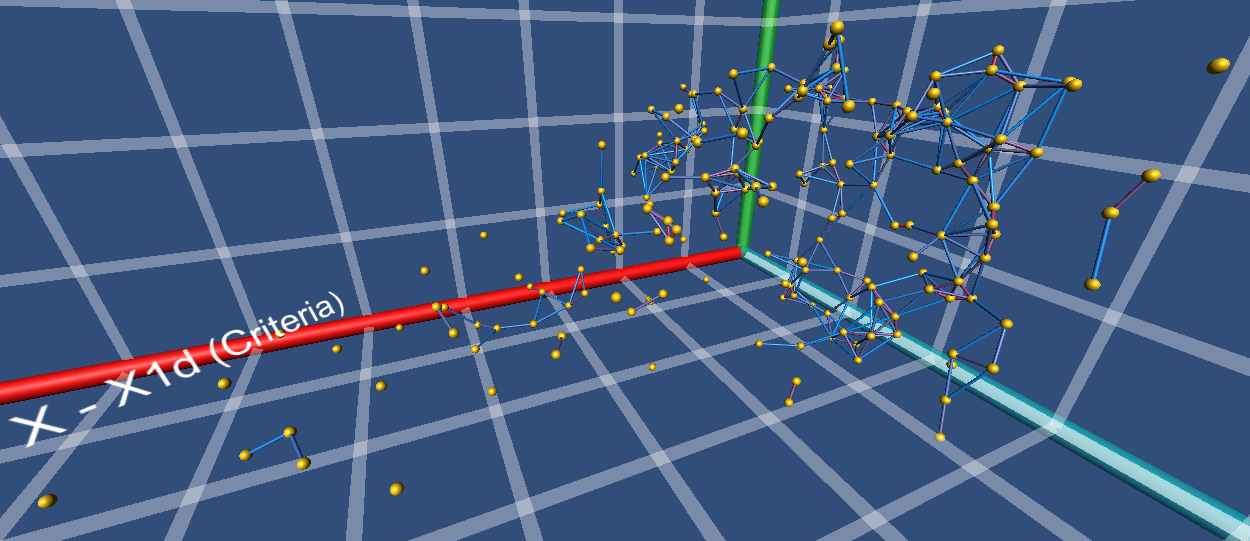
Figure
8. Clusters in the criteria space
The subspace which is formed by the
objective functions  , according to an abscissa, ordinate and applicate axis is changed
by replacing the objective function
, according to an abscissa, ordinate and applicate axis is changed
by replacing the objective function  to
to  .
.
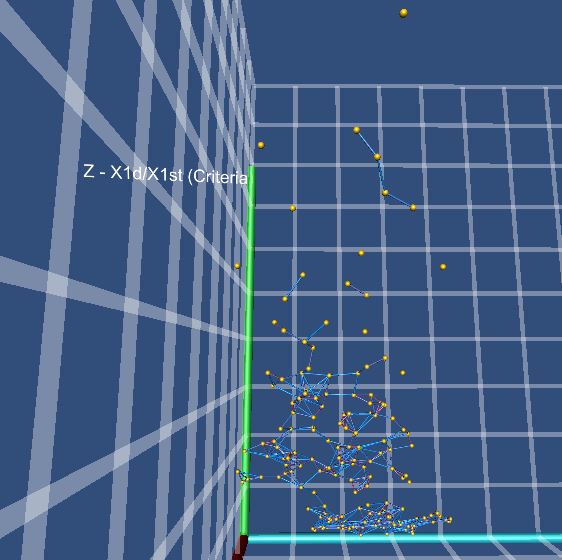
Figure
9. Clusters in the changed subspace
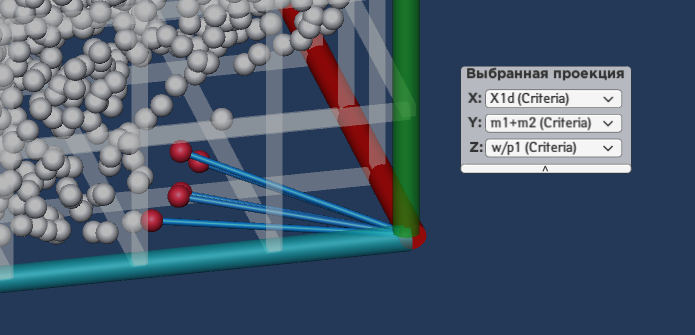
Let us make a type 3 statement (about
sphere clusters) from figure 10. One can observe two pair of spheres, which
have the same distance between them in the 3d-space, have different colored
cylinders. That is attributable to difference between the other criteria.
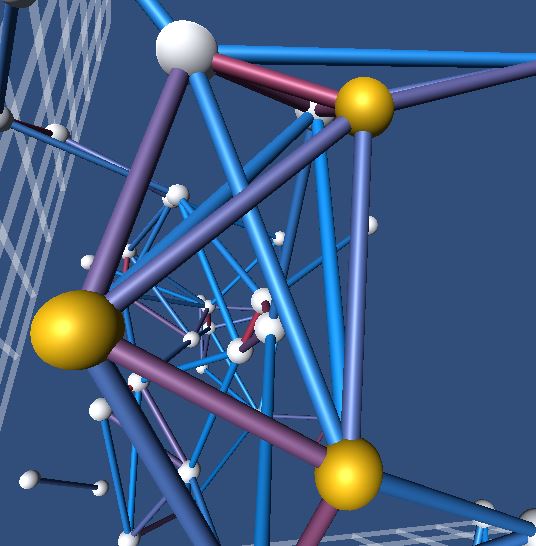
Figure
10. A pair-wise comparison of distance between the spheres
The cluster of spheres which are close to
each other is formed by the cloud in the parameters space, while the same
spheres are separate in the criteria space. Thus, it may be concluded that a slight
change in the parameter’s space leads to considerable change in the criteria space.
Let us make a statement
type 2 statement (about difference between the objective functions values and
zero. A signification of the statement is argued by the minimization task. The
smallest objective functions values are marked by user during the visual
analysis.
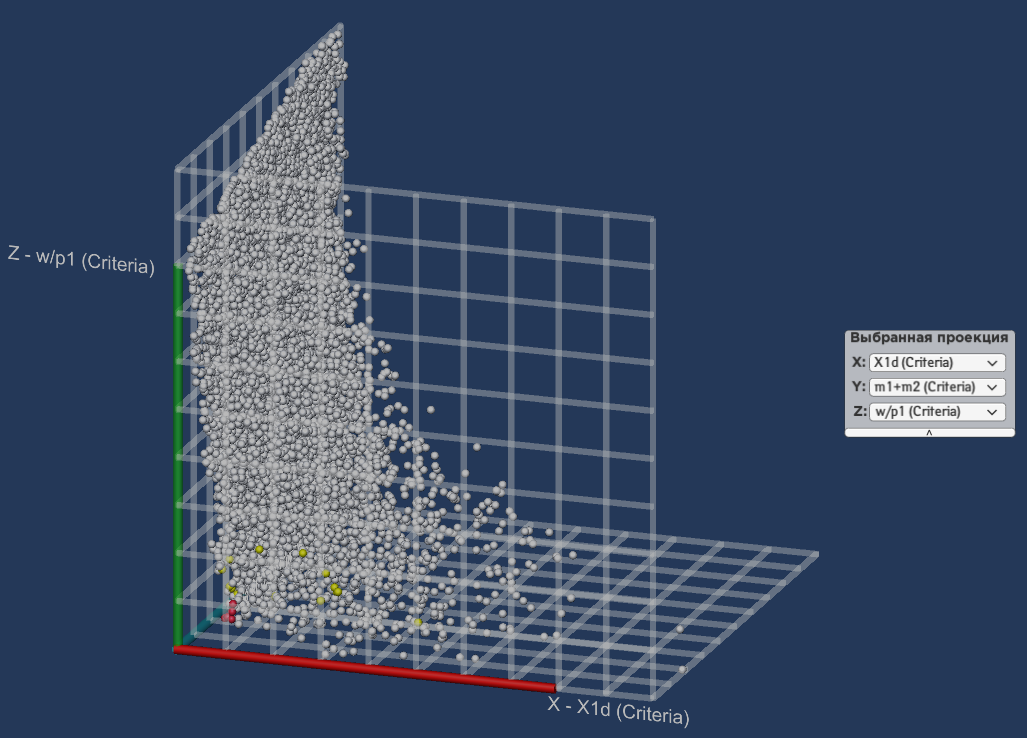
Due to a figure 11:
1.
The function values of  are close to zero - the large cluster is formed by the spheres near
OYZ plane.
are close to zero - the large cluster is formed by the spheres near
OYZ plane.
2. The functions values of  distributed over the entire domain of definition. The objective
function values are far from zero, the spheres are distributed across the
entire scene in a cross projection.
distributed over the entire domain of definition. The objective
function values are far from zero, the spheres are distributed across the
entire scene in a cross projection.
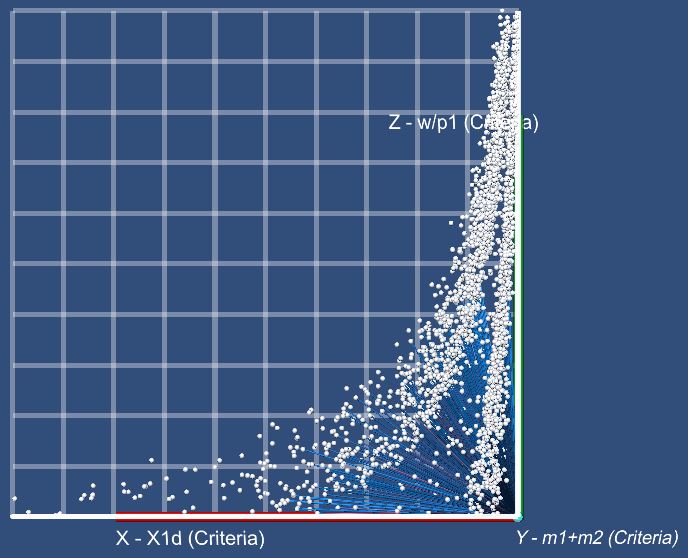
a) b)
c) d)
Figure
11. Scene which consists of spheres and cylinders:
a
– frontal projection; b – cross projection;
c
– floor projection; d – projection picture
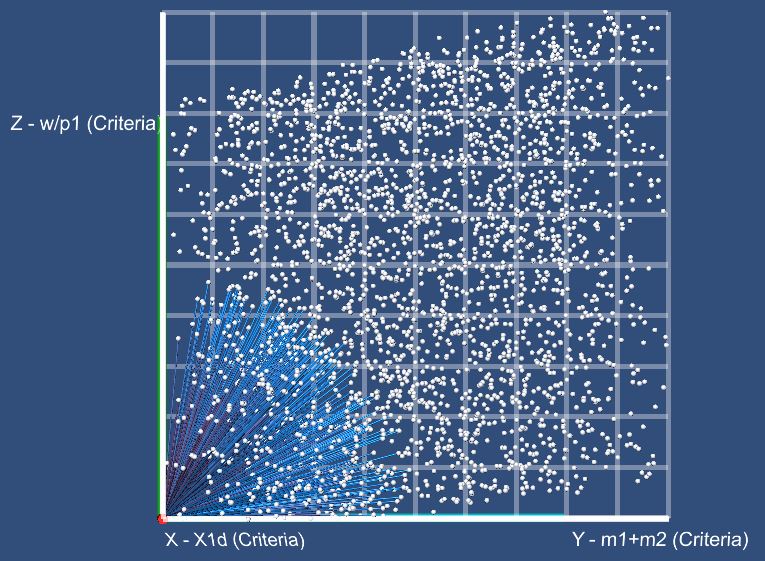
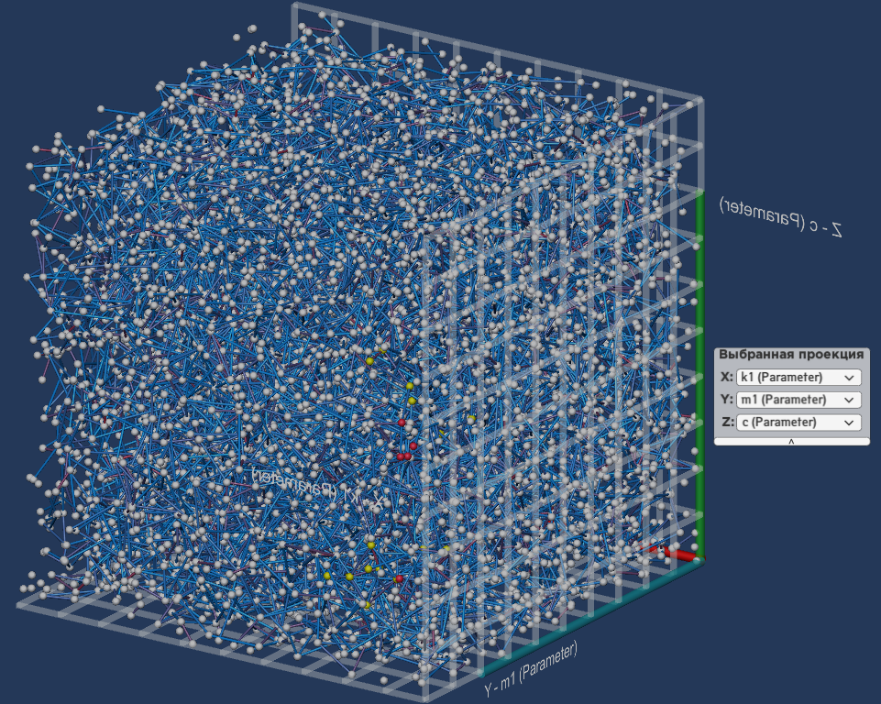
Let us make a type 1 statement (about
difference between sphere positions). The cloud of points is formed by the
objective functions’ values and  . A cloud boundary reminds of the shape of a hyperbolic curve. Thus,
these functions might have a hyperbolic functional connection.
. A cloud boundary reminds of the shape of a hyperbolic curve. Thus,
these functions might have a hyperbolic functional connection.
Functions  do not have an explicit
functional connection. The spheres are uniformly distributed.
do not have an explicit
functional connection. The spheres are uniformly distributed.
The values of functions  are distributed closely to
zero. The spheres are distributed along one of the axis.
are distributed closely to
zero. The spheres are distributed along one of the axis.
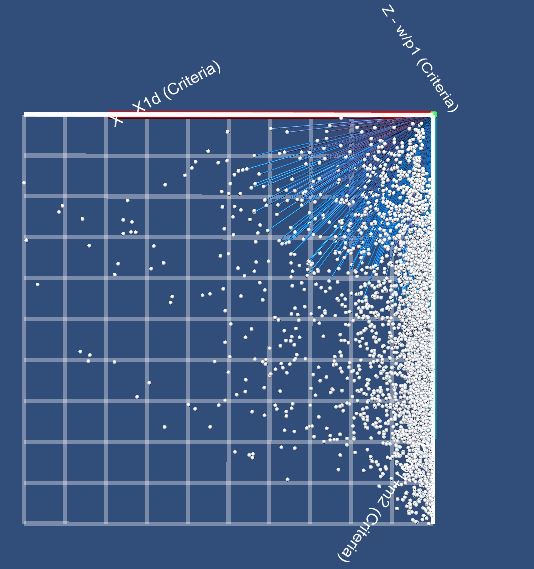
The closest to the origin point spheres in
the criteria space are marked with red color. The ability to render cylinders
to the origin point is used.
Figure
12. Scene with spheres and cylinders
Switch to the parameter space and mark
yellow spheres closest to the red ones.
Figure
13. Scene with spheres and cylinders.
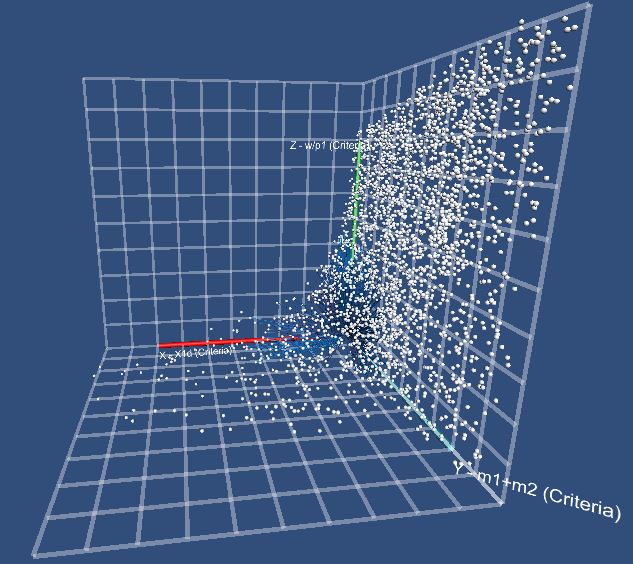
Switch back to the criteria space.
Figure
14. Scene with spheres and cylinders
Let us make a type 1
statement for the figure 14. Spheres, which are close to the initially marked
(red) spheres in the parameter space, are not close to them in criteria space.
This means, that a slight parameter change leads to considerable change in
criteria space.
This article shows the process of visual
analytics software development and its future use. Visual analytics was applied
to multicriteria optimization task, described at the beginning of the article.
The data model and the program algorithm were designed to analyze data of
multicriteria optimization task. Using the developed program, the data of
twomass dynamic model was analyzed.
The sensitivity analysis of given task was
conducted; the solutions are unstable: the slight change of parameters causes
significant change in optimization criteria values. The cloud of solutions,
optimal by aggregated criteria  , was visually selected.
Judgements about dependence between optimal criteria were formulated.
, was visually selected.
Judgements about dependence between optimal criteria were formulated.
Future development is planned in various
directions. First of all, the improvements in user interactions are planned:
working with several 3D-projections at once, additional capabilities of optical
parameters change (having spheres on scene colored with different colors),
2D-graphs for barr charts analysis.
Second is adding of numerical methods,
which allow to obtain the potentially optimal solutions without using the
visualization method.
1.
Multidimensional Data Analysis for
Multiparametric Optimization Problems Using Visualization / A. Bondarev, V.
Galaktionov // Scientific Visualization. – 2012. – Vol. 4 – No. 2 – PP.1-13.
2.
A research of procedures used in the analytic
hierarchy process and visualization in sensitivity analysis / V.V. Kotova // Scientific
Visualization. – 2016. – Vol. 8. – No. 2. – PP. 59-84.
3.
Using visualization in solving discrete
mcda-problem by methods of promethee family / A.Yu. Yakovlichev, I.E. Milman,
V.V. Pilyugin // Scientific Visualization. – 2016. – Vol. 8. – No. 3. – PP.
78-84.
4.
Scientific visualization as method of scientific
data analysis / V. Pilyugin [et al.] // Scientific Visualization. – 2012. – Vol
4. – No. 4. – PP. 56-70.
5.
Usage of visualization in the solution of
multicriteria choice problems / A.P. Nelyubin [et al.] // Scientific
Visualization. – 2017. – Vol. 9. – No. 5. – PP. 59-70.
6.
Statnikov R. The Parameter Space Investigation
Method Toolkit. / R. Statnikov, A. Statnikov – Artech House. – 2011. – 214 с,
7.
Implementing Sobol’s Quasirandom Sequence
Generator / Stephen Joe, Frances Y. Kuo // ACM Transactions on Mathematical
Software, Vol. 29, No. 1, March 2003, PP. 49–57.
8. Data analysis of credit organizations by means of interactive visual
analysis of multidimensional data / I.E. Milman [et al.] // Scientific
Visualization. – 2015. – Vol. 7. – No. 1. – PP. 45-64.
