As of middle 2017 the ATLAS Production System [1] daily executes 2M
computation jobs distributed over 170 WLCG sites [2] and opportunistically used
resources, such as supercomputers, academic and commercial clouds and
university clusters. This number is achieved by simultaneous running on more
than 350k cores. Each job registered in the system is a complex entity
described by input/output data location, required software version, hardware
specification, a human or system who submits it and in total has 117
attributes. Moreover they are grouped into bunches which are called tasks and
campaigns and deliver bigger processing results containing millions of events.
The system internal data should be processed, analyzed and represented
in a compact form which could be easily understood by several groups of users:
physicists, production managers, site sysadmins, shifters and software
developers. These interfaces should include many views allowing to perform
operational work such as: checking status of a particular job, representing the
distribution of the whole ATLAS grid payload over different physics tasks or
downloading a job error log.
The BigPanDA monitoring visualization pipeline has three different
presentation forms: interactive interfaces, tables and plots. All displayed
data is fetched from a Django [3] based scalable data processing engine. The
primary initial source of the data stream is the Oracle DB [4] which is used by
the PanDA workload management system as the storage backend. The following
constraints determined the development choice for the custom data processing
engine: relational structure of the raw data with complex aggregation of
objects scattered among many tables, variety of data to be presented at every
interface view, and diversity of navigation paths to be supported by the
system. The architectural details including description of the different steps
of data processing are described here [5].
Most of the BigPanDA pages are designed to present objects within a
hierarchy, summaries for aggregations of objects and vertical navigation in
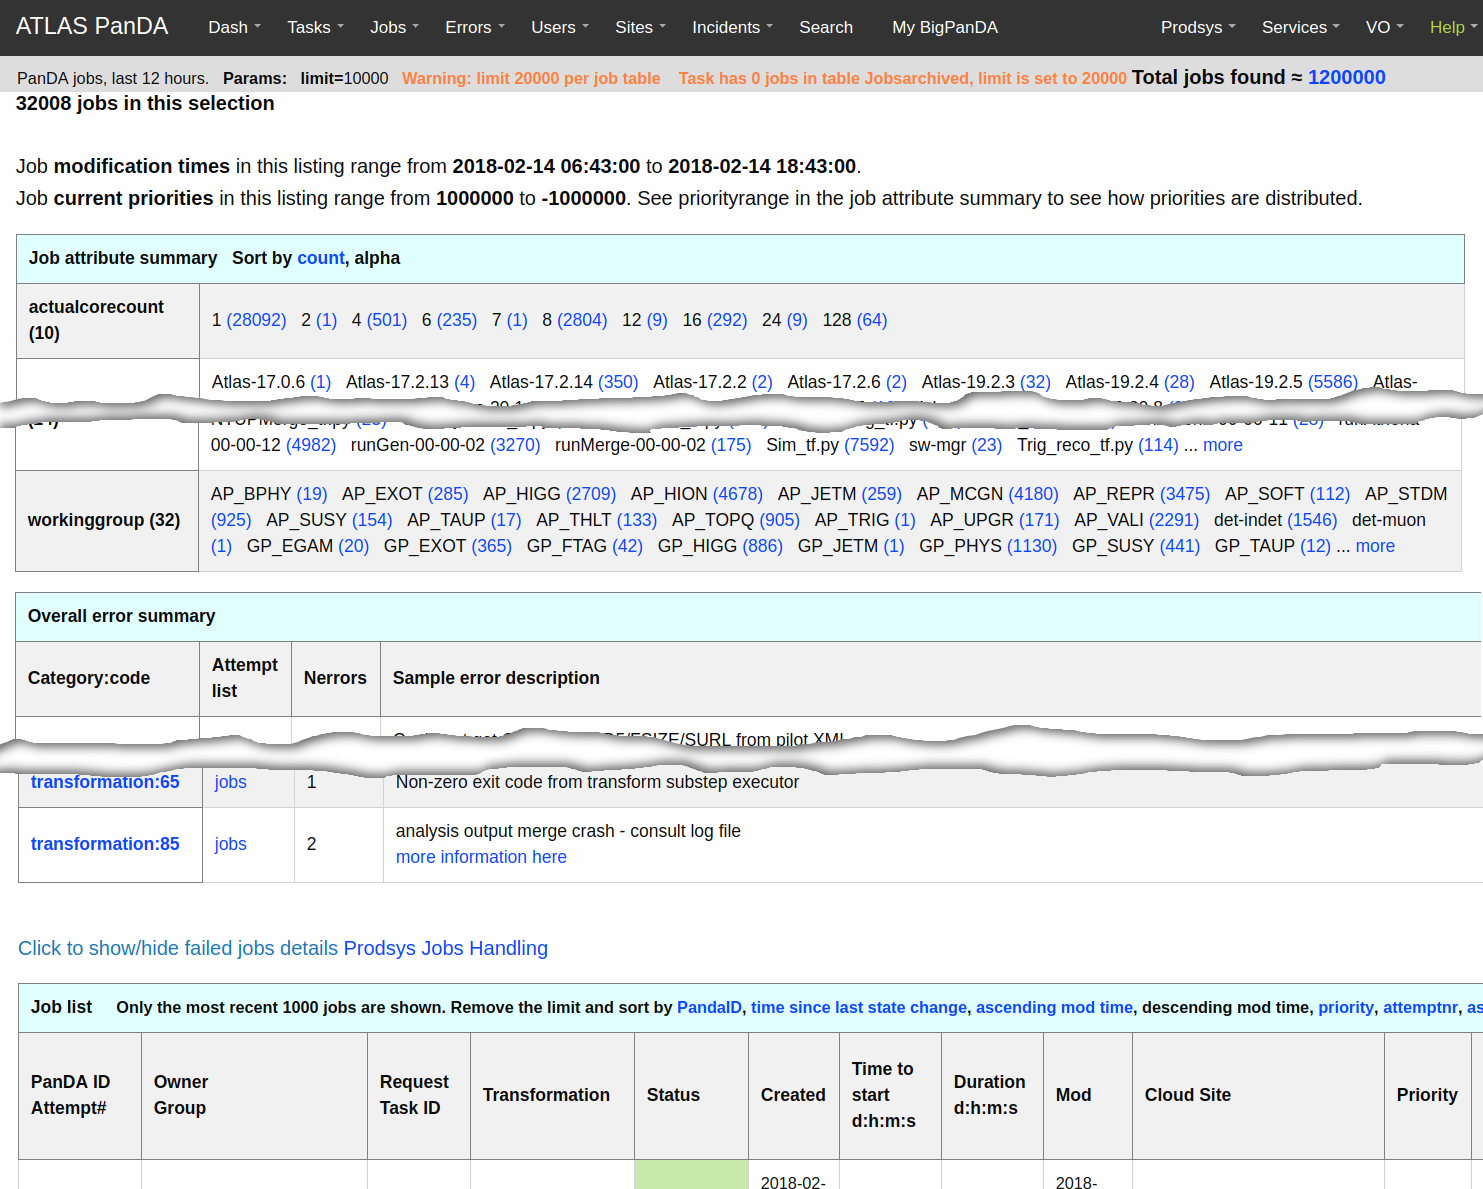
both directions. For example a jobs page [6] which is the most frequently
demanded view of the monitor is presented in Figure 1. There are three
following tables:
-
Job attribute summary
contains aggregates of jobs over 26 different criteria. In each cell we show a
count of occurences of different values and a link to another jobs subset
adding a new selection criteria. E.g. a link with a particular task identifier
will lead to the jobs list belonging to a corresponding task. This approach
solves two problems: delivers quick representation about structure of
properties values distribution and provides navigation to a narrower jobs
selection.
-
Overall error summary
provides description of errors, their popularity and corresponding codes
occuring in the selected jobs.
-
Job list provides a
short description of selected jobs, one by one.
This pattern, tables with aggregates of selected objects and their
description, is used on many summary views and well recognized by the user
community.

Figure
1. The jobs view
To avoid
overloading of views some data is shown only on demand. As one can see in the
example the failed jobs details are not shown by default.
Almost every page
of BigPanDA monitoring contains one or a few tables. Most of them are filled
with data provided by the processing engine and are rendered using the Django
template system. But for some cases this approach does not meet requirements
and we utilize a third party JavaScript component - Datatables [7].
This approach
decouples table content from the rest of the information presented on a view.
In this way information could be prepared and transferred to a client
asynchronously. The most valuable advantage of using Datatables in BigPanDA
monitoring is a client side control over representation. For example once
delivered to the client a set of rows could be sorted in different orders,
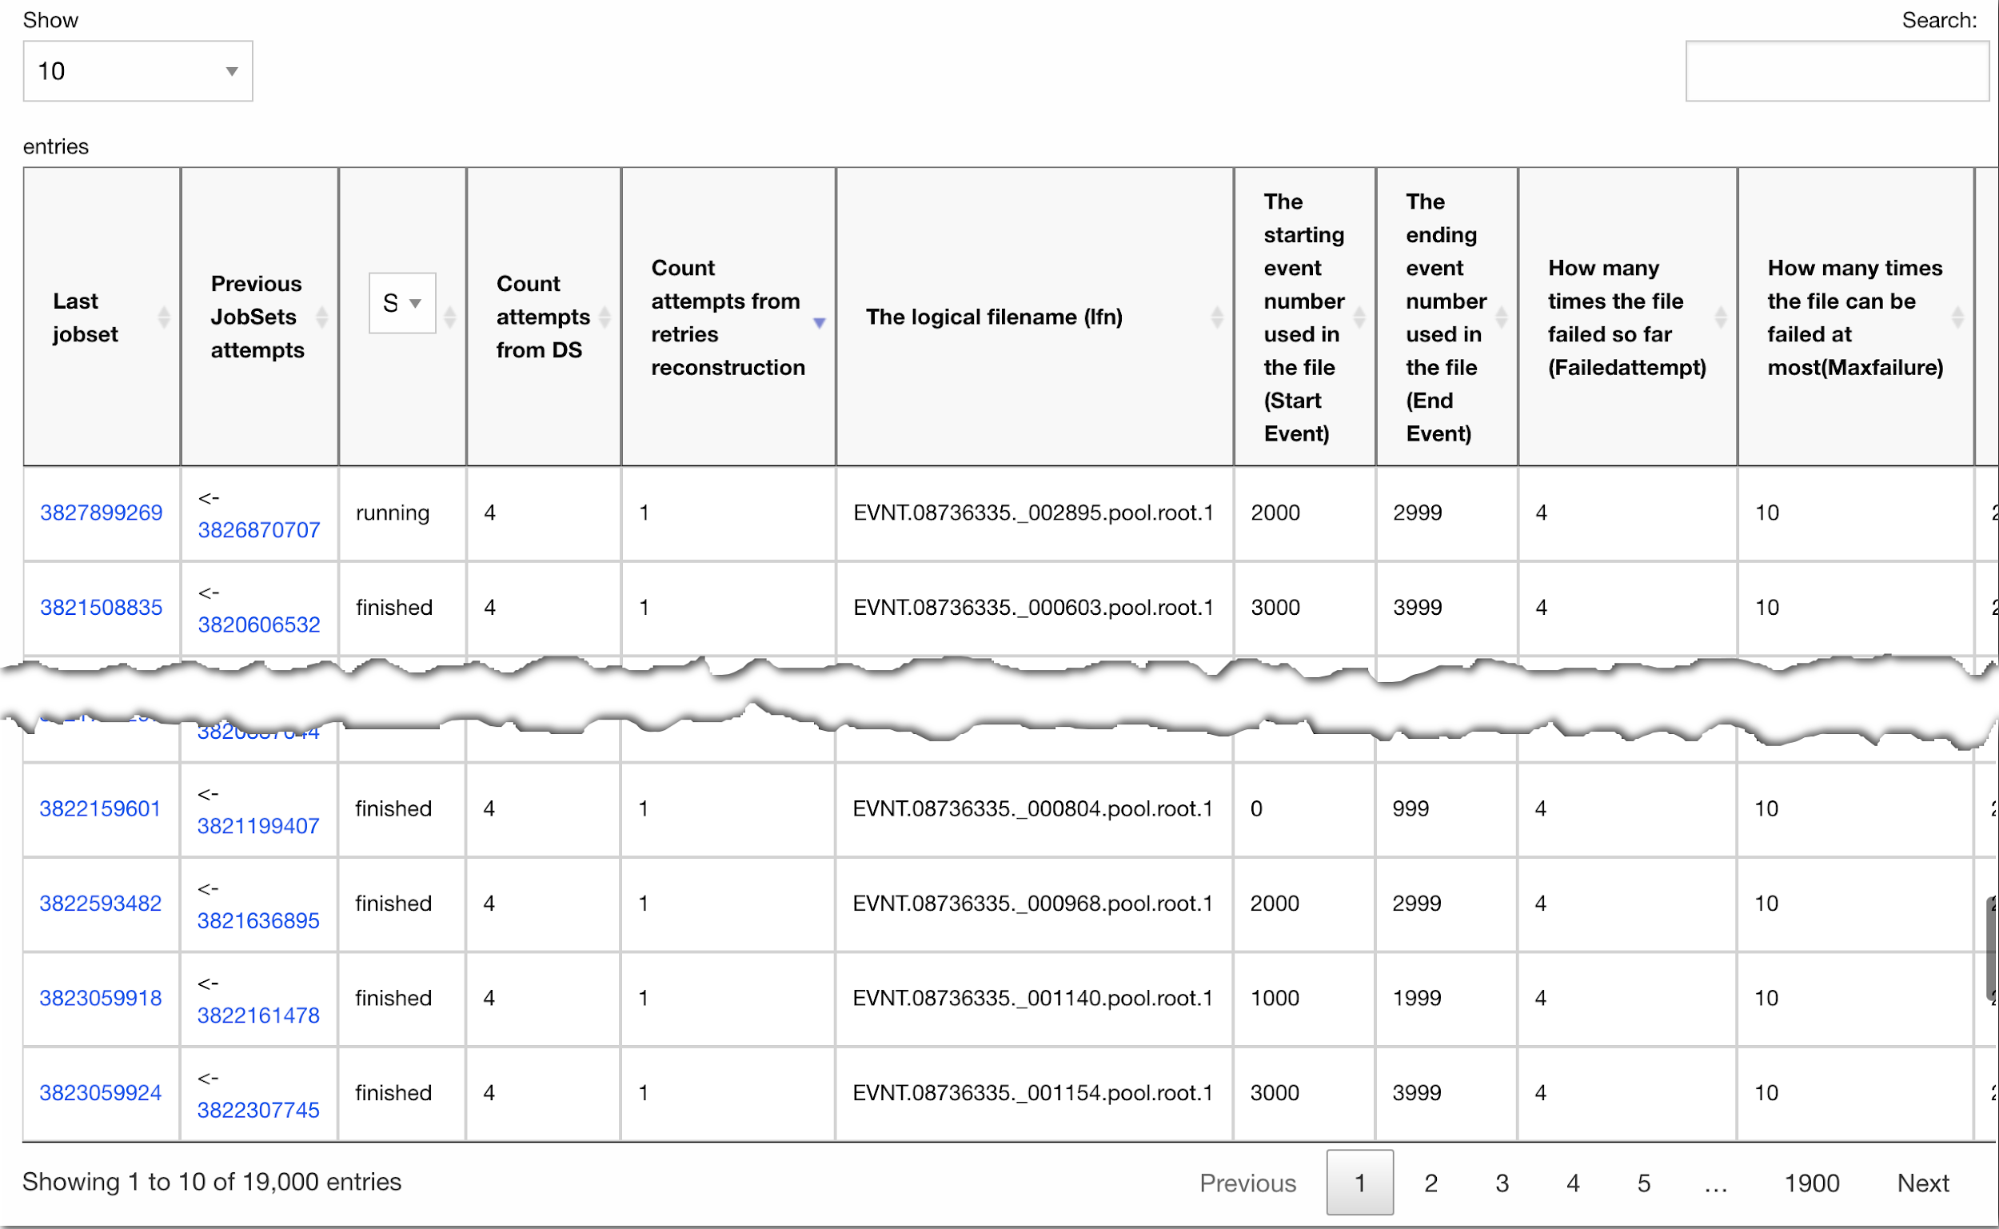
filtered and split into many tabs. An example of such a table is given on
Figure 2.

Figure
2. Example of table visualized by Datatable library
Figure 2 shows additional
controls which provide for ordering by every column, selection of jobsets
status, search over the table, selection of appropriate number of rows in each
table screen and navigation over rows.
The basic plots functionality provided by BigPanDA monitoring is
implemented using the JavaScript D3 library [8]. One of the advantages of using
this framework is supporting the different kind of plots united by the same
style of representation with additional capability to react on user actions.
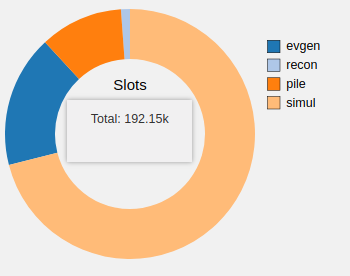
For example on Figure 3, the number of allocated slots for running Monte-Carlo
simulation tasks is shown. When a user selects a section on the pie chart the
notation in the center dynamically changes and shows advanced information about
the selection.

Figure 3. Distribution of number of allocated slots for running
production tasks plotted with D3 library

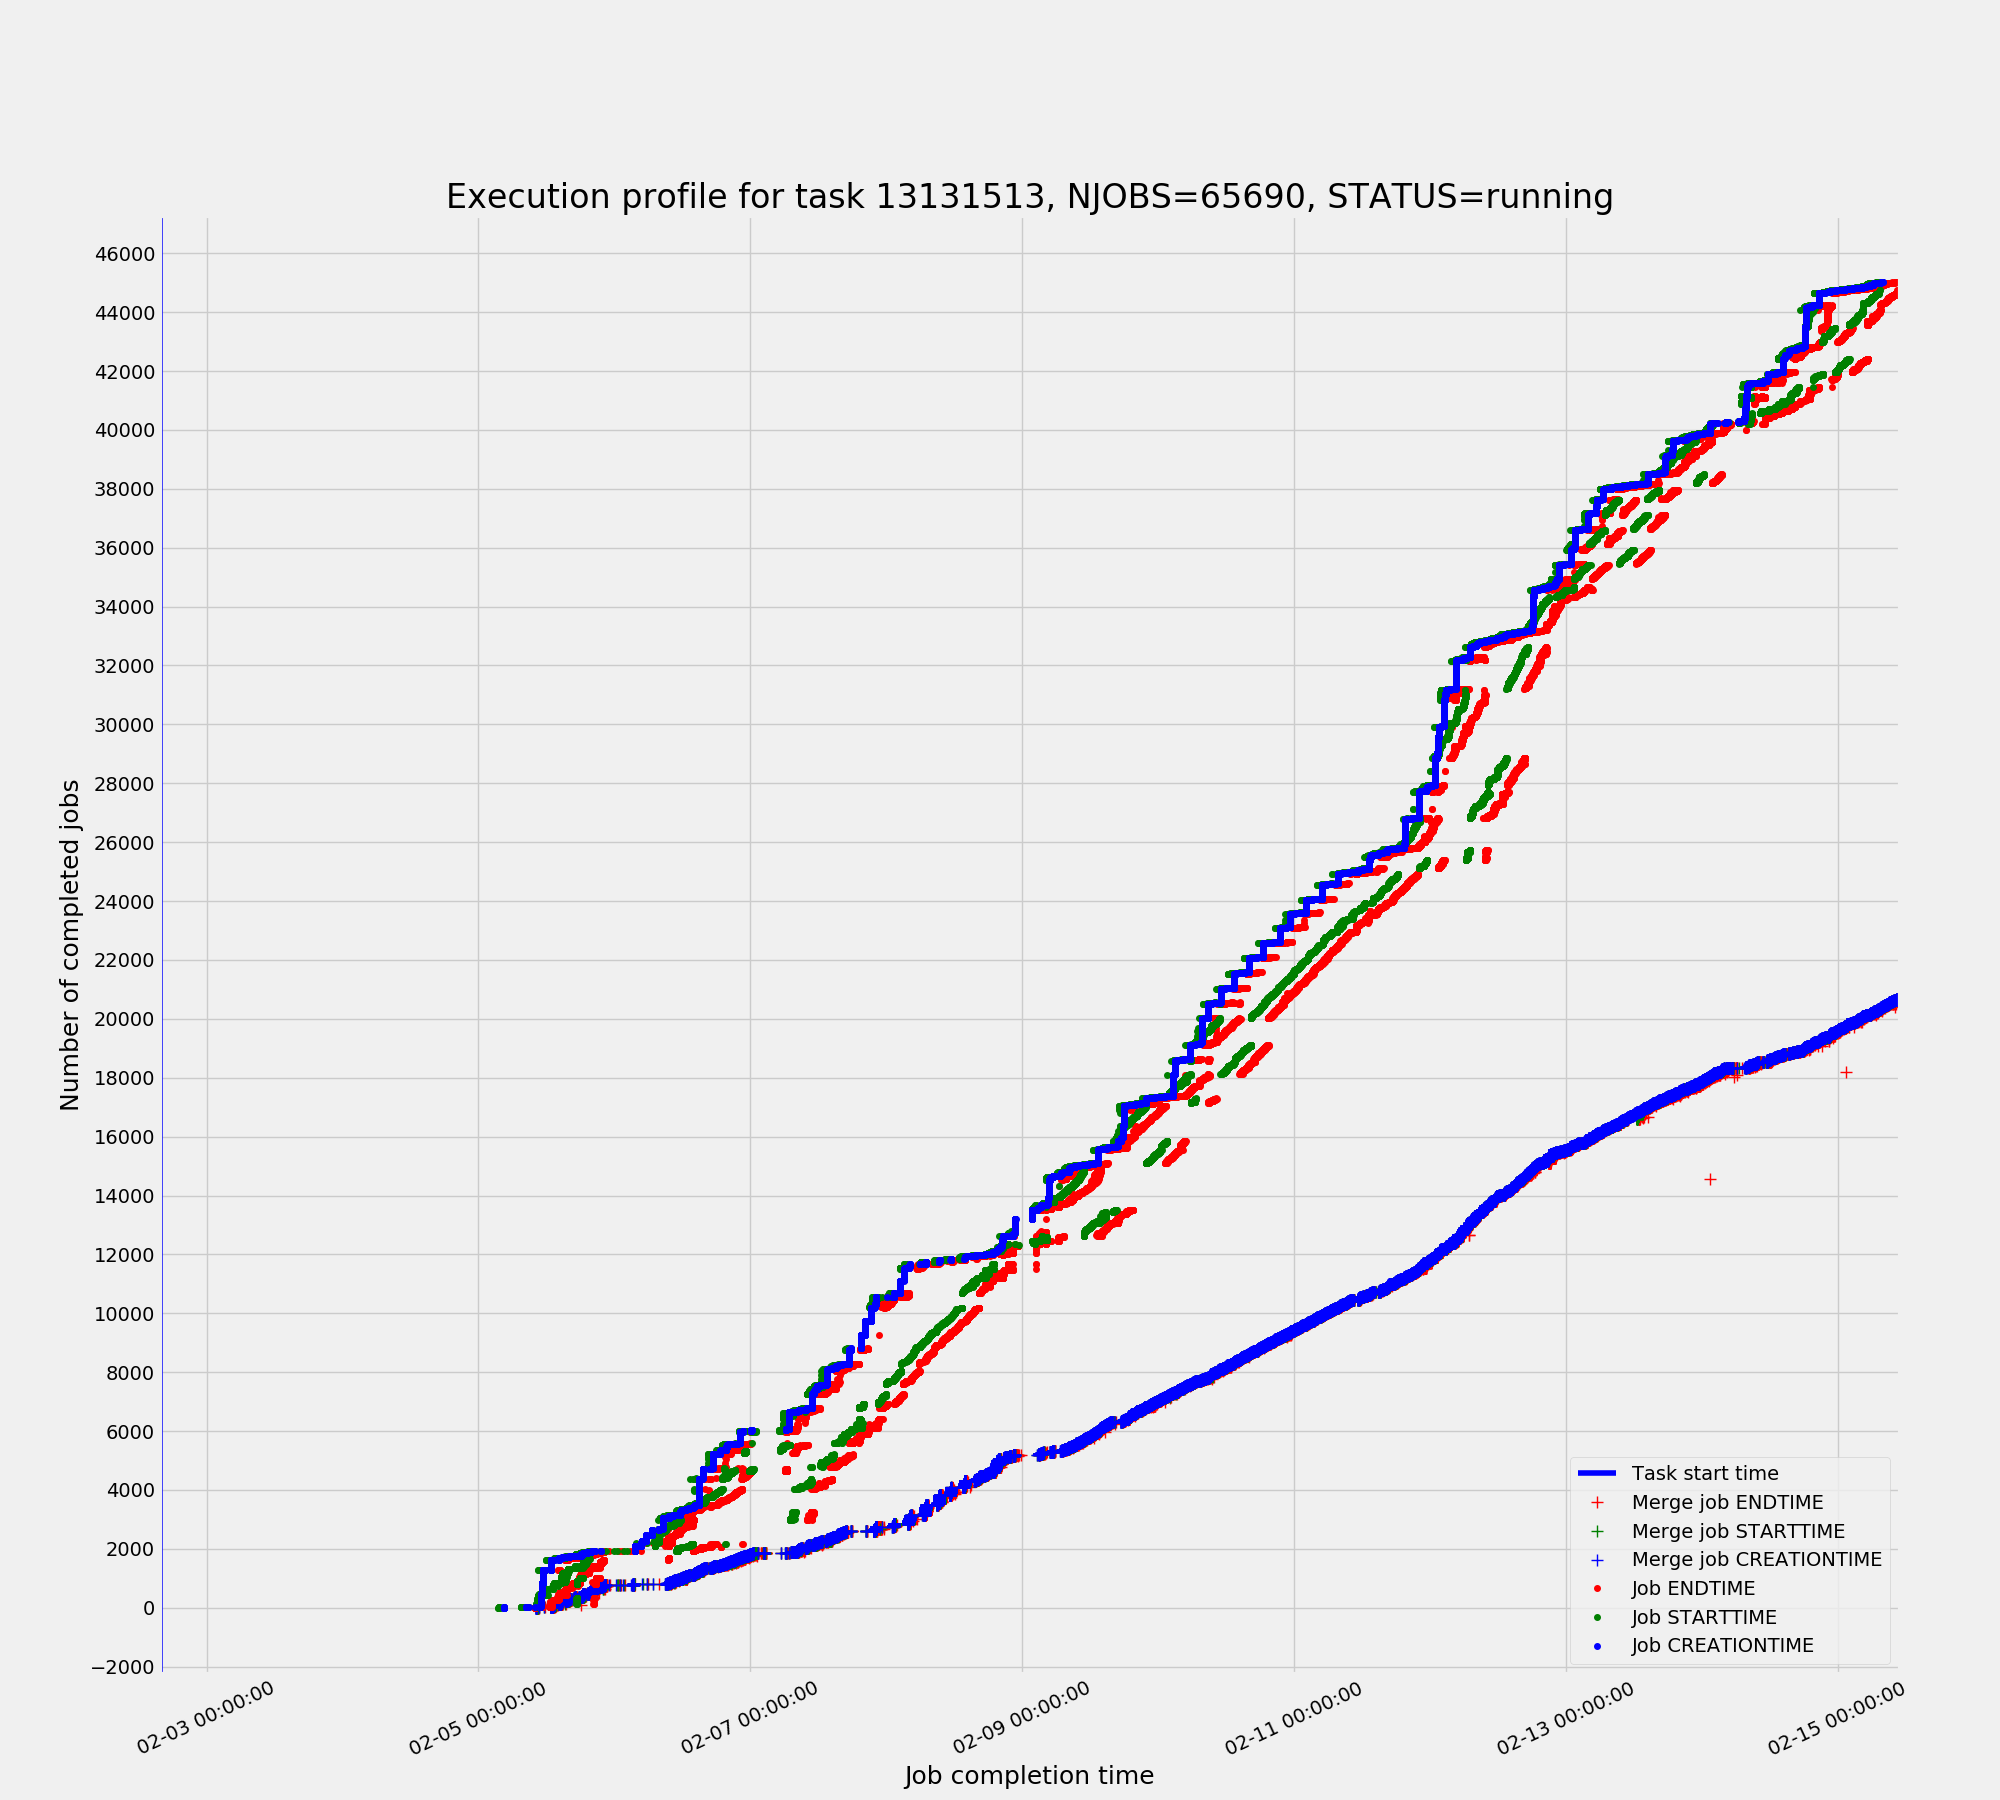
Figure 4. Task profile plotted with matplotlib library
For some accounting tasks such as event processing progress the data
sample for a plot could be as high as tens of millions of entries. Making these
plots in a web browser requires significant bandwidth of a client for data
transfer coupled with CPU overhead for rendering. To avoid this, the high
statistics plots are built on the server side using Python’s matplotlib
library. Once the plot is rendered inside the server process it is exported
into the png format and delivered to a client as a usual raster picture (Figure
4).
One of the
distinctive features of the next generation of monitoring is the possibility to
integrate methods and techniques for data analysis. BigPanDA monitoring
provides an experimental feature based on machine learning algorithms -
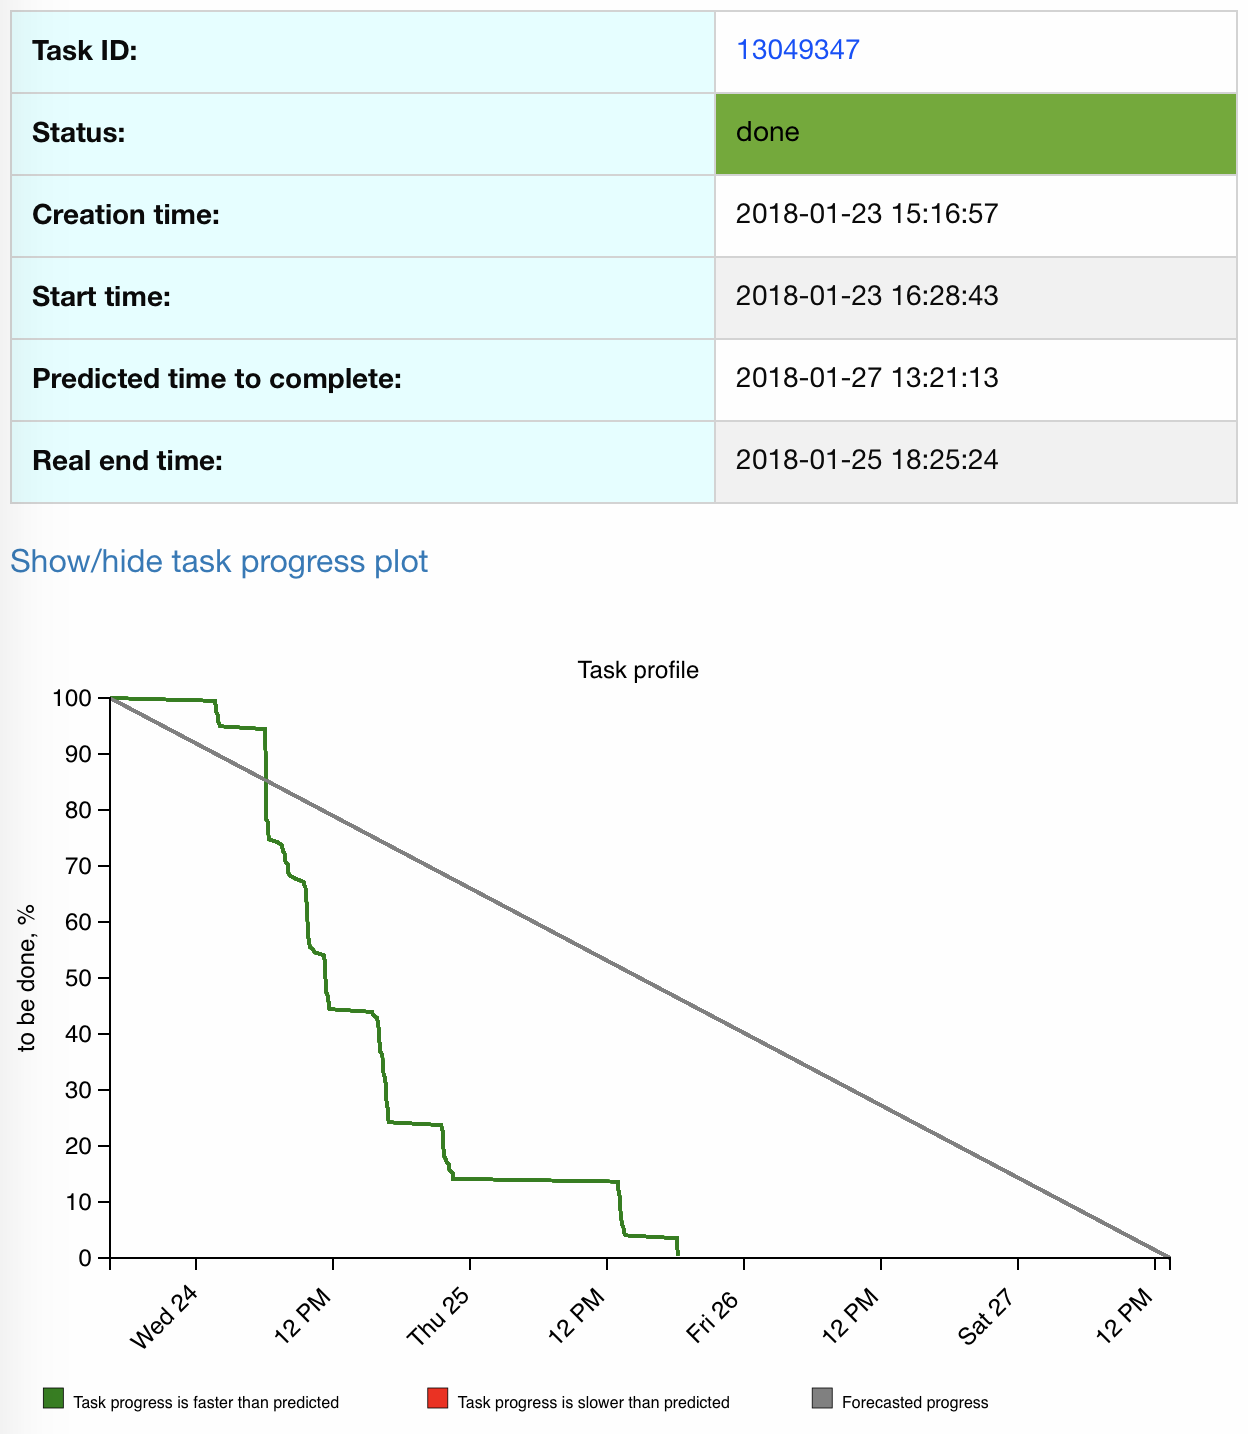
prediction of the task execution duration and thus, task time-to-complete (TTC)
estimation [9]. Representation of it with the connection to the real task
execution process is shown on Figure 5.

Figure 5.
Representation of task Time-To-Complete in comparison with task real progress
BigPanDA monitoring provides various ways of information visualization
including web pages, plots and tables. These forms were designed to represent
information constructed by processing tens of millions of rows of internal
PanDA data. In this paper we described adopted approaches and some use cases
driving the implementation. The outcomes of the work could be reused in
applications dealing with Big Data representation for different domains.
[1] M. Borodin
et al., 2015 Scaling up ATLAS production system for the LHC run 2 and beyond:
project ProdSys2, https://doi.org/10.1088/1742-6596/664/6/062005 J. Phys. Conf.
Ser. 664 062005
[2] Bird I 2011
Computing for the Large Hadron Collider Annual Review of Nuclear and Particle
Science vol 61 pp 99-118
[3] Django
project, “Django” [software], version 1.11.5, 2017. Available from
https://docs.djangoproject.com/en/1.11/ [accessed 2018-02-20]
[4] Oracle DB
project, “Oracle” [software], version 11g, 2017. Available from
http://www.oracle.com/technetwork/database/database-technologies/express-edition/downloads/index.html
[accessed 2018-02-20]
[5] Wenaus T.,
Padolski S., Korchuganova T., Klimentov A. (2018, August). ATLAS BigPanDA
Monitoring. Poster session presented at the 18th International Workshop on
Advanced Computing and Analysis Techniques in Physics Research, Seattle, USA.
[6] BigPanDA
Monitoring, “Jobs” view. Available from https://bigpanda.cern.ch/jobs [accessed
2018-02-20]
[7] DataTables
project, “DataTables” [software], version 1.10.16, 2017. Available from
https://datatables.net/download [accessed 2018-02-20]
[8] D3js project,
“D3js” [software], version 3.5.17, 2016. Available from https://d3js.org/
[accessed 2018-02-20]
[9] M.Titov,
M.Gubin, A.Klimentov, F.Barreiro, M.Borodin, D.Golubkov, "Predictive
analytics as an essential mechanism for situational awareness at the ATLAS
Production System", The 26th International Symposium on Nuclear
Electronics and Computing (NEC), CEUR Workshop Proceedings, vol. 2023,
pp.61--67, 2017.

