Empirical observations about "differences in
the productivity of factors of production at different points in the economic
space" [1, p. 14] formed the basis of the theory of international
exchange by A. Smith and D. Riccardo. These differences remain relevant today.
At the same time, the basic tool for improving territorial planning is the
division of the state into parts according to the totality of any interrelated
features in order to differentiate management mechanisms, taking into account
“the maximum use of the advantages provided by the heterogeneity of space” [2,
c.17].
Depending on the goals set, the parts allocated in
the process of territorial division can serve both as the basis for building a
public administration system, representing administrative-territorial units
(for example, federal districts in Russia), and as the basis for economic
development (for example, economic regions in the USSR).
In the scientific literature devoted to
territorial division, both the classics of economic geography [3–5] and
researchers of the current stage of economic development [6–10] use the term
“zoning” as a synonym for the latter. As A. M. Nosonov and V. N. Presnyakov
rightly point out, a district is a territory (water area) identified by the
totality of any interrelated features or phenomena, as well as a taxonomic unit
in any system of territorial division [11, p. 10]. This broad interpretation of
the region will form the basis of this study in order to avoid complicating the
perception of the conceptual apparatus.
Zoning methods are not just an integral part of
territorial studies, but also a constructive tool for the objective
identification of industrial, agricultural, transport, economic, socio-economic
and other regions of different hierarchical levels. The result of zoning is the
creation of a grid of socio-economic regions, which can serve as the basis for
both the administrative-territorial structure of countries, regional and local
self-government [12], and the basis of regional economic policy.
It is important to note that economic zoning is
not just a theoretical concept, although, objectively, the division of the
territory into regions according to certain characteristics facilitates the
task of analyzing the corresponding statistical indicators [13]. At the same
time, the territorial division solves applied managerial problems, and this
explains the interest in this topic in developed countries, in particular,
members of the European Union [14–17]. As a rule, a
macroregion in this context is understood as "a space that includes the
territory of several states or regions, united by one or more features or
challenges, ... geographical, cultural, economic, etc." [17, p. 8]. As M.
Bogach, who studies the economic zoning of the European Union, notes, “the
creation of macroregional strategies is a new way of working in terms of
European cooperation” [14, p.6].
In this context, we agree with A.N. Demyanenko is
that in Russia, which economic space is characterized by a high level of
heterogeneity, "state economic policy is doomed to be regional" [8,
p.5]. The key zoning grids today are the division of the territory into 8
federal districts, 4 military districts and 12 economic macroregions. These
grids of territorial division are the subjects of the Russian Federation united
on some basis and are designed to solve various problems: representation of
local authorities in order to establish administrative unification
(administrative-territorial division), ensuring the country's security
(military-administrative division), territorial organization of economic
activities of the national economy (economic zoning).
Visualization of the results of zoning is carried
out using mapping, which is a practical tool in the development of economic,
social, innovation and other types of policies by the authorities. Ready-made
maps, as a rule, are static images on which the selected areas are depicted in
different colors. At the same time, with the development of digital
technologies, static maps have been replaced by electronic interactive maps,
which are “a visual information system operating in the mode of two-way
interactive interaction between a user and a computer” [18].
A significant advantage of such maps is their versatility due
to interactive services [19], as well as the possibility of implementing
predictive analytics, implementation of virtual
experiments, making forecasts of the behavior of research objects. Thus, the
interactive map is a prototype of a real zoning grid, on the basis of which it
is possible to analyze and predict changes in the behavior of economic sectors
and individual regions in the process of implementing various tools of the
state policy of spatial development. This issue is being studied by scientists
and managers in the context of the so-called digital twins [20-25], the
relevance of studying which is beyond doubt in the light of widespread
digitalization.
In our study, we will dwell in more detail on
economic zoning, by which we mean a territorial division aimed at defragmenting
the economic regional policy in order to ensure the progressive development of
the country. Despite the high importance of economic zoning recognized by
scientists, “the scientific approach to zoning today is in some kind of stagnation,
the search for a new look at the region, its essence and development prospects”
[26, p.160], and “public administration is in dire need of scientific zoning,
which would make it possible to differentiate the decisions made in relation to
the characteristics of different parts of the country” [9, p.19].
Considering the foregoing, and also taking into
account the scale of the territory of Russia, the possibility of obtaining a
holistic visual representation of the relevant statistical data both in the context
of individual subjects of the Russian Federation and in terms of entire
economic macroregions becomes of particular importance in economic zoning.
At the same time, it is not just about providing the
option of perception,
evaluation and analysis of the available
information. First of all, the purpose of visual presentation of data regarding
economic zoning is
to provide the possibility of modeling the territorial
organization of economic activity and predicting the behavior of economic
sectors in order to increase the growth rate of the national economy and its
spatial development.
Based on the foregoing, it can be said with confidence that
the visualization of the results
of territorial
division through interactive mapping
is an essential component of the
process of forming plans, forecasts and strategies for the spatial development
of both individual industries and regions, as well as macroregions, and the
national economy as a whole.
The use of visual methods for displaying the
results of mapping in terms of territorial division is designed to simplify the
tasks of spatial planning, forecasting, programming and strategizing. A review
of scientific literature and information sources from the Internet, containing
cartographic visualization of economic zoning, revealed that the solution of
the problem of territorial division is carried out in practice by generating
both static and interactive maps.
Let us consider the practical application of
the selected types of maps in more detail. Thus, almost all territorial studies
(and even more so studies in the field of economic zoning) involve cartographic
visualization of the results obtained. Thus, they all contain statistical maps
that display the selected areas based on preliminary qualitative or
quantitative calculations.
Despite the fact that static maps can be
built using various visualization tools, they have in common that they reflect
specific results and do not allow obtaining additional information other than
that actually shown on the geographic map [17, 27–30] . Sometimes in the
scientific literature they are called "non-interactive
program-dependent" [31],
which, in fact, means
their creation in special programs, platforms or using programming languages
(CorelDRAW, Adobe Illustrator, Microsoft power BI, Stata, R and others) that
support the user's operating system. The obvious disadvantage of such maps is
the lack of interactivity, and the resulting problem of overloading maps with
conventional signs.
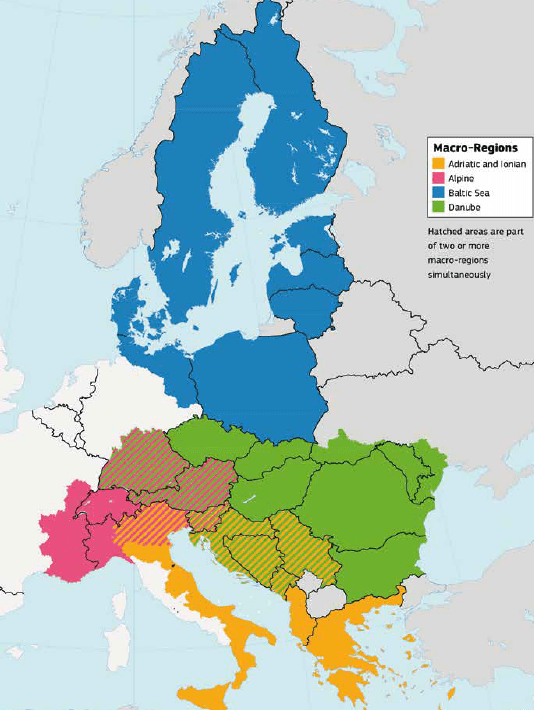
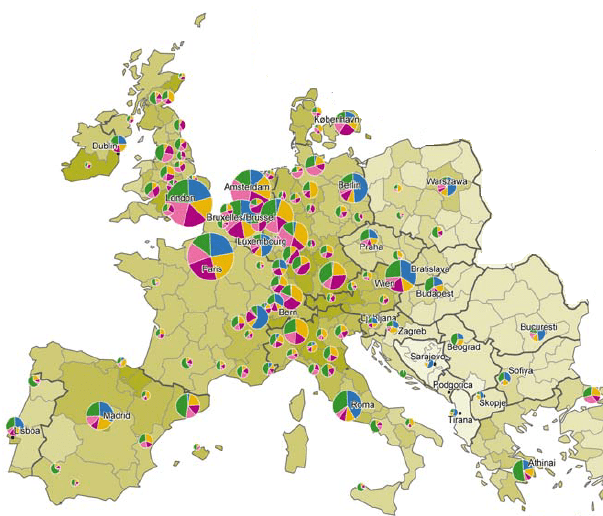
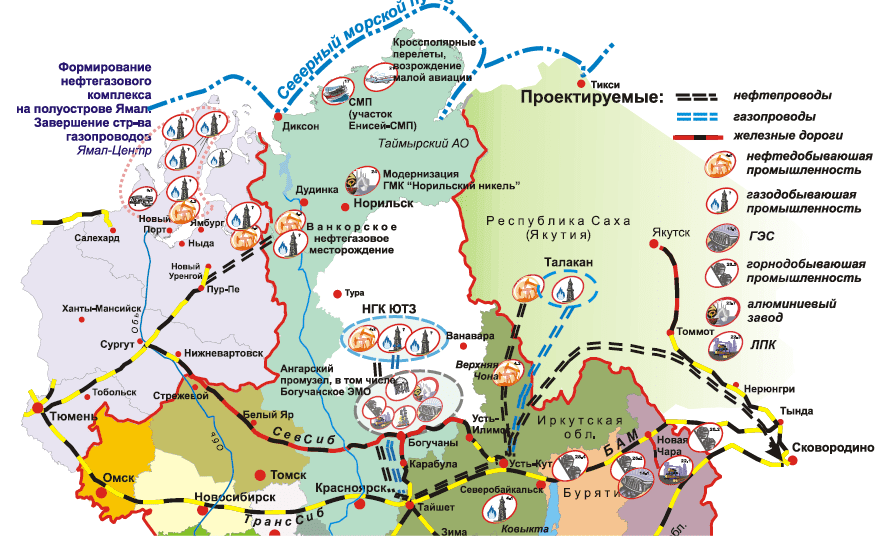
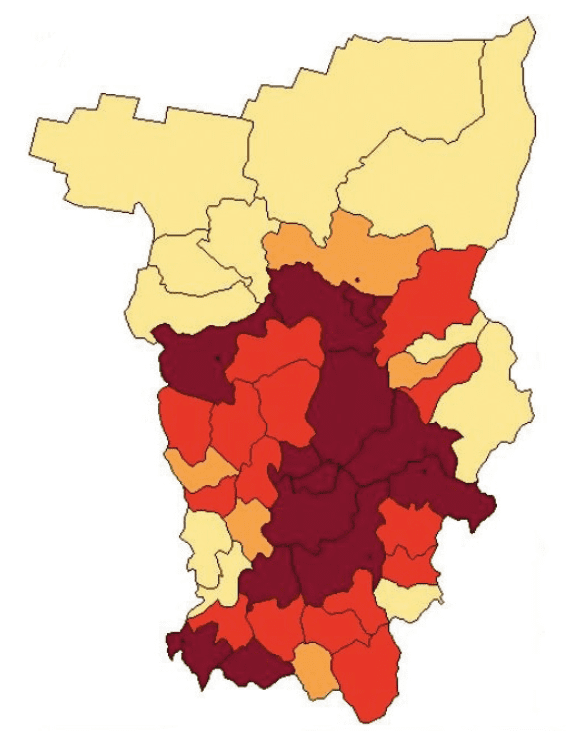
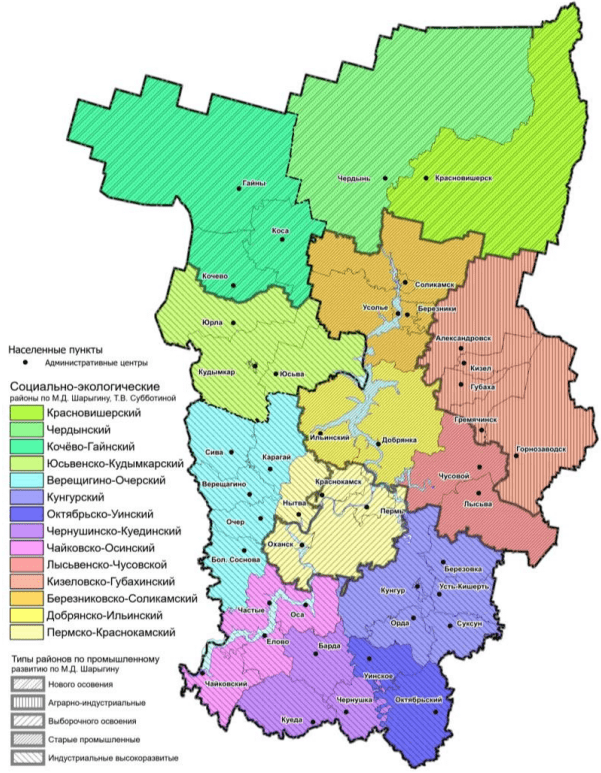
Examples of non- interactive software-dependent maps
that visualize the results of economic zoning are shown in Figure 1.
|
|
|
|
a)
Macroregions of the European Union [32]
|
b)
Clustering of European regions according to the level of production
development [33, p. 53]
|
|
|
|
|
c)
Map of strategic investment projects in Siberia [34, p. 249]
|
d) Clustering of municipalities
Perm region by level
unemployment
[35, p. 407]
|
Fig. 1. Examples of non-interactive
software-dependent maps visualizing the results of economic zoning
Turning to the consideration of the practical
application of the second type of maps - and interactive ones, we note that we
considered only maps that reflect the results of economic zoning, presented on
various sites and platforms and "possessing the property of information
content" [31, p.26].
Interactive maps are conditionally divided
into program-dependent and program-independent. Interactive software-dependent
maps include maps generated using specialized mapping programs (MapInfo, ArcGis
and QGIS, etc.). The resulting map is a file (or several files). To work with
such a card, you need a computer with an operating system (mainly Windows) and
the appropriate program in which it was created or a program that supports this
card format. The disadvantage of these maps is the low degree of interactivity,
which is understood as “an indicator that characterizes how quickly and
conveniently the user can achieve his goal” [19]. This is due, first of all,
to the payment of specialized cartographic programs. In addition, we note the
limited possibilities in the field of integration of statistical and calculated
data (for example, the user must independently find special files of map layers
(shape-files), as well as limited possibilities for demonstrating the results
obtained, which do not allow the mapping results to be made publicly available.
At the same time, unlike simple static,
non-interactive maps, “each conventional sign on an interactive map has not
only its usual informational component, but also a hidden one that is displayed
as the user needs. This approach makes it possible not to overload the map with
conventional signs, makes it more understandable and easier to read” [19], and
also allows you to change the visual perception depending on the tasks set by
the user.
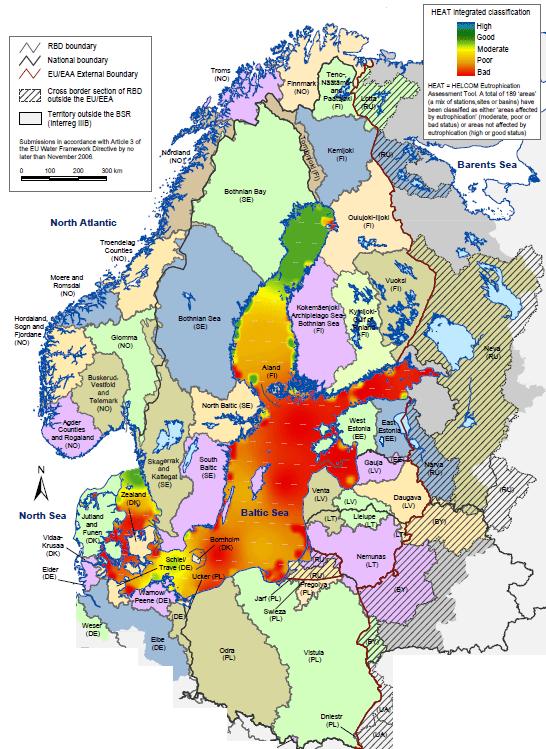
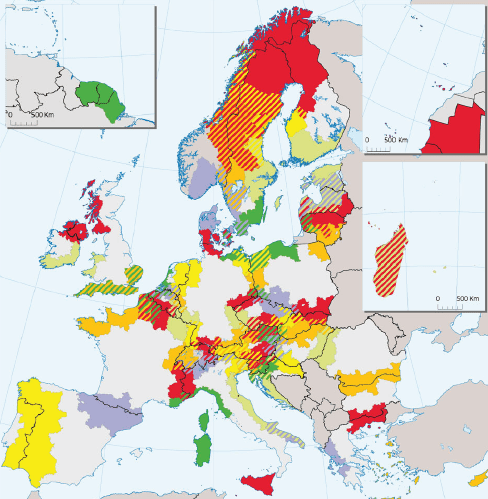
Examples of interactive software-dependent
maps that visualize the results of economic zoning are shown in Figure 2.
|
|
|
|
a) Economic and socio-ecological zoning of the
Perm Territory [36, p. 50]
|
b) River basin areas in the Baltic region [15,
p. thirty]
|
|
|

|
|
c) European Regional Development Fund
cross-border cooperation program programs) [37, p. 255]
|
d) Clustering of Chinese regions by poverty
level (Types of nation-level poverty counties) [38, p.200]
|
Fig. 2. Examples of interactive software-dependent
maps visualizing the results of economic zoning
Interactive and software-independent maps
include electronic maps that are created in special services, such as, for
example, Googlemaps, Yandex maps, MapGps, etc. To work with these maps, you
must have Internet access and be registered on the service. The advantages of
these cards are obvious: online access to services; the possibility of creating
interactive maps on remote and shared access; simple interface with the ability
to integrate text, video and photos, both from a personal computer and from the
Internet; the option of embedding created interactive maps on websites, blogs;
free use. Examples of interactive program-independent maps by regions of Russia
are shown in Figure 3 [39, 40].
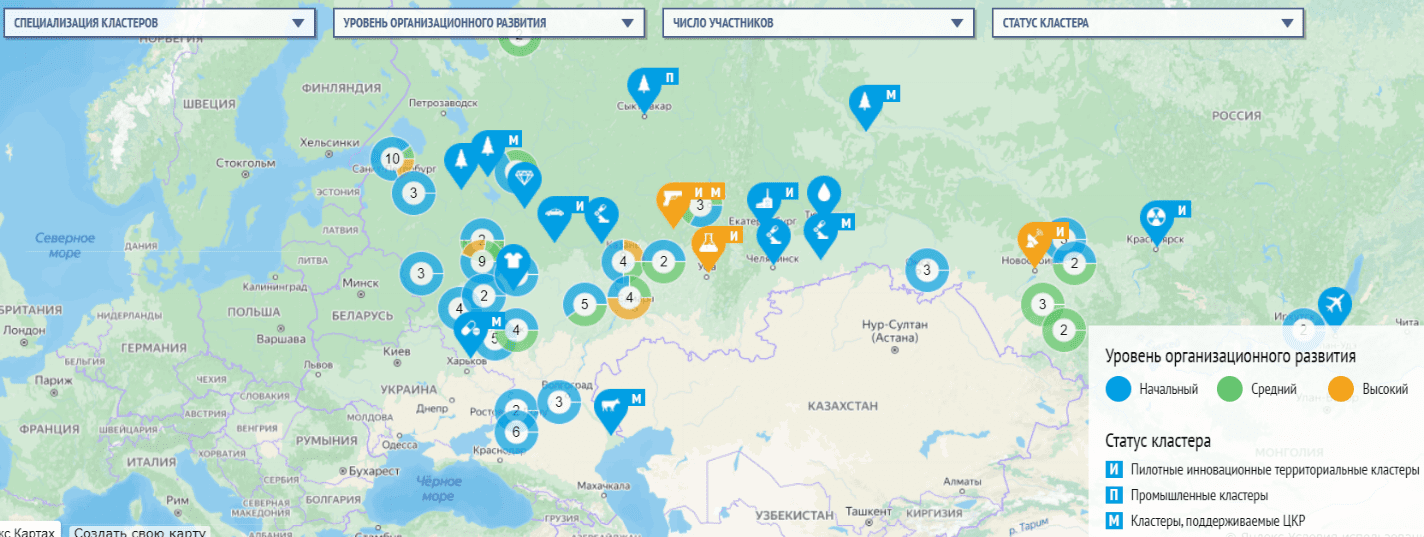
a) Map of Russian clusters
b) State Information System of Industry
Fig. 3 Examples of interactive software-independent
maps
We did not find examples of interactive
program-independent maps that visualize the results of economic zoning in
Russia. At the same time, such maps are widely used by the statistical services
of many large states (for example, the USA [41], Canada [42], New Zealand [43
], EU countries [44], Australia [45]) for analytical activities and for
development of strategies for the development of territories of the
meso-economic level.
Summing up the analysis of the visualization
of the problem of territorial division, we note that it is interactive maps
that fully allow predicting the behavior of economic sectors, and, therefore,
make it possible to make both reasonable forecasts for the development of
subjects of the Russian Federation and adequate strategies for the development
of the national economy. At the same time, we did not find an accessible visual
display of such calculations on the example of domestic data, which fully
implements the function of convenient perception of information.
In addition, despite the numerous advantages
of interactive program-independent maps, we have found that most interactive
maps that reflect the processes of economic clustering of domestic regions use
static data. The identified drawback is significant, since up-to-date data is
the key to high-quality forecasts of territorial and spatial development.
Accordingly, an interactive geographic map that embodies the digital twin of a
real territory and allows automatic updating of data, recalculation of the
requested indicators and changes in the visual result is an indispensable tool
for qualitative modeling of the territorial organization of economic activity
and forecasting the behavior of economic sectors in order to increase the
growth rate of the national economy. The present study is devoted to
substantiating the importance and possibility of creating such tools.
In this
part of the work, we describe the algorithm for the problem of territorial
division based on the concept of economic complexity proposed by C. Hidalgo, B.
Klinger, A.-L. Barabashi and R. Hausmann [46] in 2007 and disclosed by them in
the concept of the complexity of the economy in 2009 [47]. Scientists have
developed an index of complexity of the economy (hereinafter referred to as the
ISE), which makes it possible to determine the level of its development through
the diversification of the sectoral structure of exports and reflects the
degree of interconnectedness and interdependence of enterprises, and therefore
shows the “volume of knowledge mobilized by society” [48, p. 18]. Thus, the
complexity of the economy is embodied in a system of knowledge that is combined
to produce goods [49], and its increase is “one of the main goals of the state
economic and scientific and technical policy” [50, c slide 12].
A visual assessment of the level of
complexity of the economy can be carried out by analyzing the map of the
product space. At the same time, the “space of all goods” is a graph, the
vertices of which are the types of economic activity, and the edges are the
links between related industries that complement each other based on the
presence of common competencies. Thus, a complex economy is understood as a
highly diversified economy, the development of which is based on the production
of products that require a wide range of knowledge and competencies. The
author's method of economic zoning is presented in detail in [51].
Algorithm for creating a
digital twin of a grid of macroregions
was
written in the Python programming language using the BeautifulSoup, math,
matplotlib, nltk, numpy, scipy, rutermextract, xlrd, xlwt libraries. The
algorithm is implemented as a software tool, which is a web application - a
data integrator, placed in the public domain (http://ruclusters.ru/spatial_development
[52]). The digital twin synthesizes regional
statistical data based on site parsing and makes it possible to build
simulation models for finding the optimal variant of territorial division,
taking into account promising interregional cooperation.
The scheme of interaction of subsystems of
the software presented in fig. 4, includes 11 stages.
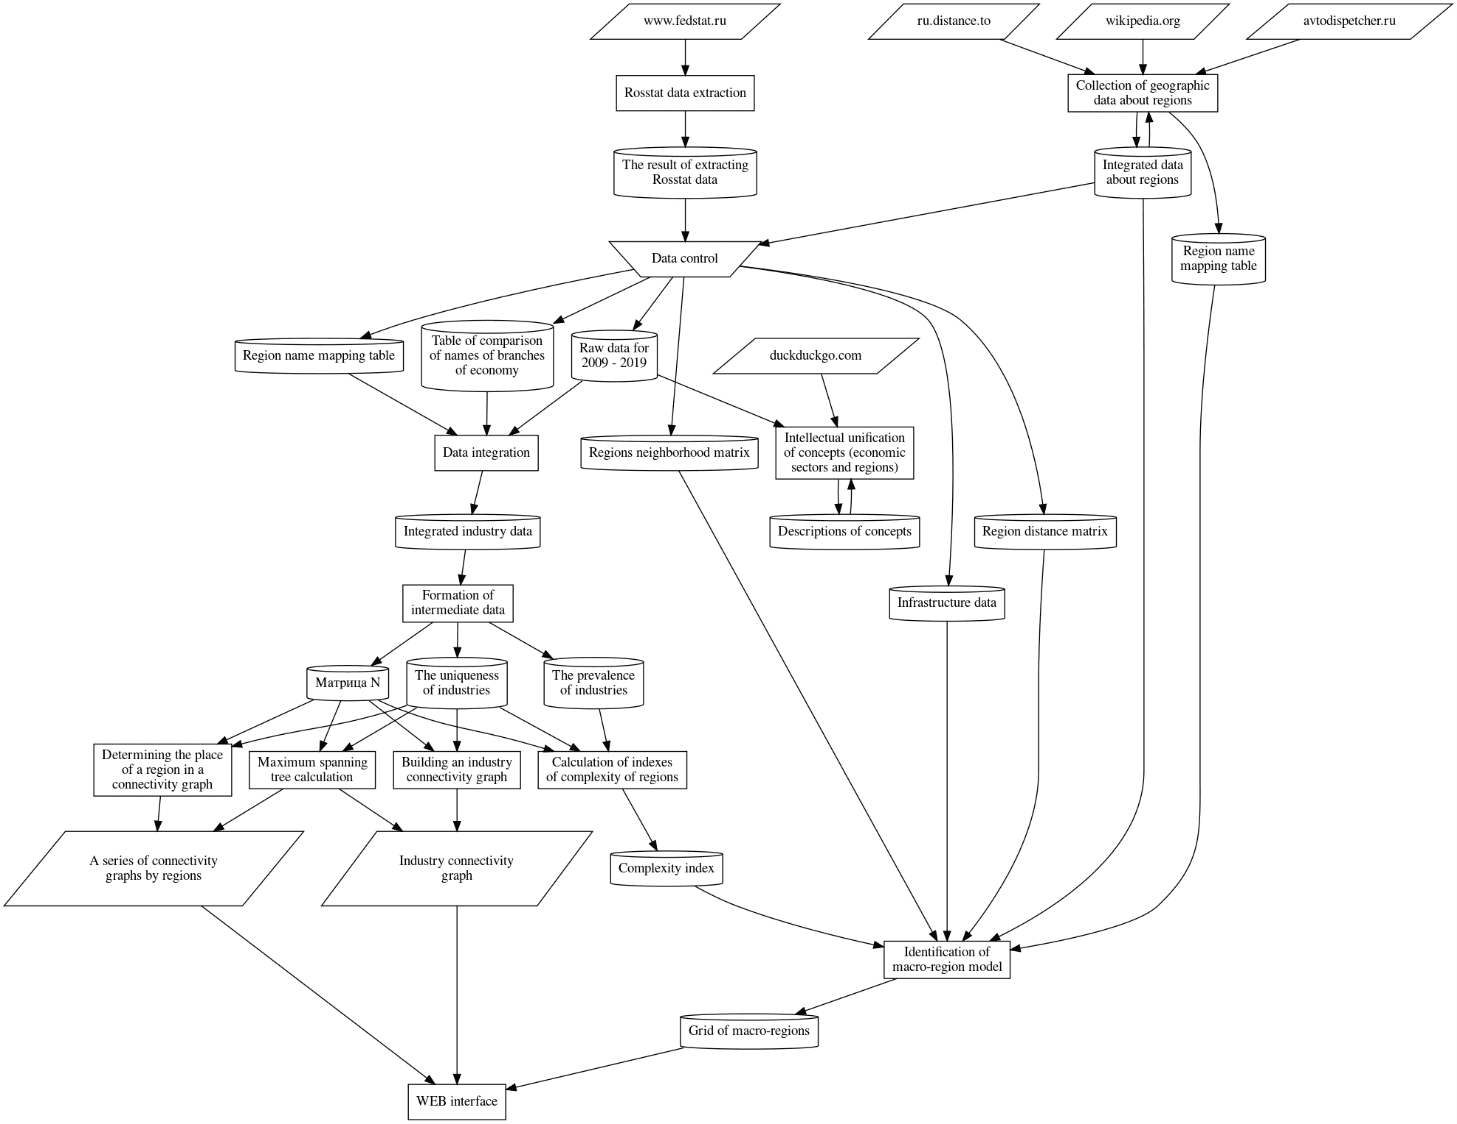
Fig. 4. Scheme of program interaction
Let us consider in more detail each of the
stages of the algorithm.
Stage 1.
Extraction
of Rosstat data.
At the first stage, automated collection of
statistical data (parsing) is carried out from open Internet sources such as:
EMISS State statistics www.fedstat.ru, and the free encyclopedia wikipedia.org.
The result is a structure of the following type:
"Lipetsk region": {
"emissname": "Lipetsk
region",
"center": " Lipetsk",
"code": "RU-LIP",
"vrp": "0",
"code": "RU-LIP",
"neighbors": [
"Ryazan Oblast",
"Tula region",
"Tambov Region",
"Oryol Region",
"Kursk region",
"Voronezh region"
],
"yandexname": "Lipetsk
region",
color: "#ffffff"
},
The presented structure has not yet been
assembled into a single database at this stage, since the database is collected
at separate stages by various algorithms. In addition, the data is
automatically updated after a set period of time. Due to the specifics of the
statistical indicators used, data on them are updated once a year.
Stage 2.
Collection
of geographic data about the regions.
Calculation of distances between regions is
carried out using the sites "Autodispatcher" avtodispetcher.ru and
Distance Calculator ru.distance.to. As a result, a matrix of distances between
the centers of regions is formed. In cases where there is no road or railway
(some regions of the Far East and the Far North), the distance on the map is
taken, multiplied by a coefficient selected experimentally.
Stage 3.
Data
control.
At the stage of data
control, selective manual control of the correctness of processing web sources
is performed. This is necessary because extracting data from web pages depends
on their design, set by the site owner. If the design is changed significantly
(for example, when a new version of the software of the data source site is
released), the processing may not be correct, which will lead to errors in
further calculations.
Stage 4.
Data
integration.
At this stage, the results
of processing various sources are combined, such as the Initial data of Rosstat
for 2009 - 2019, a table for comparing the names of economic sectors and a
table for comparing the names of regions. The merging takes place on the basis
of fuzzy algorithms for comparing textual data, which makes it possible to
avoid discrepancies in the names of regions and industries, which are
characteristic of semi-structured data posted on the Internet.
Stage 5.
Intellectual
association of concepts (sectors of the economy and regions).
At this stage, fuzzy data
processing occurs for use in subsequent stages. A fuzzy linguistic portrait of
concepts is compiled using the duckduckgo.com search engine. As a result, for
example, it is possible to automatically establish a connection between such
concepts as "kozhuun" and "municipality".
Stage 6.
Formation
of intermediate data.
For each region, the types
of economic activities that have a comparative advantage are determined based
on the calculation of localization coefficients:
|
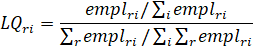
|
(1)
|
where
r
– region index,
 –
total number of employees by type of economic activity
i
in region
r,
–
total number of employees by type of economic activity
i
in region
r,
 – total number of employees in
region
r,
– total number of employees in
region
r,
 – total number of employees by
type of activity
i,
– total number of employees by
type of activity
i,
 – total employment.
Next, a matrix M is formed, the rows of which
are the regions, the columns are the types of economic activity. The matrix
element is equal to 1 if the industry localization coefficient in the region is
greater than 1, and equals 0 otherwise:
|

|
(2)
|
An additional binary matrix
S is also
formed,
the element of which
 is
equal to 1 if the number of people employed in the region in a certain industry
is included in 90% of the employed in the country. The need to introduce an
additional matrix is justified by the fact that those industries where there
are very few employed are excluded from consideration for a particular region.
Next, the Final matrix
N is formed
by element-by-element multiplication
of the elements of two matrices:
is
equal to 1 if the number of people employed in the region in a certain industry
is included in 90% of the employed in the country. The need to introduce an
additional matrix is justified by the fact that those industries where there
are very few employed are excluded from consideration for a particular region.
Next, the Final matrix
N is formed
by element-by-element multiplication
of the elements of two matrices:
|

|
(3)
|
Based on the data of the
final matrix N, vectors of diversity
 (how many industries of
specialization are in each region) and ubiquity
(how many industries of
specialization are in each region) and ubiquity
 (how many regions specialize in
each of the industries) of the distribution of industries among regions are
formed.
(how many regions specialize in
each of the industries) of the distribution of industries among regions are
formed.
Stage 7.
Calculation
of indices of complexity of regions.
For each region, the index of economic
complexity is calculated by finding the sum of the elements of the complexity
matrix
 by
row. The complexity matrix is obtained as a result of matrix multiplication of
the inverse diagonal matrix formed from the industry diversity vector
by
row. The complexity matrix is obtained as a result of matrix multiplication of
the inverse diagonal matrix formed from the industry diversity vector
 ,
and the matrix
,
and the matrix
 calculated
based on the final matrix and the diversity and ubiquity vectors:
calculated
based on the final matrix and the diversity and ubiquity vectors:
|

|
(4)
|
in this case, the matrix element
B is
calculated by the
formula:

Stage 8.
Calculation
of the maximum spanning tree.
Graph visualization is implemented according
to the following principles: firstly, all industries must be interconnected,
i.e. there should not be isolated activities in the graph, and secondly, the
graph should not be “overloaded” with a large number of edges. The first
principle is implemented by constructing the maximum spanning tree, i.e. a set
of connections that connects all the vertices of the graph using the minimum
number of edges and the maximum possible value of the connection strength
between the vertices. The maximum spanning tree is constructed using the
Kruskal algorithm. The second principle is implemented by imposing a limit on
the average number of edges per vertex of the graph: there should be no more
than 5 of them. Thus, we avoid excessive visual complexity of the graph.
Otherwise, the graph may overlap the most relevant connections.
Stage 9.
Construction
of the industry connectivity graph.
After calculating the complexity index, a
graph of connectivity of sectors of the national economy is constructed. The
graph visualizes the strongest links between sectors of the economy. The
vertices of the industry connectivity graph are the types of activities
according to OKVED, and the edges are the “distances” between them. The
“distance” between sectors is measured on the basis of the output matrix N and
is calculated as a minimum between the conditional probability of having a
comparative advantage in activity i, given that the region has a comparative advantage
in activity j, and the conditional probability of having a comparative
advantage in activity j, given identified comparative advantage in activity i:
|

|
(5)
|
The higher the value of "distance"
between industries, the stronger they are interconnected. As a result, taking
into account the above principles, a graph of connected industries is
constructed using the “neato” algorithm of the Graphviz software [53] (Fig.
5).
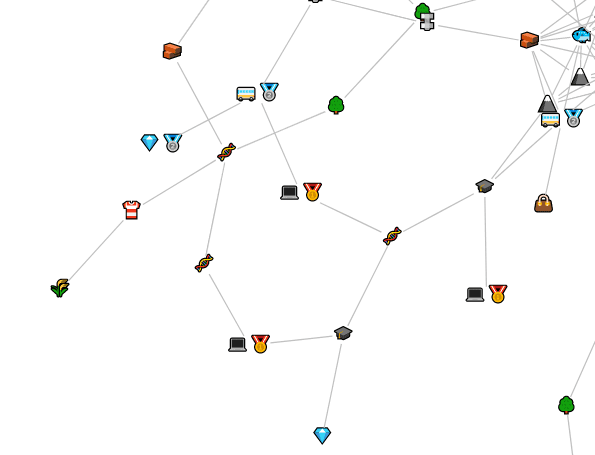
Fig. 5 - Fragment of the industry
connectivity graph
Stage 10.
Determining the place of the region in the
connectivity graph
The place of the region in
the industry connectivity graph is determined based on the data of the Final
Matrix and is visualized by highlighting those industries - graph vertices in
which the region specializes (Fig. 6).
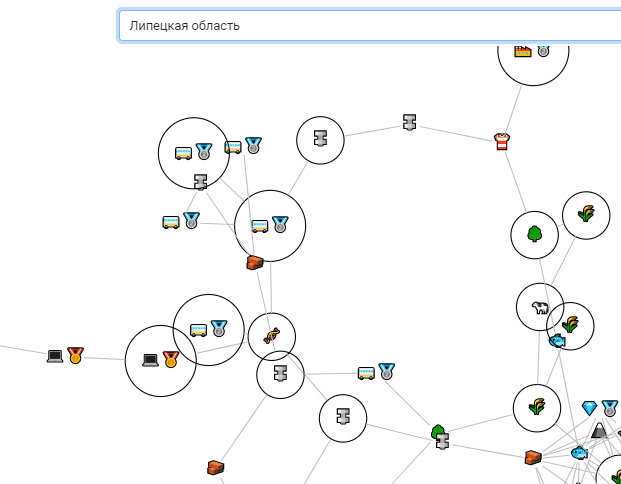
Fig. 6 - Connectivity graph for
the region (fragment)
On the connectivity graph for a region, those
vertices are tagged that correspond to the sectors of the economy expressed in
this region. These vertices are circled, for which the shape=circle tag is
added to the top of the graph in Graphviz notation.
Stage 11.
Simulation
modeling of the process of identification of macroregions
Conducting a simulation
experiment to find the optimal grid of macroregions implies the fulfillment of
the following conditions:
1.
The value of the Theil index is minimal (i.e., heterogeneity is
minimal between regions within a macroregion and between macroregions
themselves);
2.
Each of the regions included in the macroregion has a common
border with at least one region from the given macroregion;
3.
When a region is added to a macroregion, the economic complexity
index of the macroregion does not decrease;
4.
On the territory of the macroregion,
there are certain objects of social and engineering infrastructure based on the
author's methodology [54]. This condition will guarantee at least the
preservation of the existing population and, as a maximum, its positive
reproduction.
The experiment is carried out on the basis of
an analysis of the geographic connectivity of regions obtained from Internet
sources. Also used are the distances between the centers of the regions, the
calculated indices of the economic complexity of the regions and the
infrastructure facilities included in them (the presence of a port, a major
highway, healthcare facilities, etc.). The conditional core of the macroregion
is chosen as the next region of Russia in the list not included in the
macroregions, and having the most pronounced infrastructural complexity. It is
joined by regions that a) border it, b) increase the infrastructural and
economic complexity of education, and c) do not increase the value of the Theil
index. The process is iterative. As a result, such macroregion layout options
are selected for which the indicators of economic and infrastructural
complexity are maximum, but the Theil index is minimum.
In some cases, situations may arise when the
approach described above does not find potential candidates for inclusion in
the macroregion, and a “pseudo-macroregion” is formed, consisting of one
region. Then the second stage of the search and elimination of
"pseudo-macroregions" is implemented. At the same time, all possible
options for “pseudo-macroregions” and already formed macroregions are
considered, adding a “pseudo-macroregion” to a macroregion occurs provided that
the Theil index for a macroregion does not increase when it is combined with a
“pseudo-macroregion”. This also takes into account the geographical proximity
of the regions.
Based on the numerical values of the index of
complexity of the economies of the regions that form the macroeconomic region,
and the place of the region in the graph of connectedness of sectors of the
national economy, the potential for the emergence of related industries and
their further development in the macroregion is determined. This, in turn,
provides objective prerequisites for determining the prospect of macroregion
specialization.
As a result of the simulation experiment, the
optimal structure of economic zoning is determined, which is a digital twin of
the grid of Russia's macroeconomic regions.
Approbation of the algorithmization and
programming of territorial division based on interactive mapping was carried
out on the basis of statistical data of the constituent entities of the Russian
Federation, taking into account promising areas of interregional cooperation.
In the work, complexity indices were calculated for each subject of the Russian
Federation; a graph of connectivity of sectors of the national economy was
built and the place of each subject of the Russian Federation on the graph was
determined; the optimal structure of macroregions was determined on the basis
of the author's methodology. The approbation results are available in the
public domain (http://ruclusters.ru/spatial_development
[52]).
The digital twin of the optimal grid of
macroeconomic regions, based on interactive mapping, includes the following
elements: a drop-down list with the ability to select a region for analysis, a
graph of connectivity of sectors of the national economy, and an interactive geographical
map (рис.Fig. 7).
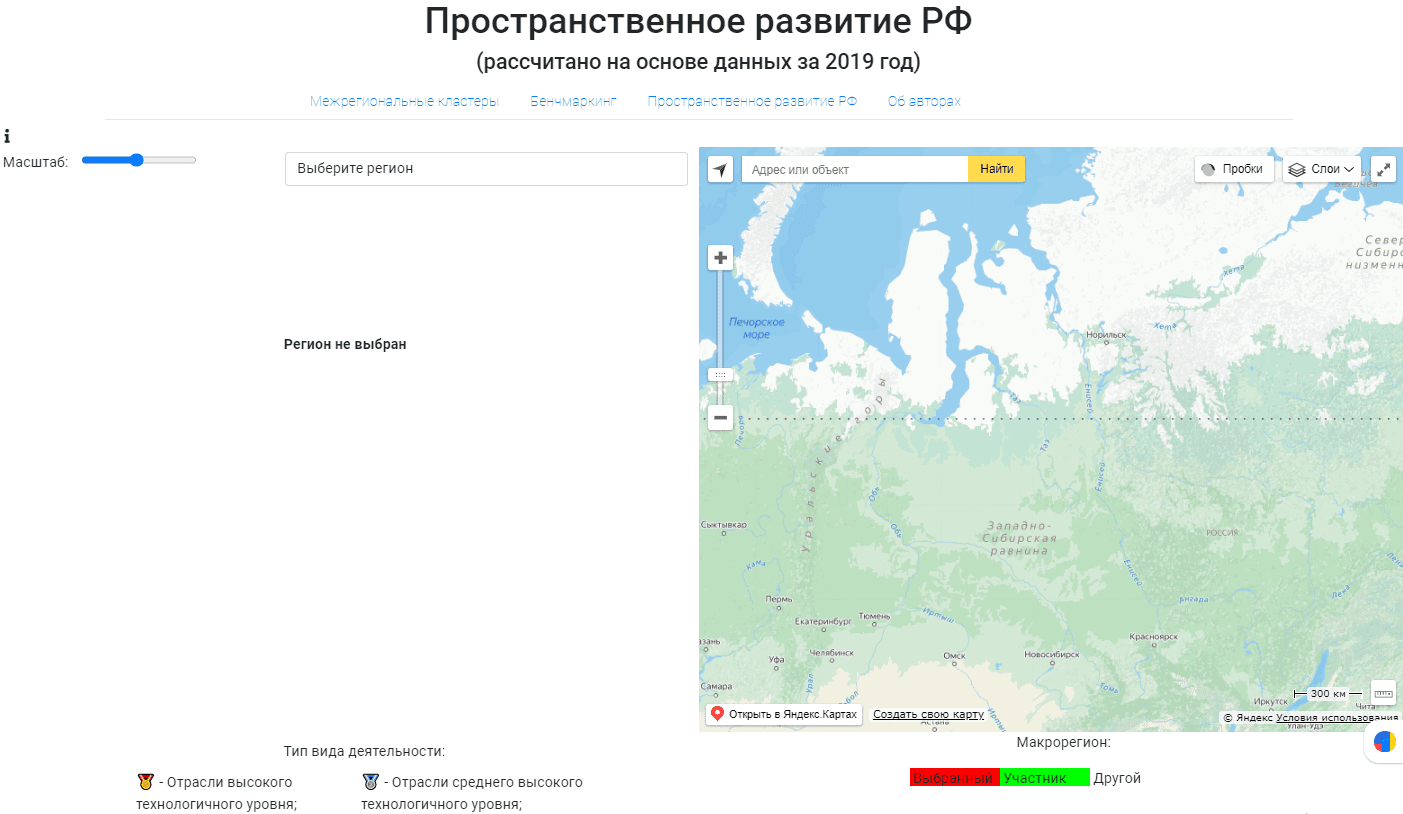
Fig. 7. General view of the web application
"Spatial Development of the Russian Federation"
After selecting a region for analysis, the
graph of connectivity of sectors of the national economy of the Russian
Federation is displayed in the left part of the application window. The graph
displays those types of activities in which the analyzed region has a
comparative advantage (localization coefficient is greater than 1).
The calculation was based on the indicator
“Average number of employees for the full range of organizations”, according to
which a single statistical database was formed for 83 regions of Russia for the
period from 2009 to 2019 for 104 types of economic activity (94,952 values in
total).
Thus, the graph contains 104 vertices that
have at least one connection with a neighboring vertex. In the center of the
graph are the most "difficult" industries. In the right part of the
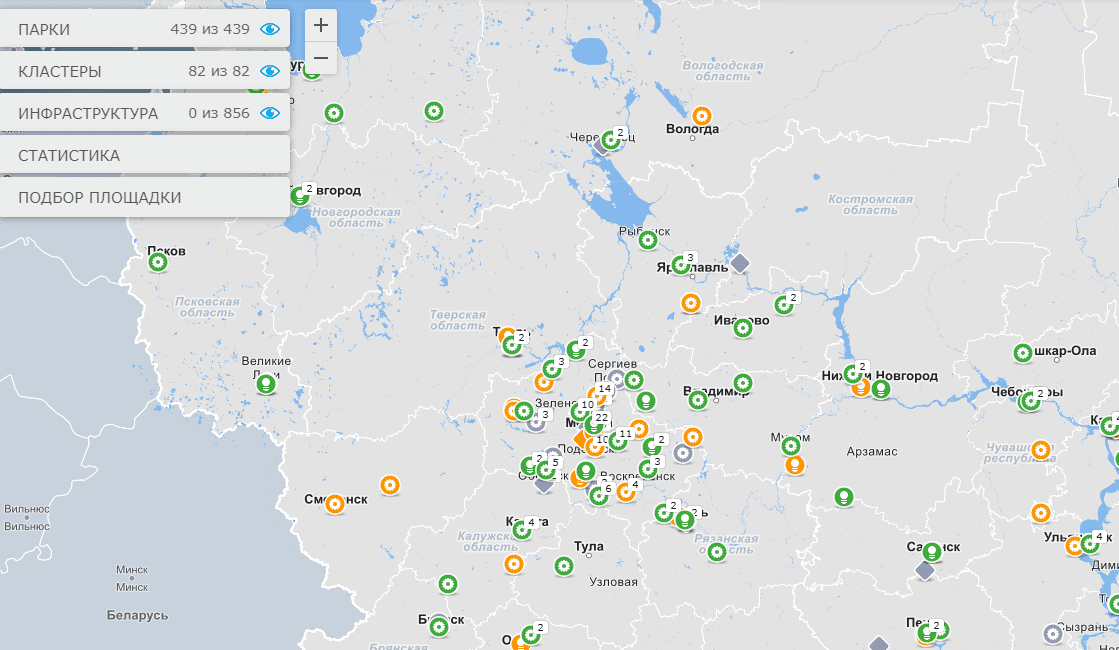
web application window, a geographic interactive map is displayed, on which the
analyzed region is highlighted in red, and the regions of the macroregion that
includes the analyzed region are highlighted in green (Fig. 8).
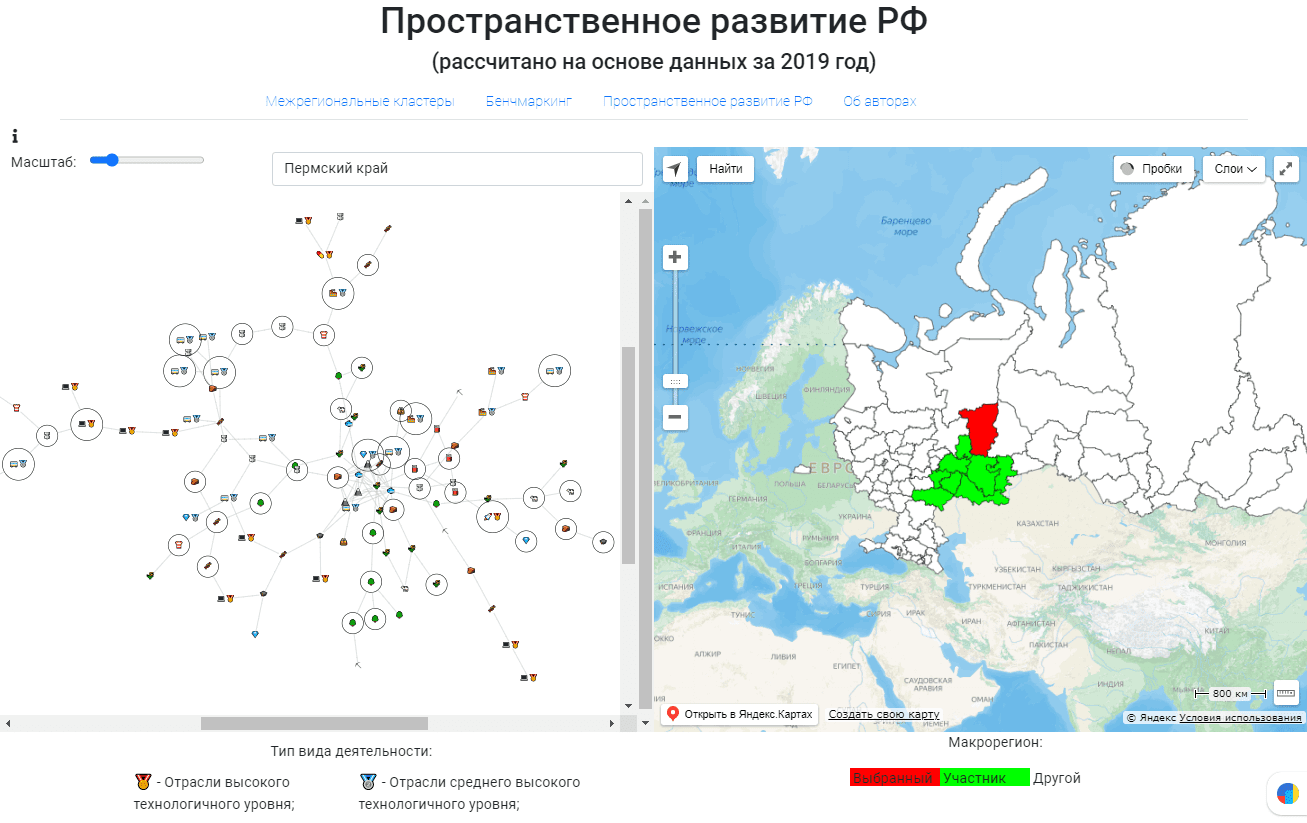
Fig. 8. Appearance of the web
application when choosing a region in the drop-down list
In addition, when you hover over any of the
vertices of the graph, a tooltip appears with the name of the type of activity,
and when you click on the vertex of the graph (selecting the type of activity),
the geographic interactive map displays in real time enterprises that
specialize in this type of activity (Fig. 9).
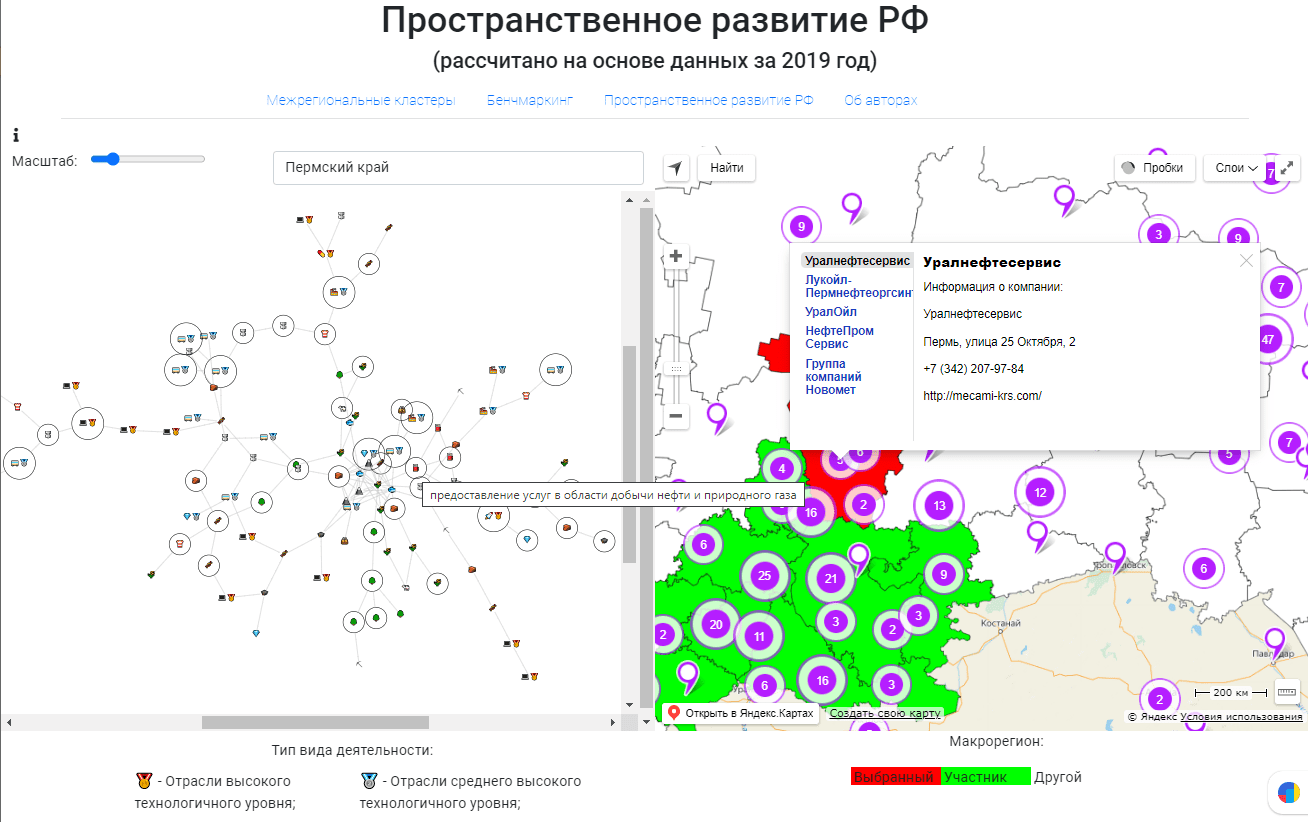
Fig. 9
Appearance of the web application when choosing the type of activity on the
graph of connected industries.
Based on the analysis of
the location of the regions of the Russian Federation in the graph of
connectivity of industries, it is possible to determine promising
specializations of macroregions in the national and global economy, the
development of which is carried out by embedding economic entities in the value
chains of the regions of the macroregion.
The paper presents a
technique for computer visualization of the problem of algorithmization and
programming of economic zoning based on interactive mapping. The
methodology
was based on the results of systematization
of
existing methods for visualizing
various grids of economic zoning and
the creation of digital twins,
as well as the
author's
simulation model for finding the optimal variant of territorial
division, taking into account promising interregional cooperation.
The basis for creating a digital twin of the
macroregion grid is a mathematical algorithm for the problem of territorial
division,
compiled on the basis
of the
concept of economic complexity
and graph theory.
At the same time,
graph visualization is implemented by constructing a
maximum spanning tree using the Kruskal algorithm.
The advantages of the
proposed visualization method are, firstly, that the results of economic zoning
in the form of macroregions
fully allow predicting the
behavior of economic entities, and therefore make it possible to make both
reasonable forecasts for the development of economic sectors and to form
adequate strategies for spatial development; secondly, the visual display of
modeling results using interactive mapping allows you to reflect all types of
economic activity and the relationships between them in an easy-to-read format,
i.e. in a format that is easy to understand for a wide audience.
The practical significance of the
web-application "Spatial Development of the Russian Federation" is
due to the potential for its use by the executive authorities of the federal
and regional levels in determining the directions of interregional interaction
in order to model the spatial organization of economic activity and predict the
behavior of the economic sectors in the national economy in order to increase
its growth rates. In addition, it is planned to
use
the evil approach to visualization of economic zoning
as the basis for
the development of a test bench of the RegScienceGRID digital research
platform, aimed at working with large regional data and using the most
promising open solutions from the machine learning technology stack.
The study was supported by the Russian Science Foundation grant No. 22-28-01674,
https://rscf.ru/project/22-28-01674/.
1.
Minakir P.A., Demianenko A.N. Prostranstvennaya ekonomika:
evolyutsiya podkhodov i metodologiya [Spatial economics: evolution of
approaches and methodology] // Prostranstvennaya ekonomika, № 2, 2010, pp.
6-32. [in Russain]
2.
Minakir P.A. "Strategiya prostranstvennogo
razvitiya" v interyere kontseptsiy prostranstvennoy organizatsii ekonomiki
[Spatial development strategy: a view from the concepts of spatial organization
in the economy] // Prostranstvennaya ekonomika, № 4, 2018, pp. 8-20 (doi:
10.14530/se.2018.4.008-020) [in Russian]
3.
Aleksandrov I.G. Ekonomicheskoye rayonirovaniye Rossii [Economic
zoning of Russia]. M.: Gosplan. 1921. [in Russian]
4.
Knipovich B.N. Selskokhozyaystvennoye rayonirovaniye [Agricultural
zoning]. M.: Novaya derevnya. 1925. [in Russian]
5.
Kolosovskiy N.N. Izbrannyye Trudy [Selected works]. Smolensk:
Oykumena. 2006. [in Russian]
6.
Baklanov P.Ya. O soderzhanii i «smyslakh»
sotsialno-ekonomicheskogo rayonirovaniya [On the content and
"meanings" of social-economic regionalization] // Geograficheskiy
vestnik. № 3, 2018, pp. 24–30. (doi: 10.17072/2079-7877-2018-3-24-30 7) [in
Russian]
7.
Gorbanev V.A. Kochurov B.I. Problemy territorialnogo
rayonirovaniya Rossii: natsionalnyye i mezhdunarodnyye aspekty [The problem of
territorial zoning of the russian federation: domestic and international
aspects] // Vestnik MGIMO-Universiteta, № 4, 2018, pp. 23–54 (doi:
10.24833/2071-8160-2018-4-61-23-54) [in Russian]
8.
Demianenko A.N. Ob ekonomicheskom rayonirovanii i
rayonoobrazovanii [On economic regionalization and formation of regions] //
Regionalistika, Vol. 5, № 6, 2018, pp. 5-17 (doi: 10.14530/reg.2018.6.5) [in
Russian]
9.
Smirnyagin L.V. Metodicheskiye podkhody k rayonirovaniyu v
obshchestvennoy geografii [Methodical approaches to regionalization in social
geography] // Vestnik Moskovskogo universiteta. Seriya 5: Geografiya, № 6,
2011. pp. 13-19 [in Russian].
10.
Shuvalov. V. E.
Rayonirovaniye v rossiyskoy sotsialno-ekonomicheskoy geografii: sovremennoye
sostoyaniye i napravleniya razvitiya [Regionalization in russian socio-economic
geography: development directions] // Regionalnyye issledovaniya, № 3(49),
2015, pp. 19-29. [in Russian]
11.
Nosonov A.M., Presnyakov V.N. Kurs
lektsiy po ekonomicheskomu rayonirovaniyu: elektronnoye uchebnoye posobiye [A
course of lectures on economic zoning: an electronic textbook]. Saransk: [b.i].
2011. [in Russian]
12.
Sharygin M.D., Stolbov V.A. Vvedeniye
v ekonomicheskuyu i sotsialnuyu geografiyu: uchebnoye posobiye dlya vuzov
[Introduction to Economic and Social Geography: a textbook for universities].
Moskva: Drofa. 2007. [in Russian]
13.
Kuznetsova O.V.
Alternativnyye podkhody k opredeleniyu roli makroregionov Rossii v sisteme
gosudarstvennogo upravleniya [Alternative approaches to specify the role macro-regions
of russia in the system of public administration] // Federalizm, № 4, 2019, pp.
112–125. [in Russian]
14.
Bogacz M. Why does the EU need
macroregions? Comparative analysis based on the theoretical explanation and a
survey of the enforcement of the EU’s Strategy for Baltic Sea Region and the
Strategy for the Danube Region. Master’s Thesis Aalborg University, 2011.
[Electronic resource].
URL:
https://studylib.net/doc/7238159/why-does-the-eu-need-macro
15.
Dubois A., Hedin S., Schmitt P,
Sterling J. EU macro-regions and macro-regional strategies - A scoping study //
Nordregio Electronic Working Paper 4, 2009.
16.
Dühr S. Baltic Sea, Danube and
Macro-Regional Strategies: A Model for Transnational Cooperation for the EU? //
Notre Europe, Studies and Research, No. 86, 2011, 72 p.
17.
Schymik C. Blueprint for a
macro-region. EU Strategies for the Baltic Sea and Danube regions // SWP
Research Paper 2011/RP 10, 2011, 31 p.
18.
Servis dlya poiska informatsii po baze
slovarey entsiklopediy [Service for searching information on the database of
dictionaries encyclopedias].
[Electronic
resource].
URL:
https://dic.academic.ru/dic.nsf/ruwiki/641413
[in Russian].
19.
Nadyrov I.O. Opisaniye
kontseptsii interaktivnoy karty [Description of the interactive map concept] //
Vestnik Sibirskoy gosudarstvennoy geodezicheskoy akademii, № 1(14), 2011, pp.
62-68. [in Russian].
20.
Voosen P. Europe is building a
‘digital twin’ of Earth to revolutionize climate forecasts // Science Magazine,
2020.
[Online].
URL:
https://www.sciencemag.org/news/2020/10/europe-building-digital-twin-earth-revolutionize-climate-forecasts
21.
Virtual Singapore // National Research
Foundation. Prime Minister’s Office Singapore
https://www.nrf.gov.sg/programmes/virtual-singapore
22.
Jones D., Snider C., Nassehi A., Yon
J., Hicks B. Characterising the Digital Twin: A systematic literature review //
CIRP Journal of Manufacturing Science and Technology, Vol. 29, Part A, 2020, p.
36-52, DOI: https://doi.org/10.1016/j.cirpj.2020.02.002.
23.
Kshetri N. The Economics of Digital
Twins // IEEE Computer, 54(4), 2021, pp. 86-90, DOI:
http://www.doi.org/10.1109/MC.2021.3055683.
24.
Kokorev D.S., Yurin A.A.
Tsifrovyye dvoyniki: ponyatiye, tipy i preimushchestva dlya biznesa [Digital
twins: concept, types and benefits for business] // TECHNICAL SCIENCE /
Colloquium-journal, № 10(34), 2019, pp. 31-35 [in Russian].
25.
Wan L., Nochta T., Schooling J. M.
Developing a city-level digital twin – propositions and a case study //
International Conference on Smart Infrastructure and Construction 2019 (ICSIC):
Driving data-informed decision-making, 2019, pp. 187-193.
26.
Solovyeva T. V. Idei
ekonomicheskogo rayonirovaniya v istoricheskoy retrospective [Ideas of economic
zoning in historical retrospect] // Izvestiya Uralskogo gosudarstvennogo
universiteta. Seriya 2: Gumanitarnyye nauki, Vol. 49, № 13, 2007. pp. 153-162.
[in Russian].
27.
Smirnyagin L.V. Metodicheskiye
podkhody k rayonirovaniyu v obshchestvennoy geografii [Methodical approaches to
regionalization in social geography] // Vestnik Moskovskogo universiteta.
Seriya 5. Geografiya. № 6. 2011. pp. 13–19.
28.
Ekonomicheskiye rayony Rossii
[Economic regions of Russia]. (https://geostudy.ru/economicregions.html)
[in Russian]
29.
Gorbanev V. A., Kochurov
B.I. Problemy territorialnogo rayonirovaniya Rossii: natsionalnyye i
mezhdunarodnyye aspekty [The problem of territorial zoning of the russian
federation: domestic and international aspects] // Vestnik MGIMO Universiteta,
№ 4(61), 2018, pp. 23-54 (doi: 10.24833/2071-8160-2018-4-61-23-54) [in Russian]
30.
Vishnevskiy D.S.,
Demianenko A.N. Makroekonomicheskoye zonirovaniye kak metod strategicheskogo
analiza: Dalniy Vostok Rossii [Macroeconomic Zoning as a Method of Strategic
Analysis: The Russian Far East] // Prostranstvennaya ekonomika, № 4, 2010, pp.
6-31. [in Russian]
31.
Bekuzarova N.V.,
Shumovskiy O.I. Ispolzovaniye interaktivnoy karty dlya formirovaniya
istoricheskikh znaniy [Using of an interactive map for forming historical
knowledge] // International Journal of Advanced Studies, Vol. 8, № 4, 2018, pp.
22-36 (doi: 10.12731/2227-930X-2018-4-22-36) [in Russian]
32.
Official website of the European
Commission. Macro-Regional Strategies.
[Electronic
resource].
URL:
https://ec.europa.eu/regional_policy/en/policy/cooperation/macro-regional-strategies/
33.
Official website of the European
Commission. The Territorial State and Perspectives of the European Union. 2011.
Background document for the Territorial Agenda of the European Union 2020.
[Electronic resource].
URL:
https://ec.europa.eu/regional_policy/sources/policy/what/territorial-cohesion/territorial_state_and_perspective_2011.pdf
34.
Seliverstov V.E. Regionalnoye
strategicheskoye planirovaniye: ot metodologii k praktike [Regional strategic
planning: from methodology to practice.]. Novosibirsk: IEOPP SO RAN, 2013. [in
Russian]
35.
Dubrovskaya J. V.,
Kozonogova E. V. The impact of digitalization on the demand for labor in the
context of working specialties: Spatial analysis // Вестник
Санкт-Петербургского университета. Экономика, Vol. 37, № 3, 2021, рр. 395–412
(doi: 10.21638/spbu05.2021.302) (https://doi.org/10.21638/spbu05.2021.302).
36.
Balina T.A., Nikolayev
R.S., Osorgin K.S., Ponomareva Z.V., Stolbov V.A., Chekmeneva L.Yu. Evolyutsiya
nauchnykh podkhodov k rayonirovaniyu Permskogo kraya: teoreticheskiye i
metodologicheskiye aspekty [Evolution of scientific approaches to the zoning of
perm krai: theoretical and methodological aspects] // Geograficheskiy vestnik,
№ 3(58), 2021, pp. 45-62 (doi: 10.17072/2079-7877-2021-3-45-62) [in Russian]
37.
Investments for
growth & jobs. Promoting development and good governance in EU regions and
cities / 6th Report on economic, social and territorial cohesion, July 2014.
[Electronic resource].
URL:
https://www.abs.gov.au/statistics/standards/australian-statistical-geography-standard-asgs-edition-3/jul2021-jun2026/access-and-downloads/abs-maps
38.
Fan, Jie & Wei, Sun
& Zhou, Kan. Major Function Oriented Zone: New method of spatial regulation
for reshaping regional development pattern in China // Chinese Geographical
Science, № 22, 2012 (doi: 10.1007/s11769-012-0528-y).
39.
Karta klasterov RF [Map of clusters of
the Russian Federation].
[Electronic resource].
URL:
https://map.cluster.hse.ru/
40.
Geoinformatsionnaya sistema
industrialnykh parkov, tekhnoparkov i promyshlennykh klasterov [Geoinformation
system of industrial parks, technoparks and industrial clusters]. (https://gisp.gov.ru/gisip/)
41.
Official website of the Measure of
America. Measure of America: A Program of the Social Science Research Council
[Electronic resource].
URL:
https://measureofamerica.org/maps/?cd%5Eage_pyramid_total%5Eall_all%5EDemographics%5Edemographics
42.
Official website of the Statistics
Canada. Geography - Find information by region or area
[Electronic resource].
URL:
https://www150.statcan.gc.ca/n1/en/geo?geocode=A000261&subject_levels=32&geotext=Northwest%20Territories%20%5BTerritory%5D
43.
Official website of the Statistics New
Zealand. New Zealand STATLAS
[Electronic
resource].
URL:
https://maps-by-statsnz.hub.arcgis.com/
44.
Official website of the European
Statistical Office. Statistical atlas
[Electronic
resource].
URL:
https://ec.europa.eu/statistical-atlas/viewer/
45.
Official website of the Australian
Bureau of Statistics. ABS Maps
[Electronic
resource].
URL:
https://www.abs.gov.au/statistics/standards/australian-statistical-geography-standard-asgs-edition-3/jul2021-jun2026/access-and-downloads/abs-maps
.
46.
Hidalgo C., Klinger B., Barabasi
A.-L., Hausmann R. The product space conditions the development of nations //
Science, Vol. 317 (5837), 2007, pp. 482–487.
47.
Hidalgo C., Hausmann R.
The building blocks of economic complexity // Proceedings of the National
Academy of Sciences of the USA, № 106 (26), 2009, pp. 10570–10575.
48.
Hausmann, R., Hidalgo, C., Bustos, S.,
Coscia, M., Simoes, A., & Yildirim, M. The Atlas of Economic Complexity:
Mapping Paths to Prosperity. Massachusetts Institute of Technology and Center
for International Development, Harvard University. 2013.
[Electronic resource].
URL:
https://books.google.ru/books?id=cp-NAgAAQBAJ&redir_esc=y.
49.
Balland P.A., Boschma R., Crespo J.,
Rigby D.L. Smart specialization policy in the European Union: relatedness,
knowledge complexity and regional diversification // Regional Studies, Vol. 53
(9), 2019, pp. 1252–1268.
50.
Kryukov, V.A. Izucheniye voprosov
prostranstvennogo razvitiya v kontekste evolyutsionnogo podkhoda [Studying the
issues of spatial development in the context of the evolutionary approach] //
Speech at the XVIII autumn conference of young scientists, Novosibirsk, 2022
[in Russian].
51.
Dubrovskaya J., Kozanogova E. Modeling
the spatial development of the economy on the basis of perspective
interregional cooperation and specialization // Proceedings of the 14th
international management conference“Management Sustainable Organizations” 5th–
6th November, 2020, Bucharest, Romania, pp.1040-1052. DOI:
10.24818/IMC/2020/05.14.
52.
Prostranstvennoye razvitiye RF
[Spatial development of the Russian Federation] [Electronic resource]. URL:
http://ruclusters.ru
[in Russian].
53.
Vizualizatsiya grafov «Graphviz»
[Visualization of graphs "Graphviz"] [Electronic resource]. URL:
https://www.graphviz.org/
54.
Dubrovskaya, J., Kozonogova, E.,
Pestereva, T. Evaluation of the State Strategy of Spatial Development
Effectiveness of the Russian Federation: A Cluster Approach/ Eurasian Economic
Perspectives : Proceedings of the 28rd Eurasia Business and Economics Society
Conference. Coventry. UK, 2019, pp. 131-140.
