This
paper continues a series of publications of the authors’ research materials in
the field of visualization and visual analytics in control of a generalized
computational experiment (GCE). The GCE is understood as multiple solution of
the direct or inverse problem of numerical simulation for different sets of
values of model defining parameters [1]. Such an approach makes it possible to
immediately obtain a solution for a certain class of mathematical modeling
problems specified in a multidimensional space of defining parameters, which in
turn makes it possible to simultaneously study the influence of several
parameters on the model characteristics of interest, including their joint
influence in various combinations of change ranges.
Carrying
out a GCE with subsequent analysis and interpretation of its results is a very
resource-intensive task, which is associated with the need to process large
volumes of multidimensional data. M\oreover, it is not possible to conduct an
experiment with all possible combinations of models and simulation parameters.
Therefore, it is necessary to resort to GCE planning, that is formation of a
specific scenario for its implementation taking into account available
computing resources and time.
In
[2], a model for managing a GCE was proposed based on GCE planning with the
possibility to dynamically adjust the plan during the experiment. The GCE plan
is understood as a sequence of single computational experiments to be carried
out for a given multidimensional array of simulation parameter values with
selected methods for analyzing and interpreting the results of the experiment.
The advantage of the dynamic GCE planning is the possibility of reducing the
volume of insufficiently effective experiments and, on the contrary, providing
a more detailed experimental study of those ranges of input data values and
defining model parameters that require confirmation and refinement of the
patterns found, or rechecking the experimental results if they do not
correspond to expected patterns.
In
accordance with [2], the general principle of constructing a dynamic GCE plan
can be described as follows: based on a series of experiments for a certain set
of values of input parameters and processing its results, together with the
results of previous series of experiments, current GCE state is fixed. The generalized
computational experiment state is determined by a set of computational
experiments already carried out and is specified by a multidimensional array of
experimental data obtained with the current partition of the space of defining
parameters, by a set of generalized indicators obtained as a result of processing
this array, as well as by a set of patterns identified on the basis of analysis
and interpretation of these indicators. The GCE state is subjected to analysis
in which indicators are evaluated that determine the effectiveness of the
experiment, in the researcher’s opinion. Based on the results of this analysis,
the researcher adjusts the space partition of the defining parameters, refines
and corrects other conditions if necessary, and proceeds to a new series of
computational experiments.
In
paper [3], an approach to assessing the GCE state was proposed and studied
based on visualization of experimental data specifying it, followed by analysis
of the resulting set of visual images. Construction of a visual map of a
generalized computational experiment was considered as a visualization method.
The GCE visual map is understood as a set of interrelated visual images that
characterize the GCE state and are arranged in accordance with certain rules.
At the same time, in the mentioned paper, mainly two-dimensional visual images
were considered, and proposed methods for constructing a visual map were
limited to various ways of arranging visual images. This approach to a large
extent limits visualization of relationships both between single computational
experiments that make up the GCE, and between GCE states at different stages of
its implementation. Nevertheless, it is these two types of visualization that
are most conducive to identifying input data areas where model correction is
required, as well as to detecting patterns that may require additional
computational experiments with new sets of parameters to confirm and refine
them.
This
paper proposes an extension of the existing approach to building visual maps of
a generalized computational experiment by using visualization metaphors that
can display not only individual images but also their relationships. The
problem of constructing GCE visual maps focused on visualizing relationships
between single computational experiments in three-dimensional space, and
analyzing the GCE state using this type of visual maps, is considered.
In
view of the foregoing, the extension of the approach to construction of visual
maps of a generalized computational experiment is possible in the following
directions:
1.
Visualization of relationships between single computational experiments, each
of which is carried out for a given model and some fixed set of values of its
defining parameters. In this case, the relationship between single
computational experiments can be considered as some relation between the values
or groups of values of a set of defining parameters (or some of its subsets).
The resulting visual map sets a visual image of the GCE state and can be used
both to assess the effectiveness of the state as a whole and the impact of
various combinations of defining parameters on the resulting GCE indicators.
2.
Visualization of relationships between GCE states at different stages of its
implementation. With this approach, the relationship can determine a certain
transition from one variant of space partitioning of defining parameters to
another, carried out by expanding or adjusting it. In particular, the relationship
can set the rules for such a transition. This visualization problem is more
complex, but the resulting visual map makes it possible to analyze dynamics of
changes in GCE states, as well as to visualize various scenarios for its
implementation.
In
this paper, we will consider the first problem – construction of a GCE visual
map with visualization of relationships between single experiments. At the same
time, we note that its solution also creates the basis for solving the second
problem, since the applied approaches and visualization methods can be further
expanded and adapted to visualize links between GCE states.
Let
us perform the necessary formalization of the concepts related to the GCE based
on the formal representation of a GCE introduced earlier in [2], refining and
concretizing it in the context of the visualization problem being solved.
Let
M
= {
m1,
m2, …,
mNm
}
be a set of models on which the GCE is carried out, where
Nm
is the number of models;
P
= {
p1,
p2, …,
pNp
}
is a set of model defining parameters (we assume that this set is the same for
all models from the set
M), where
Np
is the number of
defining parameters.
Each
single computational experiment within the GCE framework is carried out for a
given model and a fixed combination of values of the defining parameters
belonging to the set
P. Accordingly, for each parameter
pk
(k
= 1, …,
Np) an ordered set of values
Vk
= (pk,1,
pk,2, …,
pk,
nk)
is specified, for which computational experiments are carried out. Here
pk,
j
are specific chosen values of the parameter
pk,
j
= 1, …,
nk,
where
nk
is the number of such values for the parameter
pk.
In the simplest case, for the numerical parameter
pk, the set
Vk
can be a set of equidistant points within the selected
range of parameter values.
In
this case, situations are possible when, for individual combinations of values
of the defining parameters, computational experiments are not carried out or
are not carried out on all models. Thus, each model
mi
∊
M
is associated with a space partition of the defining parameters:
V
(mi) = (V1
×
V2
× …
VNp) ∩
Qi,
where
Qi
is restrictions on admissibility of combinations of values of the defining
parameters imposed by the model
mi
(i
= 1, …,
Nm).
Any
point belonging to this partition specifies a certain combination of values of
the defining parameters for which the computational experiment is carried out:
(vi)
t
= (p1,
t
1,
p2,
t
2, …,
pNp,
tNp),
pk,
tk
∊
Vk,
provided that (p1,
t
1,
p2,
t
2, …,
pNp,
tNp)
∊
Qi.
The
total number of such combinations for the model
mi
will be
denoted by
Ti.
Further,
let
С
= {
с1, с2, …,
с
N
с
}
be a set of output parameters of the experiment, which can be generalized
indicators that are the results of processing primary experimental data [4, 6],
N
с
is the
number of output parameters.
Thus,
the single computational experiment conducted for the model
mi
and a fixed combination of values of the defining parameters (vi)
t
is given by the set:
|
E =
< mi,
(vi)
t,
С
(mi, (vi)
t) >,
|
(1)
|
where
С
(mi, (vi)
t) =
(сl
(mi, (vi)
t) |
l
= 1, …,
Nс)
is an
ordered set (vector) of values of the output parameters obtained as a result of
the experiment for the given model and combination of values of the defining
parameters.
Accordingly,
the state of the GCE can be specified by combining sets (1) for all possible
models and combinations of values of the defining parameters:
|
EGEN
=
{ <
mi, (vi)
t,
С(mi, (vi)
t) >
|
i
= 1, …,
Nm
;
t
= 1, …,
Ti
}.
|
(2)
|
As
an example, let us consider the GCE, which was carried out to assess the
accuracy of OpenFOAM platform solvers when modeling a three-dimensional problem
of inviscid flow around a cone [4] (in the terminology of OpenFOAM, solvers are
software modules that implement various numerical models of mechanics of continua
[5]). Solvers rhoCentralFoam, pisoCentralFoam, sonicFoam were used as models.
The defining parameters of the models (set
P) are: the Mach number (Ma,
a dimensionless quantity), the cone half-angle (Betta, in degrees) and the
angle of attack (Angle, in degrees). The output parameters of computational
experiments (set
C) are the results of calculating the norms L1 and L2
of deviation of the numerical solution from the analytical one.
The
following ordered sets of values of the defining parameters were chosen as
Vk:
V1
= (3, 5, 7);
V2
= (10, 15, 20);
V3
= (0, 5, 10). At the same time, for
the combination of the half-angle equal to 10° and the angle of attack equal to
10°, no computational experiments were carried out. Accordingly, for all
models, the sets
V
of possible combinations
vt
coincide
and contain 24 ordered triples of elements belonging to sets
Vk:
v1
= (3, 10, 0);
v2
= (3, 10, 5);
…;
v24
= (3, 20, 10).
The
generalized representation of the GCE state in the form (2) for this example
takes the following form:
{
mi,
vt, L1(mi,
vt), L2(mi,
vt) |
mi
∊
M;
t
= 1, …, 24 },
where
M
= { rhoCentralFoam,
pisoCentralFoam, sonicFoam }.
Let
us say that two single computational experiments are interconnected if there is
some relationship between the combinations of the values of the defining
parameters (vi)
t
for some fixed model
mi,
or between the combinations “model – values of the defining parameters”. The
possible structure of this relationship, as well as its interpretation, is
largely determined by the structure of a specific GCE and the content of the
tasks of analyzing its results that the researcher faces. However, we can
consider general relationships that can be used to describe and analyze a wide
class of computational experiments [7–10]. The following two situations can
serve as examples of such relationships:
1)
experiments are carried out with different models for the same values of the defining
parameters;
2)
experiments are carried out for one model, while the values of all defining
parameters coincide, except for one, the values of which are adjacent in an
ordered set. Combinations of values of the defining parameters that satisfy
this condition will be called adjacent in what follows.
In
the considered GCE for assessing the accuracy of solvers, examples of adjacent
combinations of values of the defining parameters are combinations (3, 10, 0)
and (3, 10, 5) or combinations (7, 15, 5)
and (7, 15, 10).
Binary
relations can be used to formalize relationships between single computational
experiments. These relations can be both symmetric (for example, in cases where
the fact of adjacency of two combinations of values of the defining parameters
is simply established) and antisymmetric (if, for example, in addition to this,
adjacent values are compared).
In
addition to establishing the presence or absence of a relationship between
single experiments, one can also evaluate the degree of its intensity, that is
strength. Conceptual interpretation of the relationship strength, as well as
the relationship itself, largely depends on the tasks facing the researcher and
the methods used to analyze and interpret the GCE results.
In
the example with the
GCE
for
assessing solver accuracy,
one of the possible options for
interpreting the strength of the relationship between single experiments is the
degree of closeness of the relationship between the values of the error magnitudes
L1 and L2 obtained for different solvers with adjacent combinations of values
of the defining parameters. This indicator can be estimated using a correlation
coefficient, and it can be considered as a kind of measure of sensitivity of numerical
calculation result deviations from the analytical solution with small changes
in the defining parameters. Low values of this indicator for adjacent
combinations of parameters may indicate both errors in experiments and the need
for a more detailed study of the corresponding range of values of the defining
parameters.
Based
on the foregoing, the GCE state taking into account the relationships between
single experiments can be represented in the form of a graph model. In this
case,
the
construction of a visual map of the GCE is reduced to
the visualization of the corresponding graph on a plane or in space.
The
weighted
graph
corresponding to the GCE state taking into account
the relationships between single experiments allows the following formal
representation, which we will call
the GCE visual map prototype:
Here
E
= {
E1,
E2, …,
ET
}
is a set of vertices, each of which corresponds to a single computational
experiment specified in the form (1). The cardinality
T
of this set,
that is the total number of single experiments carried out within the framework
of the GCE, corresponds to the total
number
of
allowable combinations of values of the defining parameters for all models,
that is
 .
.
Here
W
is a set of edges, each of which is determined by the relationship strength
between the corresponding vertices, that is
W
= {
wst
|
s,
t
= 1, …,
T
}.
In
general, the range of values for
wst
depends on the method of
their calculation and the way of interpretation, while the value
wst
= 0
corresponds to the absence of a relationship. To adjust the visual display of
the graph, it is also possible to normalize these values in order to bring them
to a certain range of values.
A
visual analysis of the GCE state is often carried out under some additional
visualization conditions that set restrictions on the models under
consideration, as well as ranges of values of the defining parameters and sets
of values of the output parameters. Examples of such conditions are:
1)
to
build a GCE visual map for some fixed model
mi;
2)
to
build a GCE visual map for some subset of the defining parameters
PVIS
⊂
P
with fixed values or ranges of values of the remaining defining parameters;
3)
to
build a GCE visual map for some subset of the output parameters
CVIS
⊂
C
(other output parameters are not involved in the visualization).
Various
combinations of the above conditions are also possible.
The
fulfillment of conditions 1 and 2 is ensured by adjusting the visual map
prototype (3) by selecting from the set of vertices
E
of a subset
corresponding to the selected model and/or fixed values of the defining
parameters that do not belong to the
PVIS
subset. The
fulfillment of condition 3 is ensured by reducing the set (1) by excluding from
it the values of the output parameters that do not belong to the
CVIS
set, and by correspondingly adjusting the set
E
in the visual map
prototype (3).
Let a graph be
given that corresponds to the GCE visual map prototype (3), for which
adjustments are made taking into account the specified additional visualization
conditions. To build a visual image of this graph in three-dimensional space,
we use an approach based on the concept of a visualization metaphor. This
approach was proposed in [11] and developed in the context of graph model
visualization in [12]. In general, the visualization metaphor is a set of
principles for transferring characteristics of the object under study into the visual
model space. It includes two components: a
spatial metaphor
that
determines the characteristics of the visualization space and the principles
for placing visual model elements in this space, and a
representation
metaphor
that determines characteristics of the visual model in order to visualize
certain properties of the object under study, the most significant at the
current stage of its analysis.
With regard to the
prototype graph under consideration, the spatial metaphor specifies location of
the vertices and edges of the graph in a three-dimensional space, and its basis
is various methods of spatial tiling of graphs. Considering the graph structure
(3), it can be seen that in the case of a fixed model and the number of
variable defining parameters (that is the cardinality of the subset
PVIS)
equal to 3, the spatial tiling is reduced to constructing a rectangular grid in
the three-dimensional space, the nodes of which correspond to the values of the
variable defining parameters belonging to the associated sets
Vk.
With a larger number of variable defining parameters, application of more
complex tiling algorithms is required [13,
14].
The result of
applying the spatial metaphor is a spatial arrangement of the graph (this term
was proposed in [15]). Further, the representation metaphor is applied to the
spatial arrangement, which forms visual images of both individual vertices and
edges of the graph (that is single computational experiments and relationships
between them), and the graph as a whole (that is the GCE state taking into
account additional visualization conditions). If within the framework of the
spatial metaphor, combinations of values of the defining parameters and the
relationships between them are mainly taken into account (this is the
information that is used when forming the graph tiling), then within the
framework of the representation metaphor, the main role belongs to the values
of the output parameters of the experiment, since they create a visual image.
In accordance with
the representation metaphor, the visual image of a single computational
experiment, that is graph vertices, is determined by the following components:
– coordinates (x,
y, z) obtained as a result of applying a spatial metaphor;
– a set of visual
features, among which let us highlight the main ones:
Shape;
Size;
Color, as well as additional ones, such as color saturation,
orientation, texture, gradient, and others.
To build a visual
image of a single experiment, it is necessary to prepare data, which consists
in transition from the structure of the form (1) to the dependence of the
following form:
|
F
(x,
y,
z) = <
Shape,
Size,
Color, … >,
|
(4)
|
where each visual feature specifies the
value of its associated output parameter belonging to the subset
CVIS.
In this case, if the number of output parameters involved in the visualization
(that is the cardinality of the subset
CVIS) exceeds 3, then
additional visual features are involved (in formula (4), this corresponds to
the ellipsis). If their number is less than 3, then some subset is selected
from the set of visual features, and the features included in it vary, while
the rest receive fixed values.
Visual image of
the relationship between single experiments, that is edges of the graph, is
determined by the following components:
– geometric
characteristics of visual images of vertices connected by an edge –
coordinates, size, orientation, and others;
– its own set of
visual features, which, just as in the case of vertices, include shape, size,
and color, but in this case, the shape is usually fixed, the size (thickness)
can correspond to the relationship strength, and the color – to its sign.
A tool in the form
of an interactive software system has been created to construct and analyze
three-dimensional visual maps of the GCE. The developed system allows loading
pre-prepared data that specify information about the GCE state and, on their
basis, builds a three-dimensional visual map of the GCE in accordance with the
considered visualization metaphor. At the same time, navigation on the
constructed visual map in an interactive mode is supported. The system was
developed using the Microsoft .Net platform, the C# programming language, and
the SharpGL library. The software system interface is shown in Figure 1.
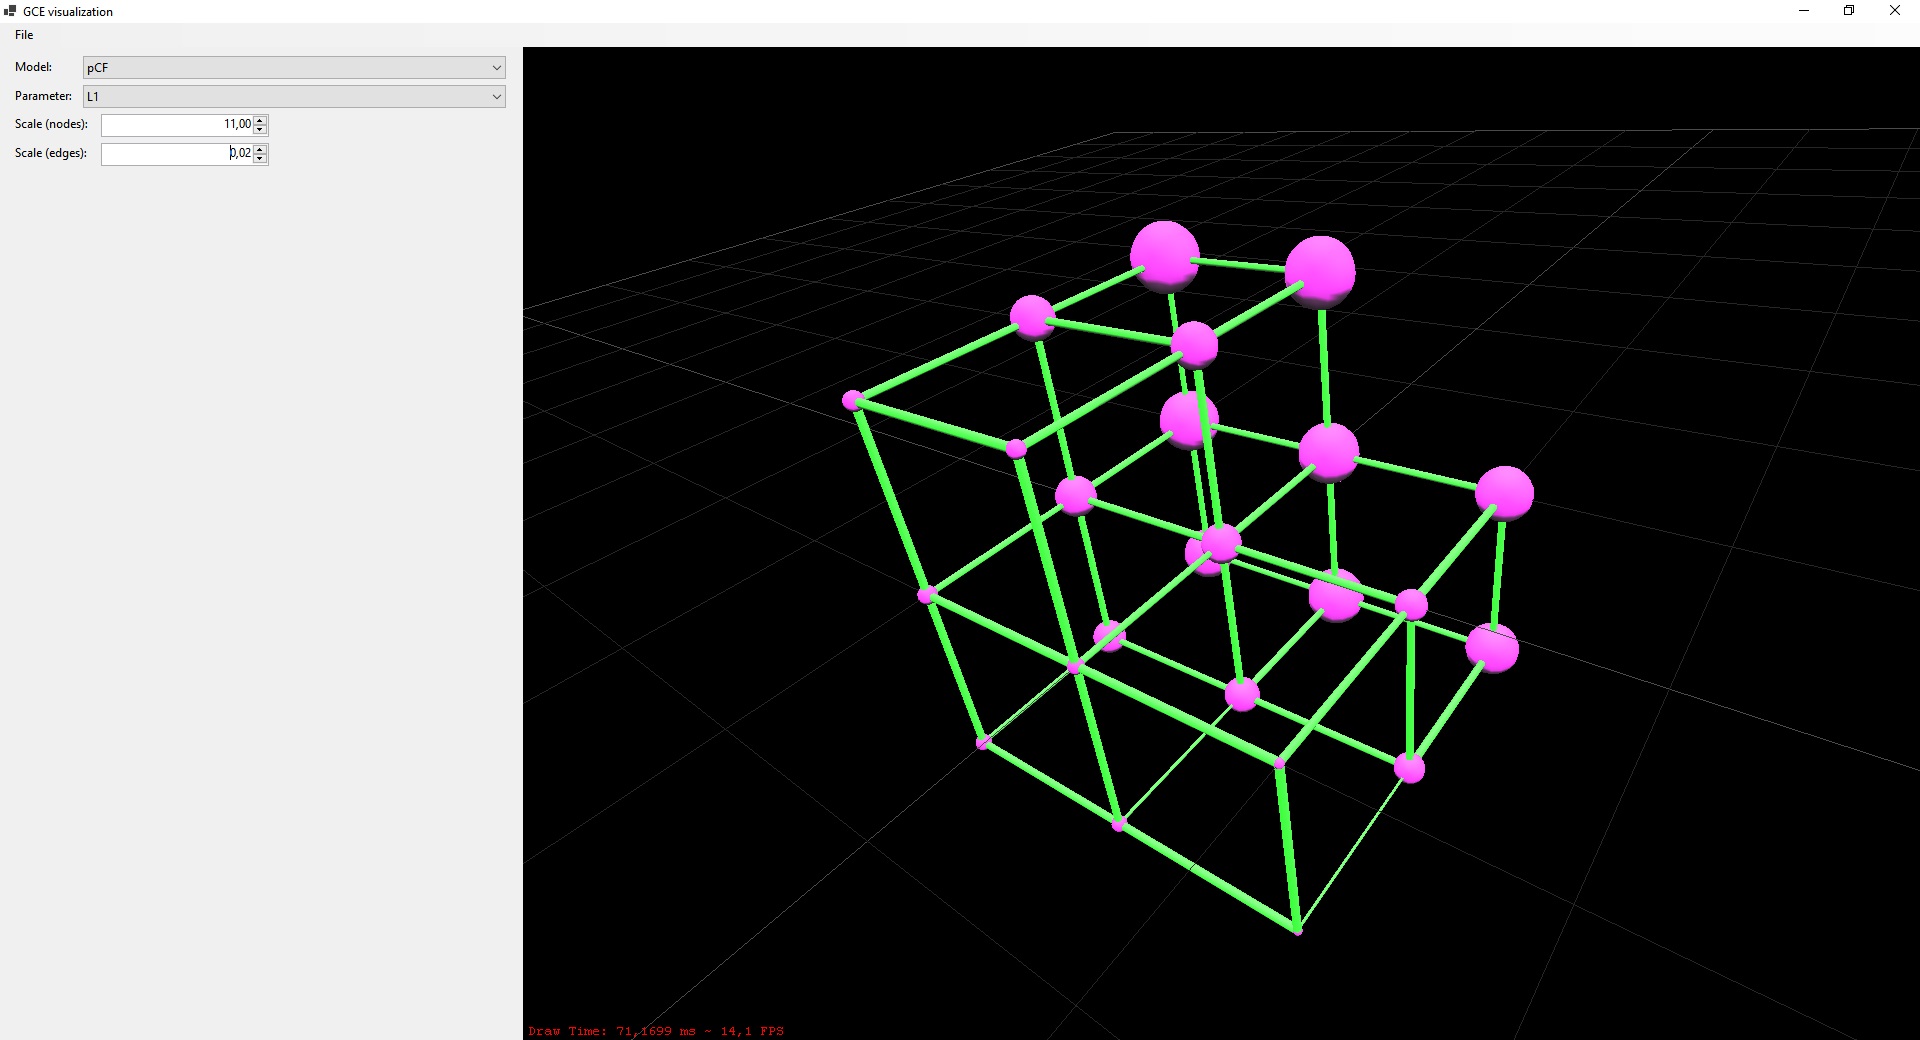
Figure 1 – Interface of the software
system for constructing and analyzing three-dimensional visual maps of GCE
The software
system implements a mechanism for selecting additional visualization conditions
described in Section 2.2. In particular, it is possible to select a model and a
subset of output parameters for which a visual map is built. Additionally, dynamical
adjustability of parameters of visual features, such as the size of vertices
and edges, is supported.
A full-fledged
three-dimensional navigation capability on the GCE visual map allows changing
the viewing angle for a more thorough study of its individual fragments.
Let us return to
the GCE described in Section 2.1 for assessing the accuracy of OpenFOAM
platform solvers and consider building a visual map for it.
As a visual image
of a single experiment, let us use a ball, the radius of which is determined by
the value of the output parameter selected for visualization (the deviation
norm L1 or L2), and the coordinates of the ball center are determined based on
the corresponding values of the defining parameters.
The structure of
relationships between graph vertices was determined on the basis of the
previously considered adjacency relation between combinations of values of the
defining parameters. Since the number of such parameters in the example under
consideration is 3, then for any fixed model (solver), the spatial arrangement
of the graph can be represented as a three-dimensional grid, the node coordinates
of which can be obtained by normalizing the values of the defining parameters
to the intervals [–1; 1] so that the minimum value is converted to –1, the
average to 0, and the maximum to 1. For example, the set of values (3; 20; 0)
after normalization is converted to the set of values (–1; 1; –1), and
(7; 10; 10) to (1; –1; 1). At the same time, since only one
selected output parameter is rendered within each visual map, the color of the
ball is fixed, and additional visual features are not used. Thus, function (4)
takes the form:
F(Ma*,
Betta*,
Angle*) = < Ball,
R, Magenta >,
where
Ma*, Betta*, Angle*
are the
normalized values of the defining parameters (Mach number, half-angle and angle
of attack, respectively),
R
is the ball radius. Variable values are in
italics, and constants are in roman type. The following formulas are used to
determine the ball radius:
R
= L1 / 10 for the L1 norm and
R
= L2 / 10 for the L2 norm.
As an indicator of
strength of relationship between single experiments, the degree of closeness of
the relationship between the values of the error values L1 and L2 obtained for
different solvers with adjacent combinations of values of the defining
parameters was used. To evaluate this indicator, calculation of the correlation
coefficient between the corresponding rows was performed, where each row
contains the values of the output parameters L1 and L2 obtained using all
solvers for a given combination of values of the defining parameters (each row,
therefore, contains 6 values). The results of calculating these indicators were
used to build visual images of relationships, which are cylinders with a
diameter proportional to the relationship strength.
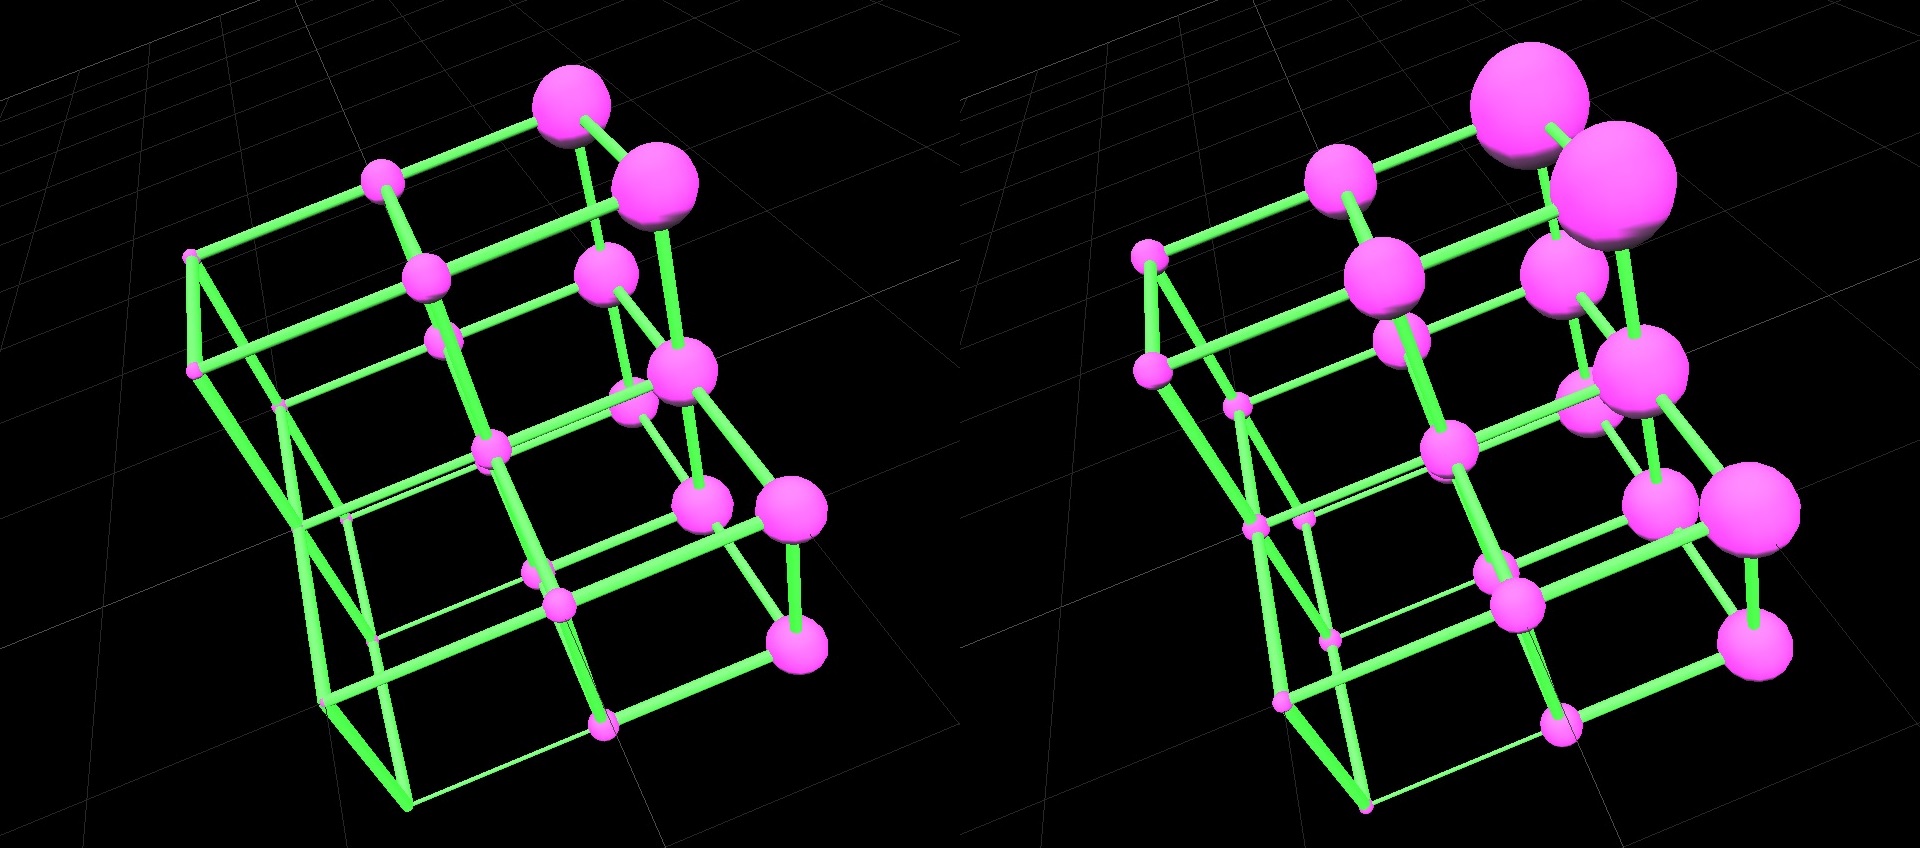
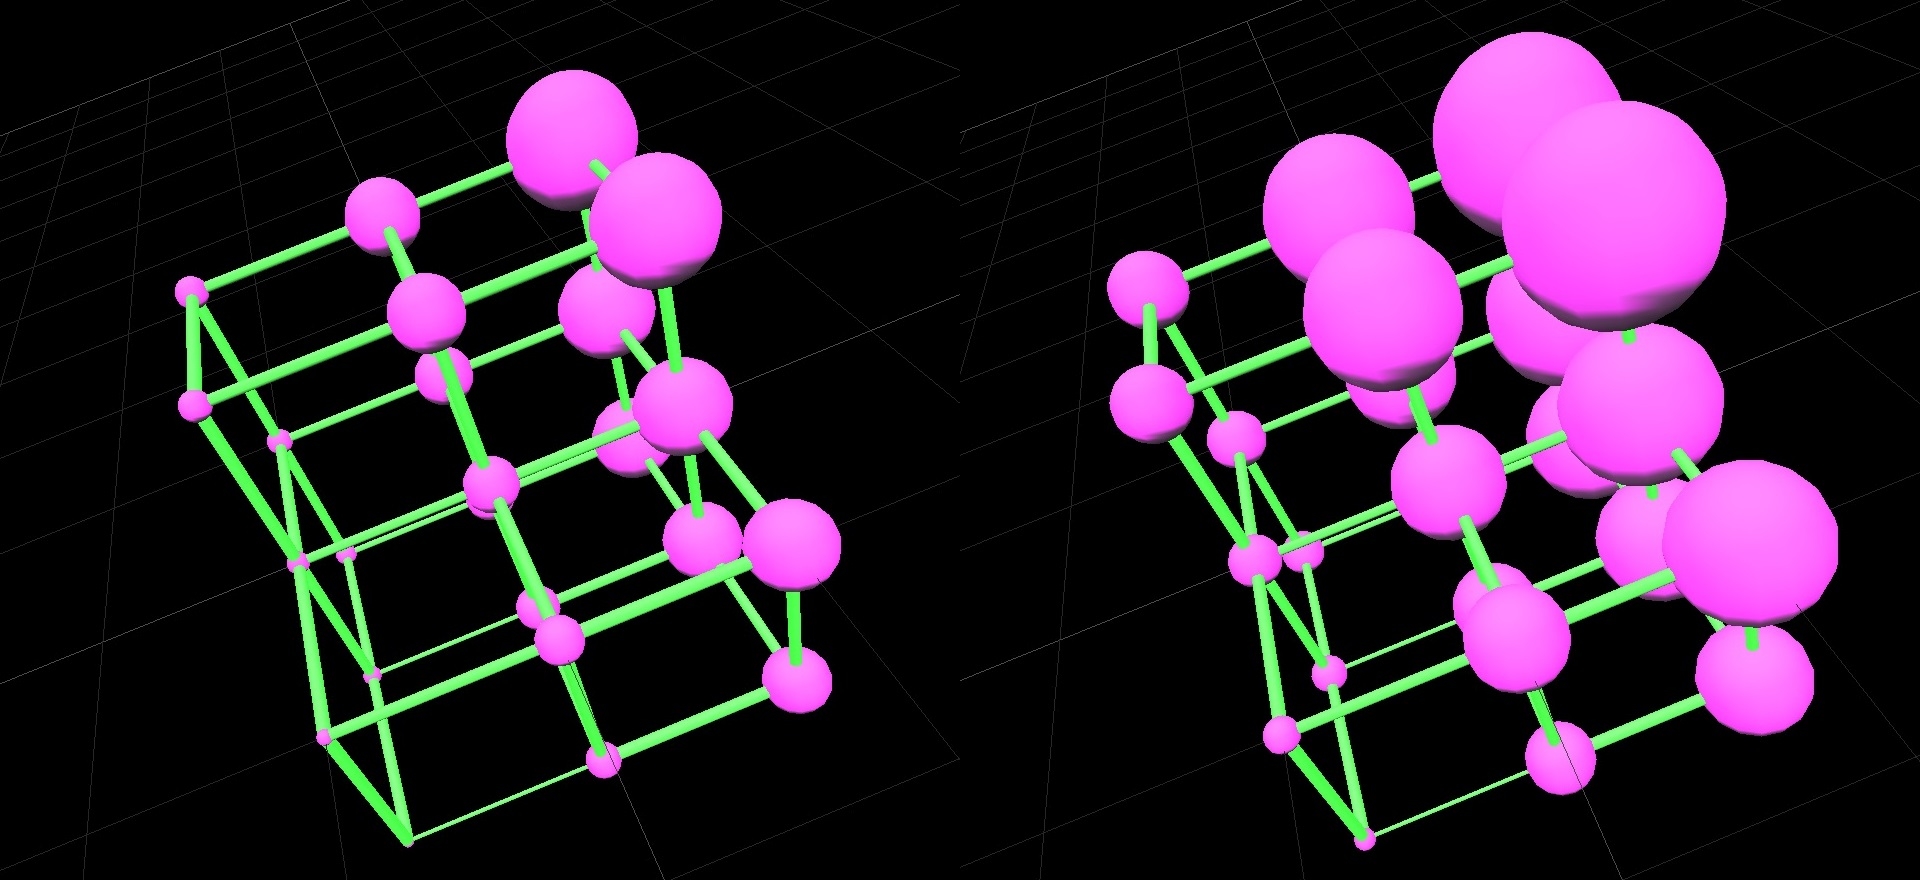
Figures 2 and 3 represent
some of the results of constructing visual maps of the considered GCE.
|
|
|
A)
|
B)
|
Figure
2 – GCE visual maps for fixed pisoCentralFOAM solver and output parameters L1
(A) and L2 (B)
|
|
|
A)
|
B)
|
Figure 3 – GCE visual maps for rhoCentralFOAM (A) and
sonicFOAM (B) solvers and fixed output parameter L2
As a result of the
analysis of the GCE visual maps built for various solvers using the proposed
approach, it can be seen that for all solvers, with an increase in the Mach
number, the sizes of the graph vertices increase significantly, which indicates
an increase in the values of the deviation norms L1 and L2. At the same time,
at a fixed value of the Mach number and different values of half-angle and angle
of attack, the difference in vertex sizes is no longer so significant. These
facts may indicate a significant influence, first of all, of the parameter set
by the Mach number on the accuracy of solvers.
In addition, the
use of the proposed method for visualizing relationships between single
experiments allows assessing visually the degree of relationship between the results
of experiments with adjacent combinations of values of the defining parameters,
since it remains the same for different solvers. And this, in turn, allows determining
visually “strong” and “weak” relationships. As noted earlier, “weak” relationships
(which correspond to edges of smaller thickness) may indicate both experimental
errors and the need for a more detailed study of the corresponding range of
values of the defining parameters.
Сonstruction of a three-dimensional
visual map of a GCE with support for visualizing relationships between its
constituent single computational experiments expands the possibilities of using
visualization methods and visual analytics to assess the GCE state in models of
dynamic planning and management of its implementation. The paper proposes a
method for constructing such a visual map based on the representation of the GCE
state in the form of a graph model and its visualization using an approach
based on the concept of a visualization metaphor. The proposed method makes it
possible to build three-dimensional visual maps for a GCE with many defining
parameters, providing their reduction to a three-dimensional visual image with
the possibility of analysis in various sections by fixing the values of various
defining parameters and selecting the resulting indicators.
Use of the
proposed visualization method and the developed software tool that supports
this method contributes to an increase in the level of interactivity of the
researcher’s interaction with GCE visual maps, which in turn has a positive
effect on the efficiency of their analysis.
Development of the
functionality of the software system for constructing and analyzing
three-dimensional visual maps of a GCE is possible in the following areas:
1) building visual
GCE maps for several models on a single three-dimensional scene;
2) support for
various methods of assessing relationship strength between single experiments;
3) automation of
predicting the results of planned experiments;
4) support for three-dimensional
text annotation of GCE visual maps.
An important
direction for further research is the solution of the mentioned problem of
visualizing the relationships between GCE states at different stages of its
implementation. This will make it possible to provide adaptive planning of a GCE
based on analysis of the dynamics of changes in its state. Also, an urgent task
is to develop mechanisms for integrating software tools for constructing visual
maps with a GCE repository, the structure and principles of which are described
in [16].
The
research has been supported by Russian Science Foundation (project
No. 18-11-00215).
1.
Bondarev,
A.E.: On the Construction of the Generalized Numerical Experiment in Fluid
Dynamics. Mathematica Montisnigri, XLII, 52–64 (2018).
2.
Zakharova
A., Korostelyov D., Podvesovskii A.: Evaluating State Effectiveness in Control
Model of a Generalized Computational Experiment. In: Kravets A.G. et. al.
(eds.): Creativity in Intelligent Technologies and Data Science. CIT&DS
2021. Communications in Computer and Information Science, Vol 1448. Springer,
Cham (2021). doi: 10.1007/978-3-030-87034-8_16
3.
Zakharova,
A.A., Korostelyov, D.A., Podvesovskii, A.G., Galaktionov, V.A.: Methods of
Constructing a Visual Map of Generalized Computational Experiment. Scientific
Visualization, 13(4), 76–92 (2021). doi: 10.26583/sv.13.4.07
4.
Bondarev,
A.E., Kuvshinnikov, A.E.: Analysis of the Accuracy of OpenFOAM Solvers for the
Problem of Supersonic Flow Around a Cone. In: Shi, Y. et al. (eds.) ICCS 2018,
LNCS, vol. 10862. pp. 221–230. Springer, Cham (2018). doi:
10.1007/978-3-319-93713-7_18
5.
OpenFOAM.
Free CFD Software. The OpenFOAM Foundation, https://openfoam.org.
6.
Gorban,
A.N., Kegl, B., Wunsch, D., Zinovyev, A.Y. (eds.): Principal Manifolds for Data
Visualisation and Dimension Reduction, Springer-Verlag Berlin Heidelberg
(2007). doi: 10.1007/978-3-540-73750-6
7.
Galkin,
T., Grigoryeva M., et al.: An Application of Visual Analytics Methods to
Cluster and Categorize Data Processing Jobs in High Energy and Nuclear Physics
Experiments. Scientific Visualization 10(5),
32
–
44 (2018).
doi:
10.26583/sv.10.5.03
8.
Mochalov,
A.A., Varaksin A.Yu.: Processing of Visual Experimental PIV-Data Using a Random
Synthetic Particle Generator. Scientific Visualization 13(5),
27–34 (2021).
doi:
10.26583/sv.13.5.03
9.
Bukalin,
A.O., Zagrebaev, A.M., Pilyugin, V.V.: Software Package for Three-Dimensional
Visualization of the Behavior of Neutron Fields and Archived Parameters During
the Operation of the RBMK-1000 Reactor. Scientific Visualization 14(1), 50–61
(2022). doi: 10.26583/sv.14.1.05
10.
Ulizko,
M.S., Artamonov, A.A., Tukumbetova R.R., Antonov E.V., Vasilev M.I.: Critical
Paths of Information Dissemination in Networks. Scientific Visualization 14(2),
98–107 (2022). doi: 10.26583/sv.14.2.09
11.
Zakharova,
A.A., Shklyar, A.V.: Visualization Metaphors. Scientific Visualization 5 (2),
16–24 (2013).
12.
Isaev,
R.A., Podvesovskii, A.G.: Visualization of Graph Models: An Approach to
Construction of Representation Metaphors. Scientific Visualization 13 (4), 9–24
(2021). doi: 10.26583/sv.13.4.02
13.
Meyer,
B.: Self-Organizing Graphs – A Neural Network Perspective of Graph Layout. In:
Whitesides S.H. (eds) Graph Drawing. GD 1998. Lecture Notes in Computer
Science, vol 1547 (1998). Springer, Berlin, Heidelberg.
doi:
10.1007/3-540-37623-2_19
14.
Noack,
A.: An Energy Model for Visual Graph Clustering. In: Liotta, G. (eds) Graph
Drawing. GD 2003. Lecture Notes in Computer Science, vol 2912 (2004). Springer,
Berlin, Heidelberg. doi: 10.1007/978-3-540-24595-7_40
15.
Kasyanov,
V., Kasyanova, E.: Information Visualization on the Base of Graph Models.
Scientific Visualization 6 (1), 31–50 (2014).
16.
Podvesovskii,
A.G., Korostelyov, D.A., Lupachev, E.A., Belyakov, N.V.: Building a repository
of generalized computational experiments based on the ontological approach [in
Russian]. Ontology of designing 12(1), 41–56 (2022). doi: 10.18287/2223-9537-2022-12-1-41-56
