In
solving problems related to the collection and analysis of archaeological data
in the laboratory, in the search, fixation, revealing and inventory of new,
previously not included in the cultural heritage sites (CHS) registers, various
methods of analysis and decryption are used, when taking into account the exact
fixation of objects on satellite and surface contour maps problem. Along with the
well-known methods, auxiliary or ampliative methods are also used in
cartography, which make it possible to expand the possibilities of revealing and
fixing CHS, as well as the possibilities of studying identified objects under
laboratory conditions.
Geoinformation
data visualization essentially fills up the instrumental methods in research
work under laboratory conditions for geology, archaeology, agrarian industry
and other areas using geoanalytics and GIS-technology. "Exploratory data
analysis" (EDA) is most effective when working with infographics,
analytical geodata diagrams [4, pp.19-58]. Methodological approach to
visualization: on example of control sites fixation, that in fact, uses EDA,
coupled with cartography and is aimed at obtaining concrete results during
laboratory experiments with the retrieval of parametric indicators for further
transfer into practice [19, pp. 99-109].
As
an instrumental supporting for data visualization, polygonal construction of a
highly precise coordinate grid of the coordinate reference points location, in
our case, reference archaeological objects (hereinafter, RAO) is used.
For
the initial coordination of such objects, linear Delaunay triangulation on HR
satellite maps is used [12, pp. 14-39], hereafter a rigid polygonal frame of
the coordination grid is created with an option to display linear
relationships, assign parameters and properties to objects. Such method
provides wide application possibilities for obtaining results in modeling
interactive schemes on coordination satellite maps.
Google
maps, a geogrid editor program, 2D graphic editor programs are used in the
study. Aerial and topographic mapping of different years are used for precise
coordination with regard to RAO and objects localization on satellite maps.
The
whole process consists of successive steps:
Phase
1: RAO initial informative data retrieval: localized aerial photographs,
satellite coordinates, lay of land archaeological maps and other auxiliary
data;
Phase
2: satellite data receiving;
Phase
3: satellite data fine-tuning with aerial photographs and topographic maps with
the RAO coordinates reference on a scale of 1:10000 layerwise overlay;
Phase
4: satellite maps objects localization on a scale of 1:500 - 1:1000 using
coordinate reference and aerial photographs and topographic maps layerwise
layer stacking, as well as RAO localization auxiliary and additional data
retrieval relative to the nearest (control) inhabited localities and the
terrain landmarks;
Phase
5: received data for geolocation on a scale of 1:10000 in a graphic editor
program using the zoom function overlay;
Phase
6: data import for the specified RAO in Gridder2D [15], triangulation geogrid
building;
Phase
7: fixation of obtained results by means of the triangulation grid and
distances reference between the RAO in the metric coordinate system on a scale
of 1:10000 fine-tuning;
Phase
8: RAO modifiers and edge connections parameters assignment;
Phase
9: visualization of received data in the form of graphical diagrams using 2D
graphic editor programs;
Phase
10: obtained data processing.
It
is worth taking into account that archaeological data may correlate in course
of time, they need to be updated periodically. Based on specific examples for
RAO, it is necessary to make a selection as for anchor coordinate objects.
Architectural
and archaeological complexes sites located on vast areas and at a considerable
distance from each other are considered as an example of this method practical
implementation. Stabilized settlements, large mounds or any other significant objects
can be the central objects of such complexes. RAO fixation center can be
assigned as the zero coordinate anchor point.
The
RAO edge connections model is proposed to be formed using GIS technologies [3]
by the high-precision coordinate grid of anchor objects location polygonal
construction method using Delaunay triangulation [11] on HR satellite maps. The
need for using this method is due to the necessity to determine the shortest
connections between the anchor objects, the edge connections in the node points
concentration that determines their number, where the framework condition is
fulfilled – triangulation along the smallest diagonal of the quadrilateral.
This
method makes it possible to check the node points parametric correlations, to
form a rather accurate coordination grid of all objects localized on the
satellite map with a light error in the anchor coordinates with a deviation up
to 3-5 meters from the satellite coordinates. During the building process, the
condition is checked: whether objects of certain types have edge connections
with each other.
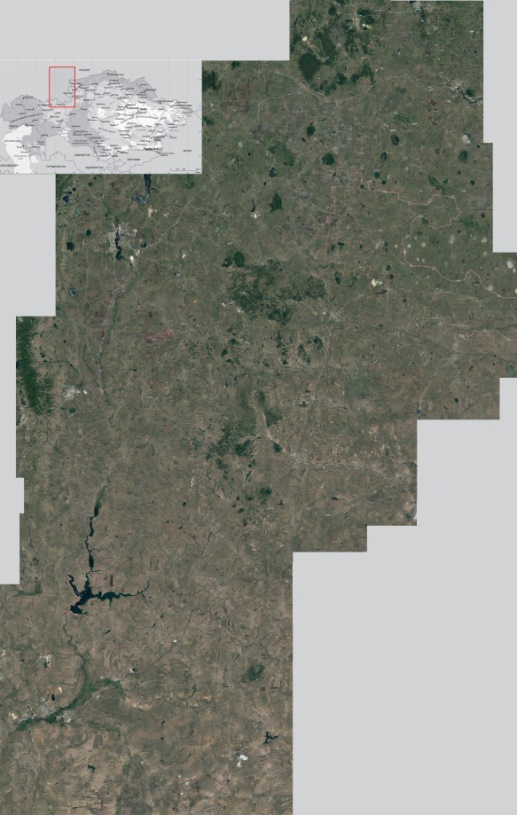
The
Google Maps interface (HR satellite maps) is used as a workspace (Fig. 1.1). To
work with geogrids, the GIS GeoLink 3.14.0013 software utility is used [5]. To
work with RAO, a modified grid is used, built using the utility for 2D
triangulation of complex two-dimensional regions Gridder2D [10]. The simulated
cartogram grid makes it possible to visualize the cartogram contents against
the background of a real geographical situation with reference to satellite
maps. Thus, the cartogram displays the RAO localization in terrain conditions
based on cartographic data - isolines, the earth surface and river levels marks
(see Fig. 5). The source cartographic data detailing makes it possible to form
and group layers that display typomorphology and isometric inter-object
connections by RAO interpolation. Cartograms contain both the cartographic
information results and the source data. 2D editors for cartographic images
processing are used: CorelDRAW, 2017 Academic Edition, D-504-18 dated
25.04.2018 [18] and Adobe Photoshop CS 5 Academic Edition, K-113-11 dated
11.04.2011 [16].
In
the course of laboratory work, with the view to fix objects points accurately
on an HR satellite map, aerial photography of different years was used as an
auxiliary data [9; 14. pp. 116-121], in particular cases, decrypted aerial photographs
cartographic schemes and the archaeological atlas materials were used [1; 17, pp.
199-219], archaeological data of field and laboratory archaeological study [6,
pp. 5-17].
|
|
|
|
Figure 1.1. A territory for study
fragment – an HR satellite image
|
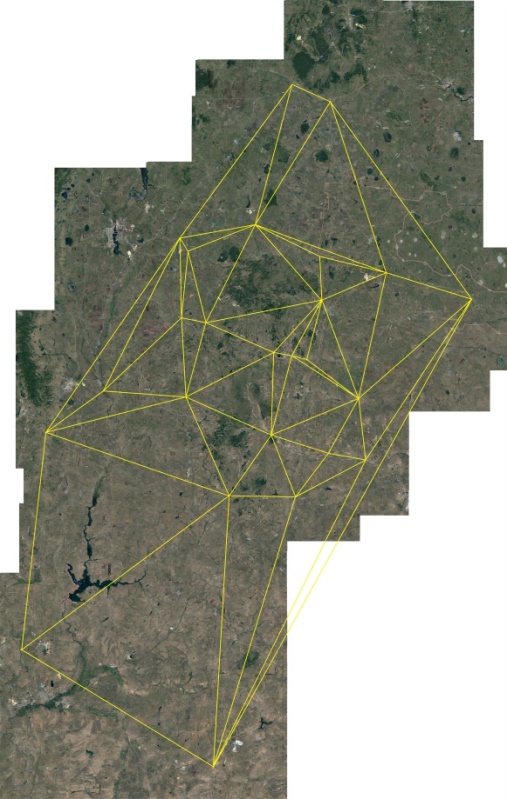
Figure 1.2. Triangulation of
localized anchor points (RAO) in the satellite image
|
The method used includes the following algorithm for building
a RAO localization geogrid (Fig. 1.2):
1) collecting data on RAO: aerial photographs,
satellite coordinates, archaeological maps with terrain and other auxiliary
data;
2)
receiving data from a satellite map on a scale of 1:20000;
3)
Transfer satellite images to a scale of 1:10000;
4)
objects localization on satellite data on a scale of 1:500 - 1:1000 by
informative data layer stacking and the available database of aerial
photographs, coordinates, topographic maps analysis, fixing anchor objects
relative to the inhabited localities and natural landscape points of detail indicated
on the maps;
5)
received data scale transfer;
6)
triangulation algorithm startup of reference points with the supplied parameters:
with division into layers, groups, subgroups of links between RAO;
7)
the obtained results of the construction of a triangulation grid and the
distances between RAO fixation;
8)
analysis and collection of the received data with their entry into parametric
tables.
The
development of building linear links with reference to RAO method, allowed us
to obtain more accurate results based on anchor reference points than the building
on satellite coordinates basic method.
Such
a triangulation scheme can be an example of triangulation built on the location
of all cities in Russia (Fig. 2).
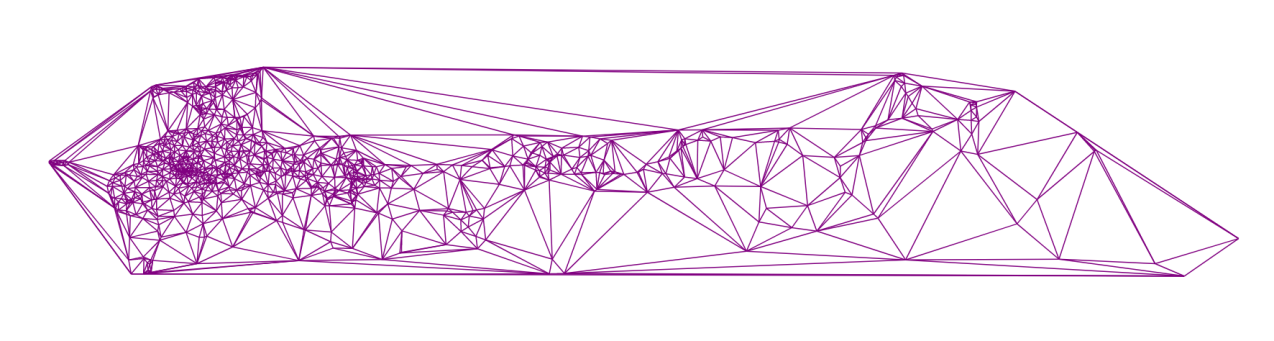
Fig. 2. A triangulation
example built
on the locations of all cities in
Russia (modern cities of the Russian Federation are reference points) [2].
A
Google map fragment - stabilized settlements of the Bronze Age in the border zone
localization territory is taken as the basis for the grid building: the South
of the Chelyabinsk Region, the Republic of Bashkortostan eastern borders, the
northern borders of the Orenburg Region, on which reference points (the ruins
of stabilized settlements locations) were previously plotted according to the
given algorithm. Modifiers are assigned as reference objects.
As
a result, analysis was conducted and a scheme combined by linear parameters,
connections and RAO type-morphological characteristics was built (Fig.3.3).
RAO
characteristics are assigned to the triangulation grid node points and consist
of two modifiers:
-
object morphological properties modifier (OMPM), assigned to a specific type of
object: OMPM (1) – 1st type, OMPM (2) – 2nd type, OMPM (3) – 3rd type, OMPM (1...3)
– indefinite;
-
object typological properties modifier (OTPM), assigned to a certain object
typical size: OTPM (1) - large, OTPM (2) - medium, OTPM (3) - small, OTPM
(1...3) – indefinite.
According
to previously conducted studies on the RAO type-morphology involved in
laboratory research, a total of 10 morphotypes have been identified that
combine the typical and specific parameters of modifiers: OMPM and OTPM. According
to the number of detected morphotypes, the same number of linear-parametric RAO
connections layers will be identified. Figure 3.3 shows the layer stacking of 4
triangulation grid edges layers that visualize chains of linear links.
RAO
linear parameters and connections are assigned to the triangulation grid edge
connections along the rectangle smallest diagonal and are visualized by means
of color coding in the CMYK model (Cyan, Magenta, Yellow & Key).
It
is worth adding that the number of RAO bound to linear parametric links may
vary or be defined due to further research and laboratory experiments, with the
inclusion of new or refinement of the uncertain reference points parameters.
Undefined
OMPM and OTPM can be included or excluded in linear RAO chains
"manually" or automatically. The inclusion or exclusion algorithm of undefined
RAO is set depending on the tasks set in the laboratory research. In these
works on the geodata visualization method approvement, algorithms for
undefined
RAO were not worked out, but added or excluded from the triangulation grid
layers in "manual mode" taking into account one or another OMPM and
OTPM.
The
working out and inclusion of algorithms for the undefined RAO triangulation
grid layers in automatic mode requires further development.
Further,
edge connections are built between the anchor points, which are assigned their
own color in the modifiers properties, thus, linear connections between similar
and identical OMPM and OTPM are visualized. The RAO inter-object edge
connections are visualized in a certain color in the triangulation grid system
with the additional binding parameters inclusion and exclusion, depending on
the tasks set.
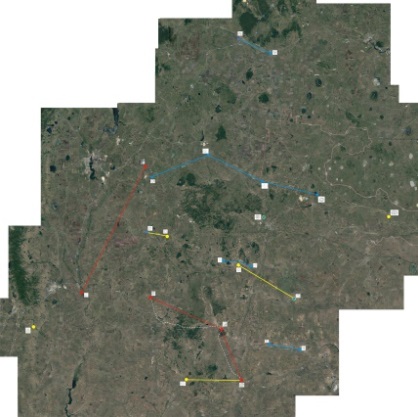
At
Figure 3.1, in Experiment No. 1, edge connections layers are visualized complying
with the conditions for RAO linking without taking into account OMPM and OTPM,
continuous lines building chains along river-beds.
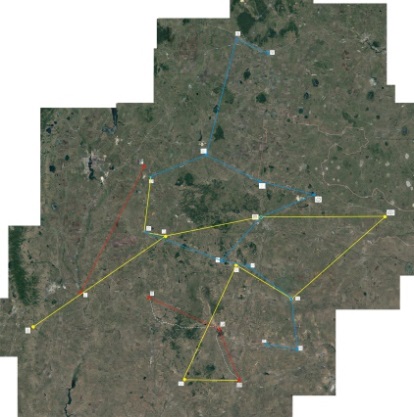
Figure
3.2. Experiment No. 2 shows the results that fix the edge connections, complying
with the conditions for RAO linking with analogous or similar OMPM and OTPM,
without taking into account their location relative to river levels marks.
Figure
3.3 The results of combining the experiments No. 1 and No. 2 results are shown,
in fact, through this process, we obtained layers hybridization (combination)
according to all specified parameters of the RAO inter-object edge connections
on the geogrid. As a result of layers combination, correlation in the RAO edge
connections chains visualization is due to the framework condition –
triangulation along the smallest diagonal of the quadrilateral: the program
selects the smallest diagonal path and visualizes the edges with the smallest
distance between RAO, including the specified commonality parameters of OMPM
and OTPM and their location along river-beds. In the generalized visualization,
Figure 2.3., linear connections chains between RAO with analogous or similar characteristics
are shown.
As
a result of the laboratory research, certain patterns in the RAO correlations
with similar characteristics were revealed, taking into account the edge connections
modifiers properties under given conditions.
Thus,
depending on the given conditions, the edge connections visualization
combination changes, displaying informative data on the linear edge connections
systems formation between anchor points on scalable satellite maps.
An
example clearly demonstrates the edge connections system between the reference
objects and linear connections with the modifiers of the same type, that allows
to formulate conclusions with respect to the settlement model within the
certain territory boundaries and the development period, the formation dynamics,
RAO functioning and development in this territory, but, in this case, the most
important is the coordination vector definition of RAO linear connections and intervals
dynamics between them. These data allow to simulate the possible reference
points location coordination in the edge connections constructed model. That
may contribute to the unknown RAO localization or the definition / refinement
of the uncertain reference points parameters in the edge connections system in
the future. The proposed method makes it possible to predict the new and
previously unknown objects locations, the
planography
of which can be
completely leveled in the natural landscape during agricultural activities or
other natural or man-made environmental impacts.
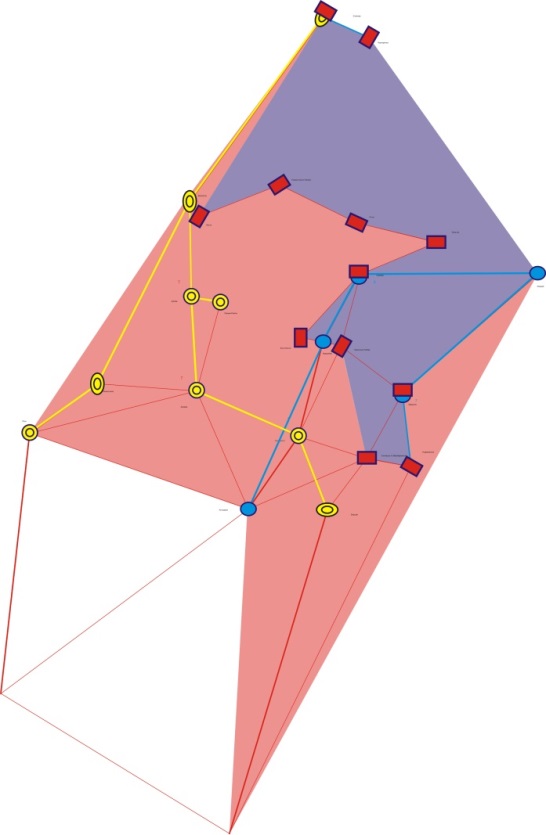
Figure 3. The edge
connections visualization process between RAO typo-morphological groups using
stabilized
settlements of the Southern Urals of the Bronze Age as a case
study.
3.1. Edge
connections visualization between RAO in the river-beds system without taking
into account modifiers
3.2. Edge
connections visualization between RAO taking into account only modifiers
3.3. Hybridization
of the RAO edge connections visualization results for all specified conditions
and parameters
In
Figure 3 red, pink and yellow lines indicate the "Sintashta group"
stabilized settlements connections, of various morphotypes, and the blue line
shows the "Petrovsky group" stabilized settlements linear connections,
presumably of a later period of functioning. A noticeable difference between
the RAO localization in these groups is their concentration on a certain
territory and the distances between objects segments.
As
described in approbation, one of the main study practical results is the
possibility to use this scientific visualization method in obtaining objective
results in laboratory conditions of archaeological objects studying systems in
the Southern Urals vast territory, namely the territories where Bronze Age
stabilized settlements ruins or traces are located.
In
the development of the South Ural system of the fortified settlements formation
study hypothesis, there are certain gaps in the proof substantiation of all system
elements integrity, as well as in determining the connections, factors,
processes and other settlement system formation aspects. [7, pp. 7-29].
|
1.
|
2.
|
|
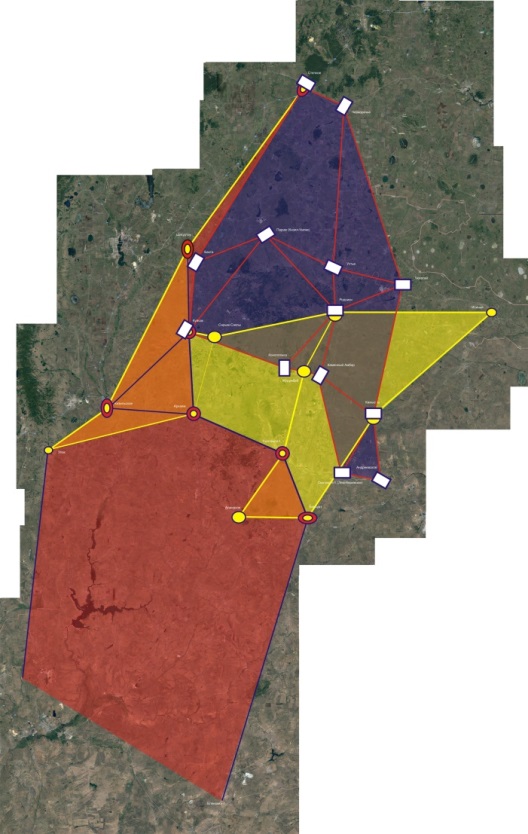
Fig. 4. Localized areas
visualization by RAO type and morphological characteristics
|
|
4.1. Areas visualization on 3 RAO
layers with layer stacking on a satellite map
|
4.2. Areas visualization along
the boundaries of one of the RAO layers in a diagram form
|
The
use of this method was necessary to evaluate and compare the obtained data with
the archaeology data. It was necessary to find possible connections with
similar settlement systems in adjacent and non-adjacent territories, or to find
a possible reason for the lack of connections, where there are none.
In
Figure 4 the edge connections layers visualization along the triangulation grid
is supplemented: edge connections bordering areas obtained during experiments
are highlighted in color. These diagrams show linear connections of stabilized settlements
local groups, forming regions territorial locations according to the RAO
characteristics.
The
implementation result was an interactive scheme project with RAO advanced
parametric and informative data with the possibility of this scheme layer
stacking on a scalable satellite map (Fig. 5).
The
software utility "GCRAO-1.0" ("Grid cartograms of reference
archaeological objects. Version 1.0), designed for binding to satellite maps,
as of this writing, is under development stage.
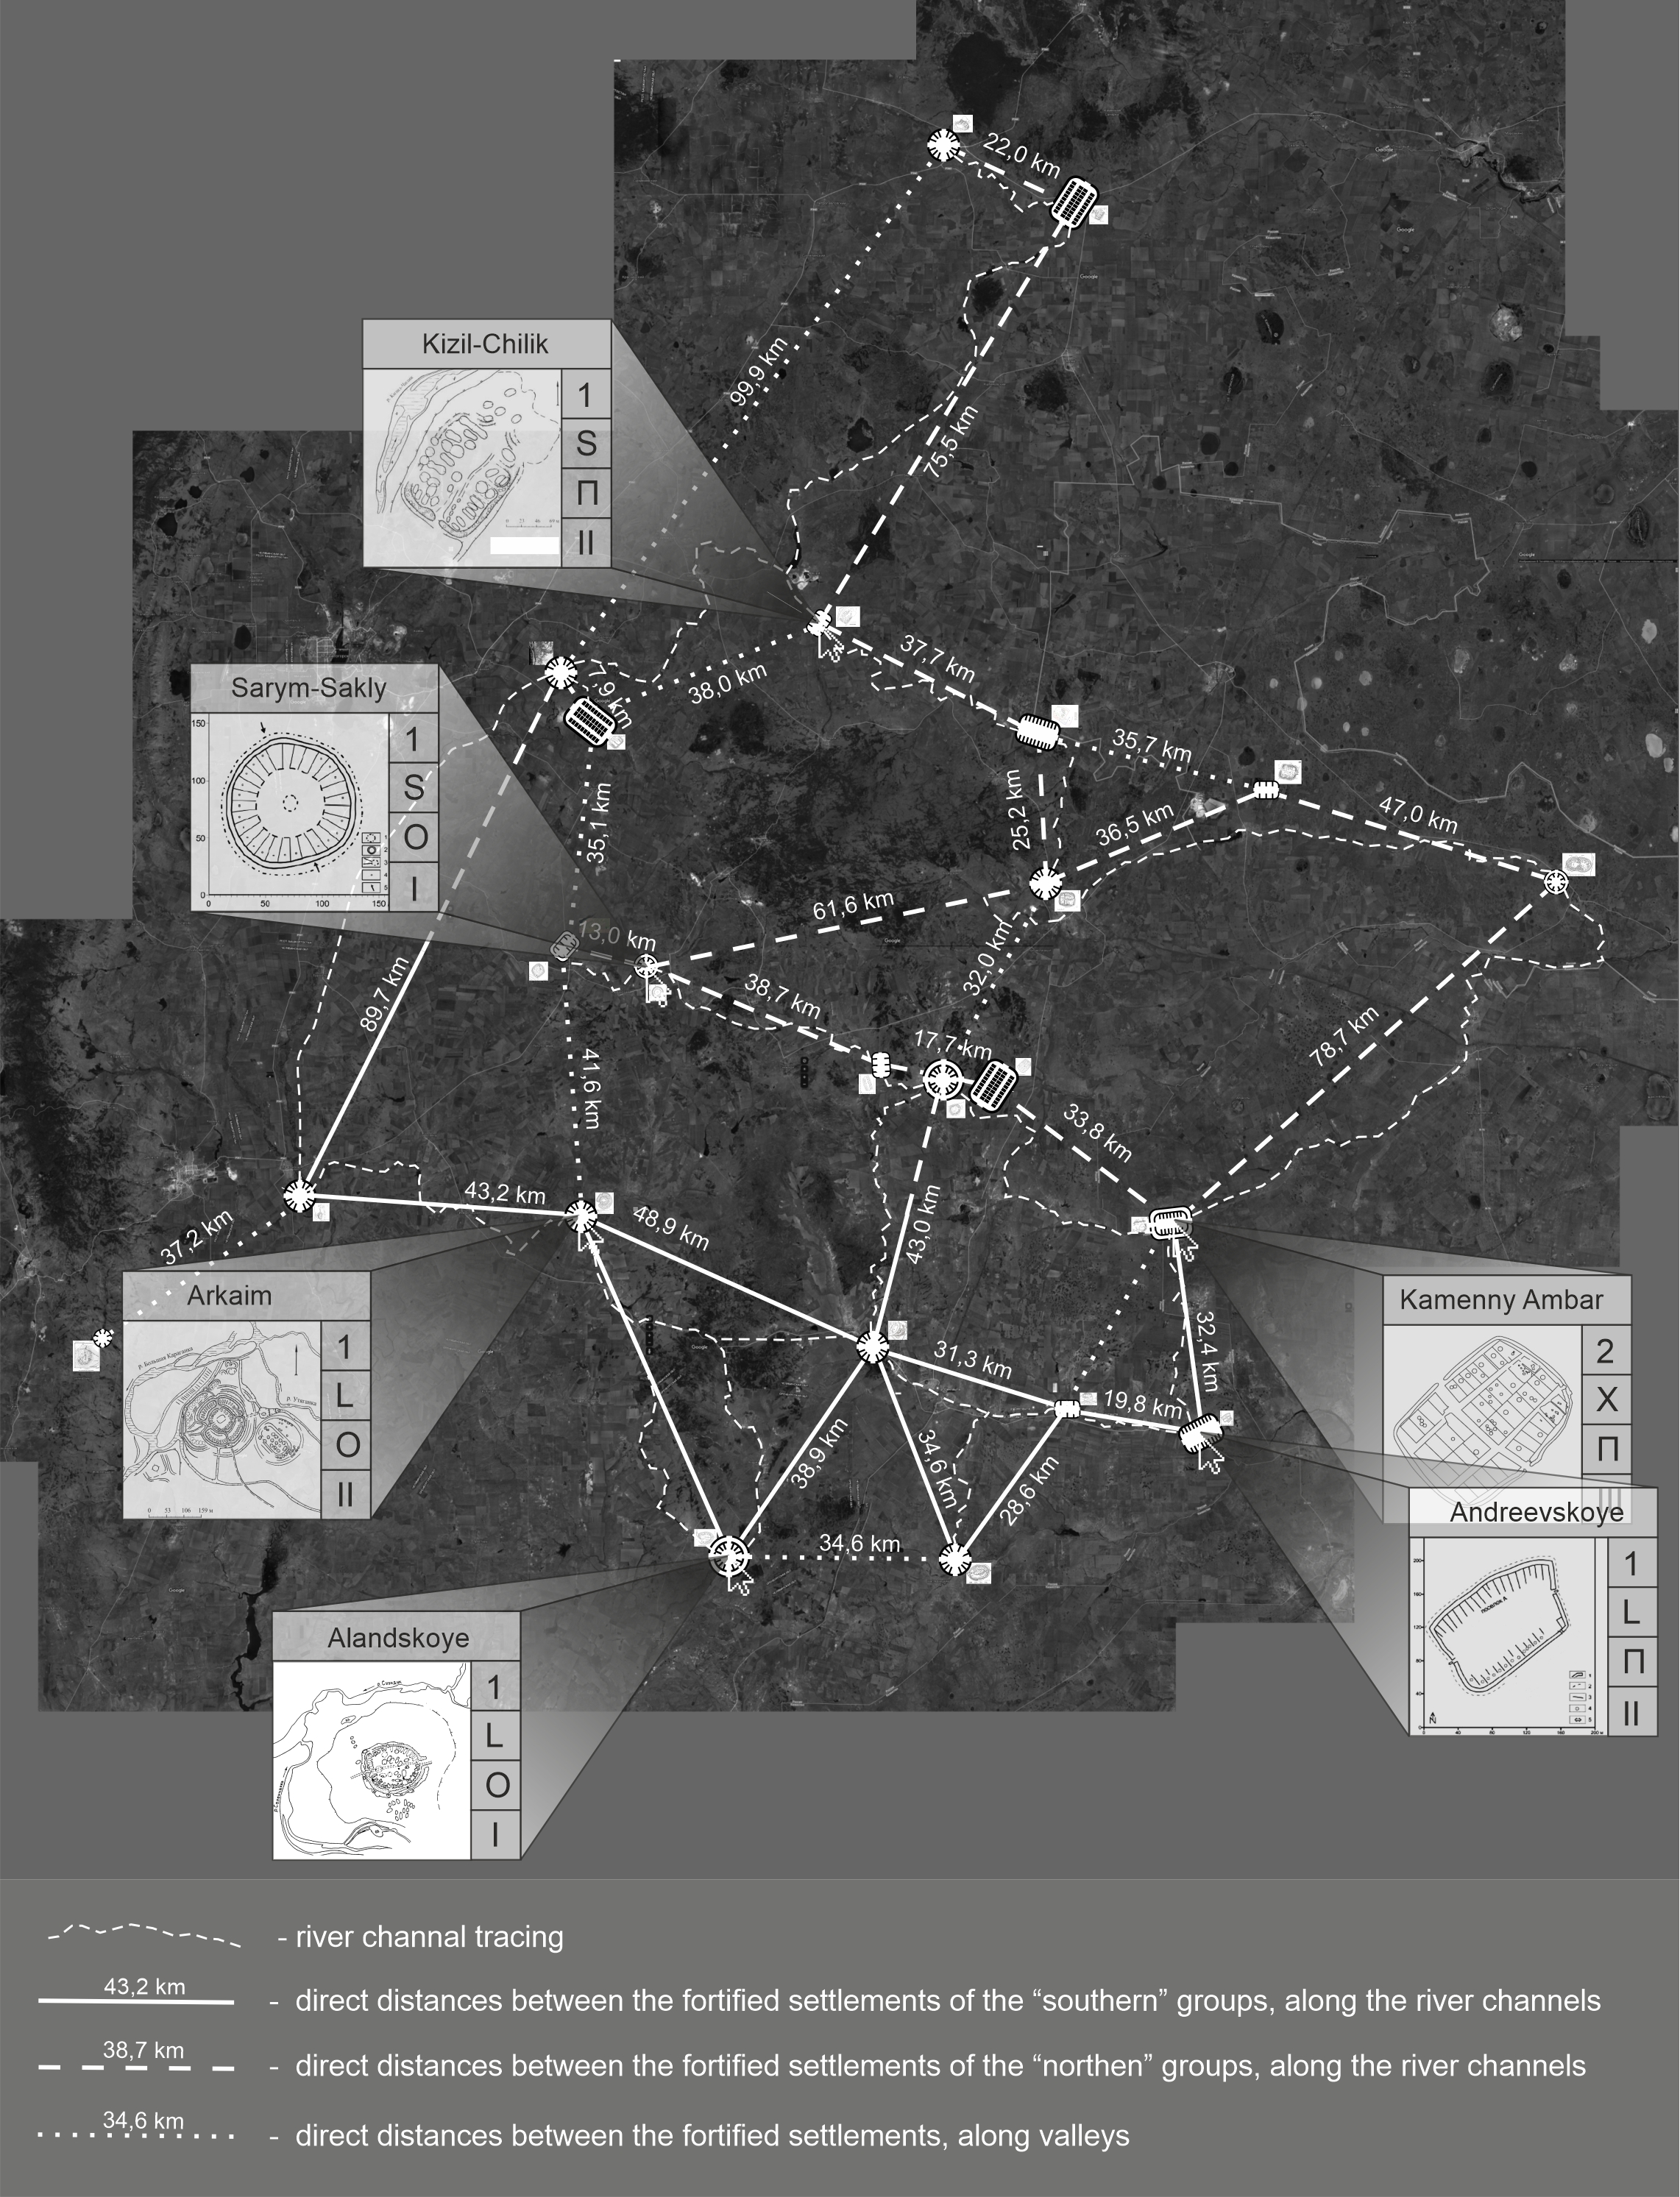
Fig. 5.
Implementation result: an interactive scheme project on a satellite map.
At
this stage of the study, a method that allows expanding the research possibilities
in the geodata visualization field on example of fixing archaeological objects
on satellite maps has been tested.
With
the help of this method the linear connections distance parameters between the
binding objects – RAO are most accurately determined and fixed, and the edge
connections number and parameters are determined as well.
The
proposed method allows:
-
to check the nodal points connections;
-
to determine the territorial frame linear-typological connections;
-
to establish the shortest connections between RAO most accurately;
-
to create a scalable polygonal grid for binding to satellite maps;
-
to predict the RAO location in the binding system to the reference points.
Graphical
information display on an interactive diagram provides an exhaustive amount of
"single window" visual informative data with increasing the
information visualization capabilities about anchor objects and navigation
data.
This
method was first put for the analysis and research of archaeological complexes
and systems. The proposed method possibilities make it possible to widely use
the developed schemes in satellite navigation and specialized applications for
working with geodata. The approach given in the article can be applied to any
areas and spheres of activity for static objects localization on the earth
surface using the field of architecture and urban planing, historical geology,
volcanology, geology of minerals, some areas of geography as a case study, etc.
1. Adrianov
B.V. Deshifrirovanie aerofotosnimkov pri izuchenii drevnih orositel'nyh sistem
/ B.V. Adrianov // Arheologiya i estestvennye nauki: sb. tr. – 1965. pp.
261-267.
2. Algoritm
triangulyacii Delone metodom zametayushchej pryamoj. - URL:
github.com/Vemmy124/Delaunay-Triangulation-Algorithm
3. Afanas'ev
G.E. Osnovnye napravleniya primeneniya GIS- i DZ-tekhnologij v arheologii /
G.E. Afanas'ev // Arheologiya i informatika. [Elektronnyj resurs] – URL:
https://www.archaeolog.ru/media/periodicals/agis/AGIS-1/Afanasjev/page1.html
4. Bryus
P. Razvedochnyj analiz dannyh / P. Bryus, E. Bryus // Prakticheskaya statistika
dlya specialistov Data Science. – SPb: BHV-Peterburg, 2018. – 304 p.
5. GIS
GeoLink 3.14.0013. - URL:
http://www.geolink-consulting.ru/products/gis/download.html
6. Epimahov
A.V. Mul'tidisciplinarnye arheologicheskie issledovaniya v izuchenii migracij i
mobil'nosti (bronzovyj vek YUzhnogo Urala) / A.E. Epimahov // Problemy istorii,
filologii, kul'tury. – 2021. №3. pp. 5–17.
7. Epimahov
A.V. Arheologiya i kompleksnye metody issledovaniya. Ot predstavlenij o
linejnoj evolyucii k mozaike kul'turnyh tradicij (bronzovyj vek Urala v svete
bol'shih serij radiouglerodnyh dat) / A.V. Epimahov, E.V. Kupriyanova, P.
Hommel', B.K. Henks // Drevnie i tradicionnye kul'tury vo vzaimodejstvii so
sredoj obitaniya: problemy istoricheskoj rekonstrukcii : materialy I Mezhdunar.
mezhdisciplinar. konf. / otv. red. E. V. Kupriyanova. Chelyabinsk : Izd-vo Chelyab.
gos. un-ta. – 2021. pp. 7-29.
8. Zhukovskij
M.O. Ispol'zovanie mul'tirotornyh BPLA i fotogrammetricheskih tekhnologij
obrabotki aerofotos"emki v sovremennyh arheologicheskih issledovaniyah /
M.O. Zhukovskij // Virtual'naya arheologiya: materialy konf. (II; 1-3 june
2015.; SPb.). – 2015. pp. 106–109.
9. Zdanovich
G.B., Batanina I.M. Levit N.V., Batanin S.A. Arheologicheskij atlas Chelyabinskoj
oblasti / G.B. Zdanovich, I.M. Batanina, N.V. Levit, S.A. Batanin // Trudy
muzeya-zapovednika «Arkaim». Chelyabinsk: Yuzh.-Ural. kn. izd-vo. – 2003. Vol.
1: Step'–lesostep': Kizil'skij rajon. – 240 p.
10. Programma
dlya triangulyacii slozhnyh dvumernyh oblastej Gridder2D - URL:
https://www.keldysh.ru/papers/2008/prep60/prep2008_60.html
11. Skvorcov
A.V. Triangulyaciya Delone i eyo primenenie / A.V. Skvorcov. – Tomsk: Izd-vo
Tom. un-ta, 2002. – 128 p.
12. Skvorcov
A.V. Obzor algoritmov postroeniya triangulyacii Delone / A.V. Skvorcov //
Vychislitel'nye metody i programmirovanie. – 2002. №3. pp. 14-39.
13. Cvetovye
modeli CMYK, RGB, HSB. - URL:
https://icolorit.ru/blog/cvetovye-modeli-cmyk-rgb-hsb
14. Shishkin
K.V. Primenenie aerofotos"emki dlya issledovaniya arheologicheskih
pamyatnikov / K.V. Shishkin // Sovetskaya arheologiya. – 1966. №3. pp. 116–121.
15. Shcheglov
I.A. Programma dlya triangulyacii slozhnyh dvumernyh oblastej Gridder2D
(Software For Constrained 2D Triangulation Gridder2D Preprint, Inst. Appl.
Math., the Russian Academy of Science) / I.A. Shcheglov. – 2008. – [Elektronnyj
resurs] – URL:
https://www.keldysh.ru/papers/2008/prep60/prep2008_60.html
16.
Adobe Photoshop CS 5 Academic Edition.
-
URL:
https://helpx.adobe.com/ru/photoshop/photoshop-cs5-cs55-tutorials.html
17.
Batanina
N.S. Soviet Period Air Photography and Archaeology of the Bronze Age in the
Southern Urals of Russia:
W.S. Hanson and I.A.
Oltean (eds.) / N.S. Batanina, Br. K. Hanks // Archaeology from Historical
Aerial and Satellite Archives. Springer Science+Business Media, LLC. – 2013. Chapter
12. pp. 199-219.
18.
CorelDraw 2017 Academic Edition.
-
URL:
https://www.coreldraw.com/en/pages/coreldraw-2017/
19.
Globa
A.A.
The effectiveness of
parametric modelling and design ideation in architectural engineering
/ A.A. Globa,
O.A. Ulchitskiy, E.K. Bulatova //
Scientific
Visualization. – 2018. Vol.10. №1. pp. 99-109.