Researchers and decision makers (DMs) in various
subject areas often face the task of choosing the best option from the
available set of alternatives. It is possible to successfully solve such
problems in the case of a small dimension (a small number of alternatives and
criteria), and the task itself is considered as a decision-making problem [1].
In this case, you can effectively use traditional methods of decision-making,
such as SMART, PROMETHEE, MAI, etc. [2]
In case when we face a large count of
alternatives or criteria that characterize them, the use of traditional methods
already becomes difficult. In such a situation, one usually resorts to methods
of filtering alternatives and the method of decreasing a dimension of them.
However, this is not always effective, since decision-making is a subjective
and creative process, and if the above methods are applied, we can lose some
important alternatives and criteria, without even noticing it. Therefore, it is
important to also involve decision makers at the stage of reducing the
dimension of the original decision-making problem.
The decision-maker is often unable to
perceive large volumes of multi-criteria alternatives without using special
tools. The decision-maker can effectively and, which is also important,
holistically perceive large volumes of information only with the use of
specialized methods of data visualization [3-6].
If the decision-maker is involved in the
procedure of filtering alternatives and reducing their count and dimension, he
faces the following tasks: criteria's grouping, criteria's ranking, pairwise
comparison of alternatives [7, 8]. Effective 3D visualization methods can be
used to solve these problems. The development and improvement of such methods
will allow us to study a choice set and set of criteria in order to select the
most informative ones for achieving visualization goals. Consider several
methods to construct and research such three-dimensional visual images of
alternatives to filter and reduce the dimension.
To reduce the dimension of the decision-making
problem using visual analytics of three-dimensional images of multi-criteria
alternatives, it is necessary to solve the following problems:
1.
Ranking of criteria's.
2.
Grouping of criteria's.
3.
Filtering of alternatives.
Suppose we have the choice set
A
= {A1,
A2, …,
AN}, where
N
– count of
alternatives. Each alternative is specified by a vector of normalized criteria
values:
Ai
= {ai,j}, where 1 ≤
j
≤
K,
K
– count of criteria, 0 ≤
ai,j
≤ 1. Under criterion commonly, understood parameter (quantitative or
qualitative) that characterized the alternative (can be obtained by
calculation, empirically, or synthetically). In the case of using qualitative
criteria, an additional procedure for their normalization using specialized
scales is required [8]. At the same time, higher values of the criteria
ai,j
correspond to a more priority alternative.
Consider several methods for visualizing
multi-criteria alternatives that can be used in the course of visual analytics
in solving the above problems.
There are various methods for 2D imaging of
single multi-criteria alternative [9]: Histograms, 2D plots, radar plots, radial
plots, etc. The simplest method for visualizing many alternatives in
three-dimensional space is to place two-dimensional images of alternatives
along the 3rd coordinate axis (Fig. 1-2).
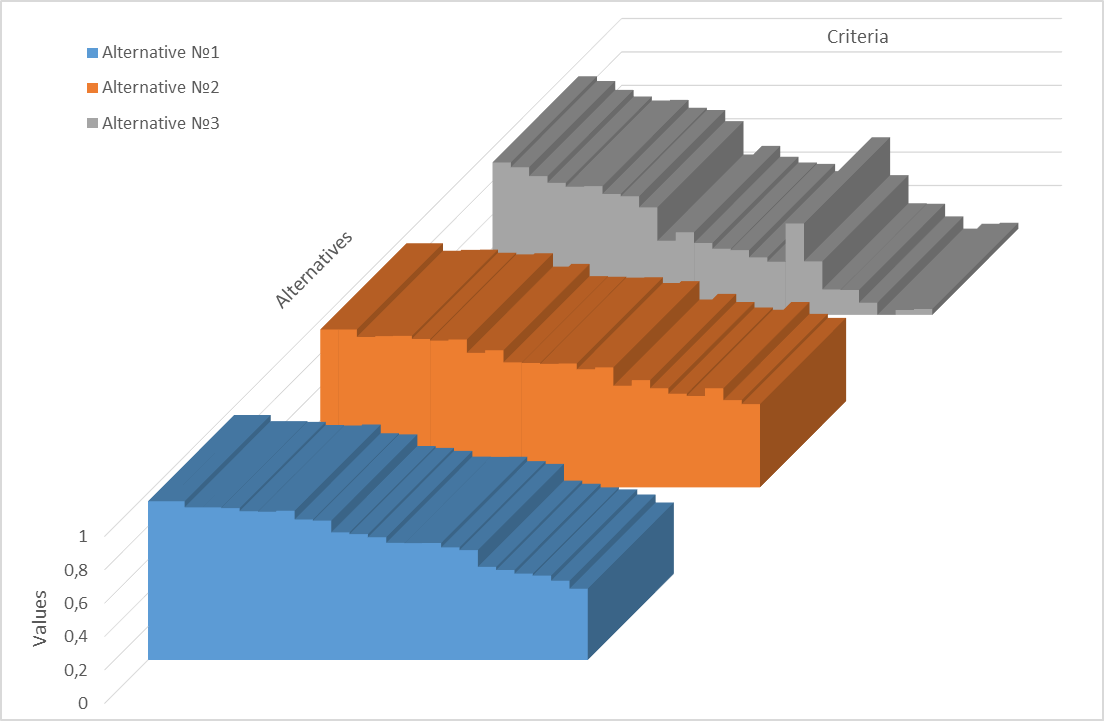
Fig.
1.
Three-dimensional visualization of
three multi-criteria alternatives using histograms
The use of this method can be effective in the
case when the count of alternatives is small and the count of criteria is
large, and the task is to filter out alternatives. Based on the obtained three-dimensional
image, it is possible to visually determine the “strong” and “weak”
alternatives due to the prevalence of columns with large values. However, in
the case of similar characteristics of the initial data, it would be more
appropriate to try to reduce the count of criteria. This would allow the use of
traditional decision-making methods. However, this visualization method will
not allow you to do this, because it is not obvious how the count of criteria
can be reduced. Therefore, we will consider other methods of visualizing three-dimensional
images of multi-criteria alternatives.
One possible method is to swap the criteria
and alternatives for the previous visualization method - i.e. each row
visualizes the values of a single criterion for all alternatives (Fig. 3). In
this case, a reduction in the number of criteria can be achieved by excluding
criteria that have a similar histogram with other criteria. However, the
effectiveness of this procedure depends on the relative position of the
criteria along the axis of the criteria (Fig. 3).
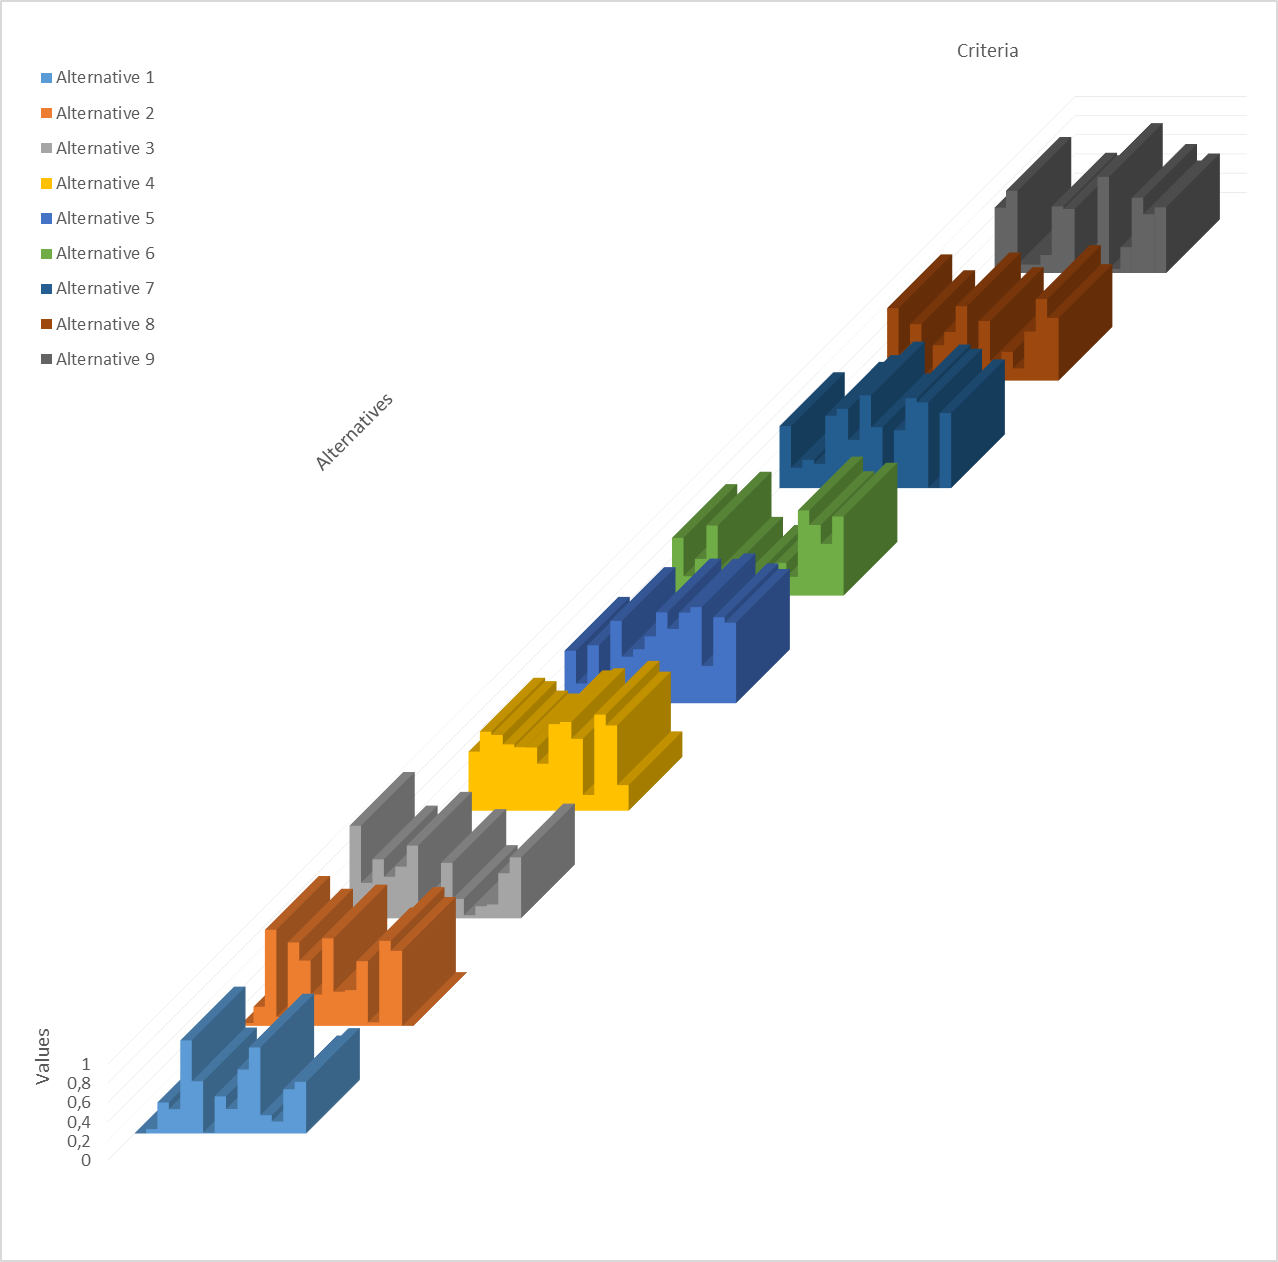
Fig. 2.
Three-dimensional
visualization of nine multi-criteria alternatives using histograms
Another visualization method for searching
similar criteria at the given choice set can be based on calculating
correlation coefficients of the criteria values. To do this, you must first
calculate the matrix of correlation coefficients between all pairs of criteria:
M
={mi,j}, where 1 ≤
i,
j
≤
K,
mi,j
– correlation coefficient between the criteria's values
of the alternative. As a coefficient in the simplest case, you can use the
Pearson correlation coefficient, calculated by the formula [10]:
|
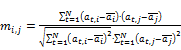 , where
|
(1)
|
|

|
(2)
|
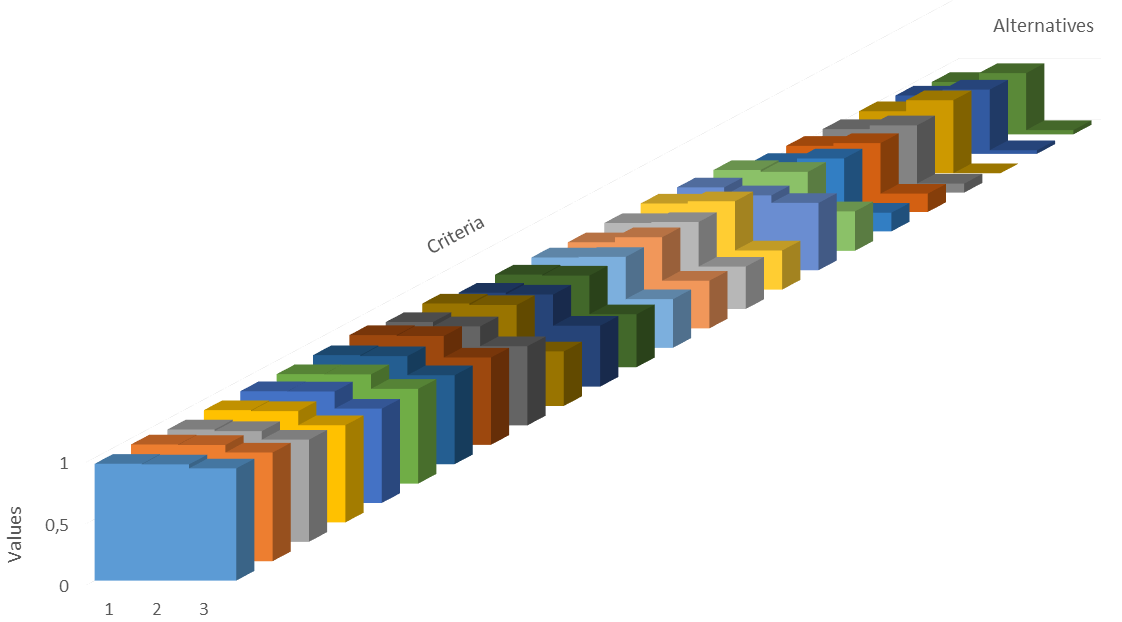
Fig.
3.
Three-dimensional visualization of
criteria for three alternatives using histograms
The thus obtained matrix M can be visualized as a
surface (Fig. 4). A larger value of the correlation coefficient means that the
criteria are very similar and one of them can be removed from consideration. As
seen in Fig. 4, areas with a high cross-correlation coefficient may form on the
surface, containing groups of criteria. The detection of such zones may
indicate the advisability of replacing the group of criteria that form it with
a single criterion.
It is worth noting that the given method (Fig.
4) can also be applied in cases where the count of alternatives and criteria is
large. However, it can only be used to group and rank criteria, but it does not
provide filtering of alternatives. It is also worth noting that an additional
advantage of this method is that when the group of criteria is collapsed, the
rank of this group can also be obtained, which can be used in classical
decision-making methods.
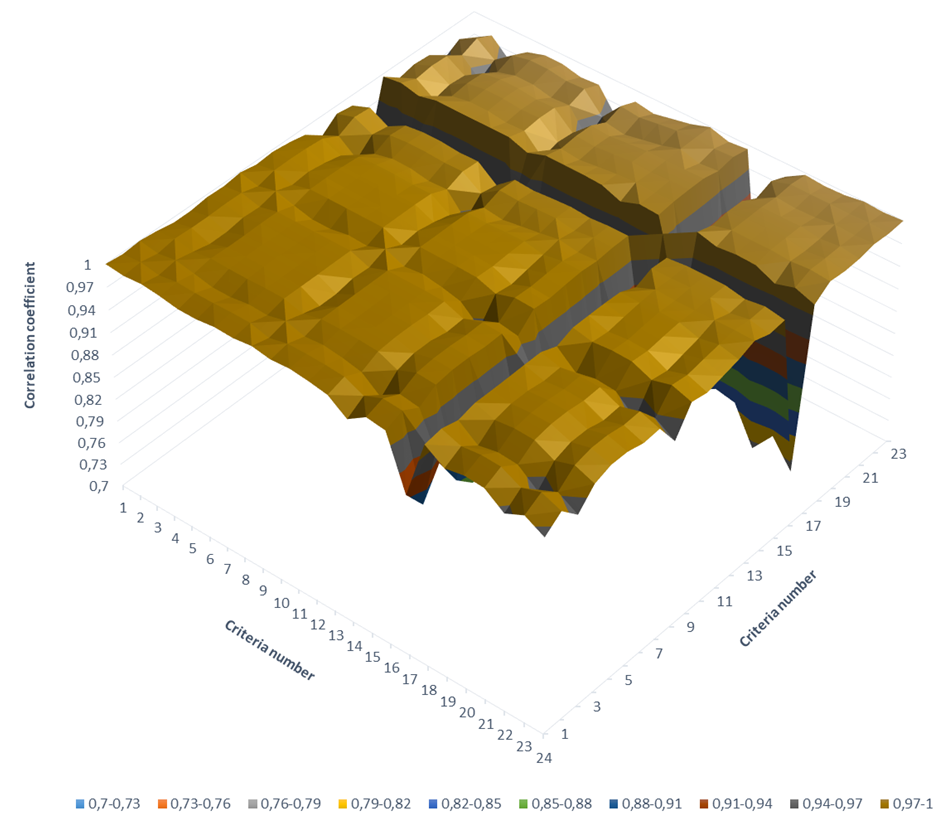
Fig. 4.
Three-dimensional visualization of the
surface of the criteria's correlation
The rank of the group (rx)
can be determined, for example, in the following ways:
1.
rx
=
count of elements in a group
x.
If the original criteria already had
ranks -
r'j, then the rank of the group in this case can be
defined as the sum of the ranks of the criteria that make it up.
2.
The sum of the correlation coefficients between
the criteria that make up the group and the criterion
g, which will
replace the entire group:
|

|
(3)
|
In case of initial criteria ranked:
|

|
(4)
|
Thus, as a result of applying this method,
we get a new decision-making problem, characterized by the same choice set, but
having a smaller number of criteria and supplemented by the ranks of these
criteria:
A
'={a'i}, where
a'i
= {( ai,j;rj)}, 1 ≤
j
≤
K'
≤
K,
K'
– new count of criteria.
The noted advantages and disadvantages of
various methods of three-dimensional visualization of many alternatives and
criteria are presented in Table.
1.
Table
1.
Compare methods for visualizing multi-criteria alternatives
|
Method
|
Ranking of
criteria's
|
Grouping of
criteria's
|
Filtering of
alternatives
|
|
Histograms of
alternatives
|
-
|
-
|
+
(count of alternatives is small and the count of criteria is
large)
|
|
Histograms of
criteria
|
-
|
+
(excluding criteria with similar histogram, depends on the
relative position of the criteria)
|
-
|
|
Correlation
surface
|
+
(can be used when count of alternatives and criteria is large)
|
+
(can be used when count of alternatives and criteria is large)
|
-
|
The effectiveness of research and analysis of three-dimensional
images depends significantly on a foreshortening of view. Therefore, for this
problem, it is important for the ability to change the foreshortening of the
constructed three-dimensional image. At the same time, the analyst should have
a convenient tool for making a quick change of foreshortening. The best way to
do this is to construct a three-dimensional model of the scene containing the
corresponding visual images, and control the foreshortening with the camera, as
is done in modern environments and 3D modeling tools.
Appropriate tools that ensure the
implementation of the following functions should accompany visual analytics of three-dimensional
images of multi-criteria alternatives:
·
hide and show alternative;
·
hide and show criterion;
·
alternatives permutation;
·
criteria permutation;
·
selection of a specific alternative as a focused one (when using the
method of visualizing alternatives as a single image);
·
selection of a specific criterion as a focusable one (when using the
method of visualizing criteria as a single images);
·
in case of visualizing alternatives with as a single image (Fig.
1-2), when focusing on a specific alternative, automatically change a color of
remaining alternatives based on a level of similarity with the selected one
(for example, by applying a gradient);
·
in case of visualization of criteria as a single image (Fig. 3)
when choosing a criterion, automatically change a color of remaining criteria
based on a level of similarity with the selected one;
·
automatic reordering of alternatives depending on a level of
similarity with the focusable alternative;
·
automatic reordering of criteria depending on a level of similarity
with the focusable criterion;
·
in case of using the three-dimensional visualization method of
criteria's correlation, provide an ability to customize a scales of a level of
similarity for automatic grouping of criteria.
It is also possible to improve the quality of
visual analytics of images obtained by the methods discussed above by using
autostereoscopic displays, which make it possible to increase the efficiency of
perception of three-dimensional images [11].
Consider the operation of the described methods
for the problem of choosing the optimal solver OpenFoam [12, 13].
Alternatively, consider three solvers – rhoCentralFoam, pisoCentralFoam,
sonicFoam. The criteria are the results of calculating the deviation norm L1 of
the numerical solution from the analytical one for the three-dimensional
problem of inviscid flow around a cone. The computational problem was solved
for following variants of initial parameters:
1.
Mach number: 3, 5, 7.
2.
Cone half-opening angle (in degrees): 10, 15,
20.
3.
Angle of attack (in degrees): 0, 5, 10.
In total, 24 values were calculated (for the
combination of half-opening angle = 10° and angle of attack = 10°, no
calculations were performed).
To begin with, constructing a correlation
surface and making criteria's permutation so that we clearly have groups (Fig.
5).
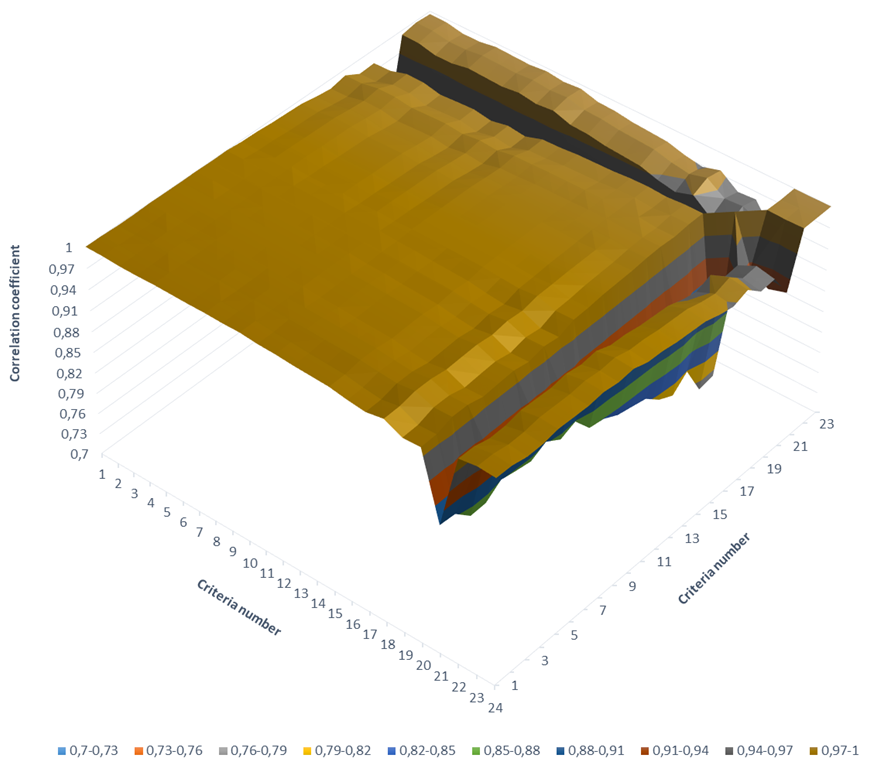
Fig.
5.
The surface of the criteria's
correlation
In this figure, there are following groups
(as the basic was using criterion with the maximum average correlation with
other criteria of the group):
1.
Criteria 1-12 (basic criterion – 7th).
2.
Criteria 13-18 (basic criterion – 18th).
3.
Criteria 19-20 (basic criterion – 19th).
4.
Criterion 21.
5.
Criteria 22-24 (basic criterion – 24th).
The ranks of the new criteria are as follows:
{11.9966; 5.9983; 2; 1; 2.9995}. Visualize all three
alternatives only for these remaining five criteria, sorted in descending order
of rank (Fig. 6). As you can see in this figure, the far alternative
(corresponds to the sonicFoam solver) is significantly worse than the other two
(all columns below), i.e. it can be filtered.
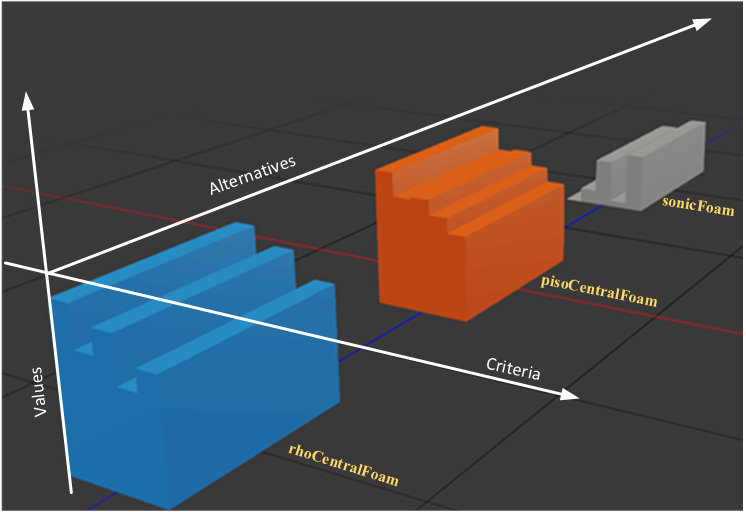
Fig.
6.
Three-dimensional visualization of three alternatives after
grouping criteria
The use of the developed methods for constructing
and researching
three-dimensional
images of multi-criteria alternatives made it possible to reduce
count of alternatives to two, and count of criteria to five. Thus, the ranks of
these criteria were obtained; one of the criteria (№ 21) has a substantially
different correlation to the others, which may indicate that the corresponding
computer experiment was performed incorrectly. This assumption was confirmed
during the repeated experiment and the values of the deviation norms were
corrected. The corresponding surface of the correlation of the criteria after
the refinement of the experimental results is shown in Fig. 7.
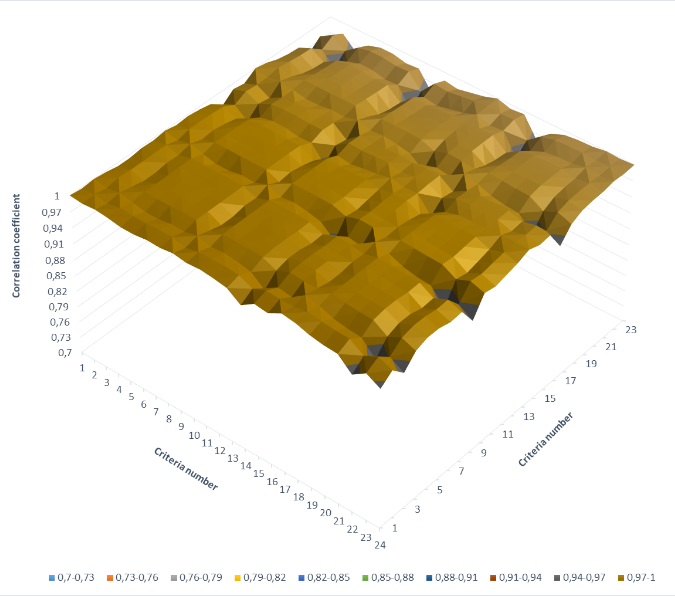
Fig. 7.
The surface of the criteria's correlation after clarification of the
experimental results
Between the remaining two alternatives (Fig. 6)
there is no longer such an unambiguous predominance, but traditional
decision-making methods can already be applied to the choice of the best one.
We solve this problem with four different decision-making methods - SMART,
REGIME, PROMETHEE, TAXONOMY [2], and in all cases, we find that the solver
rhoCentralFoam is a more preferred alternative (Fig. 8-10).
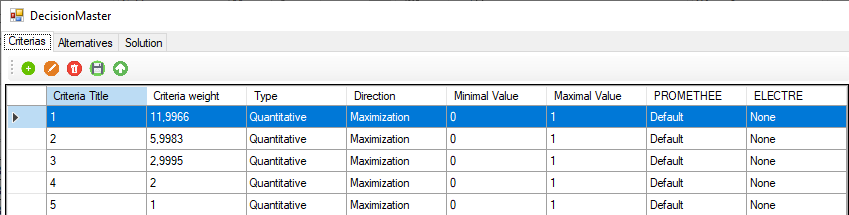
Fig. 8.
Criteria
settings in decision-making problem on choosing a best solver
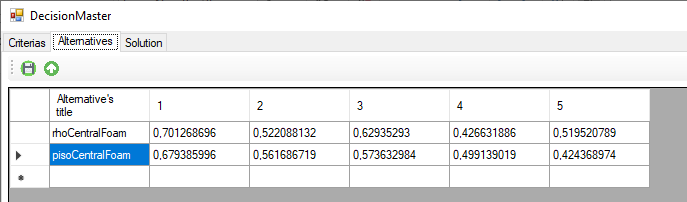
Fig. 9.
Description of alternatives in decision-making problem on choosing a best
solver
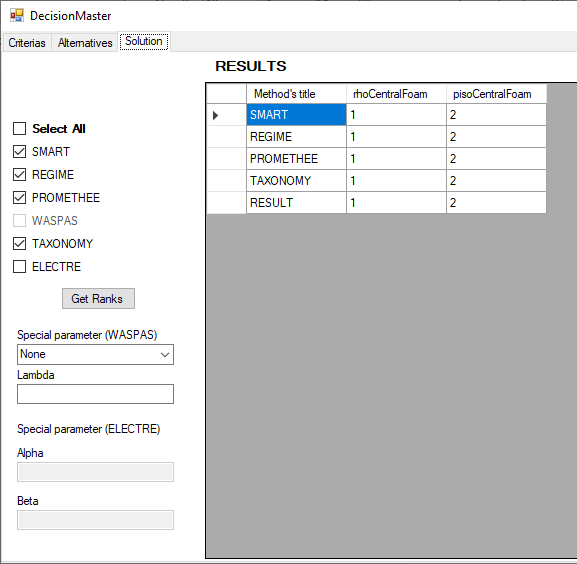
Fig. 10.
Solving the problem of choosing the best solver using different methods
The developed methods for constructing and
researching three-dimensional images of multi-criteria alternatives allow
solving the problems of reducing the set of alternatives, reducing the criteria
by grouping them, as well as ranking the criteria. The use of the developed
method for visualizing alternatives as single images allows for their visual
filtering, and the use of the criteria visualization method as a single image
in combination with the construction and analysis of the surface of the
criteria's correlation allows grouping and ranking them. The experiment has
demonstrated the effectiveness of the developed methods, since using visual
analytics, we get a rationale for reducing the count of alternatives and
criteria.
The development of methods for visualizing
alternatives and criteria, as well as methods for their visual analytics and
research, makes it possible to improve the quality and validity of the
decisions obtained when choosing preferred alternatives and reduces the
likelihood of errors when using traditional methods of decision-making by
reducing the dimension of the original problem.
It is possible to increase the efficiency of the described methods
through the development and use of specialized software tools for visual
analytics, which is one of the promising areas for the development of this
topic.
The work was supported by Russian Science
Foundation grant № 18-11-00215.
1.
Castañón-Puga, M., Sanchez, M., Aguilar, L.,
Rodríguez-Díaz, A.: Applied Decision-Making. Applications in
Computer Sciences and Engineering. Springer (2019). DOI:
10.1007/978-3-030-17985-4.
2.
Alinezhad, A., Khalili, J.: New Methods and Applications in Multiple
Attribute Decision Making (MADM). Springer, Cham (2019). DOI:
10.1007/978-3-030-15009-9.
3.
Runkler T.: Data Visualization. In: Data Analytics. Springer Vieweg,
Wiesbaden (2016). DOI: 10.1007/978-3-658-14075-5_4.
4.
Podvesovskii. A.G., Isaev, R.A.: Visualization Metaphors for Fuzzy
Cognitive Maps. Scientific Visualization 10(4), 13-29 (2018). – DOI: 10.26583/sv.10.4.02.
5.
Zakharova, A.A., Shklyar, A.V.: Informative features of data
visualization tasks. Scientific Visualization, 7 (2), 73-80 (2015).
6.
Zakharova, A.A., Shklyar, A.V., Rizen, Y.S.: Measurable features of
visualization task Scientific Visualization, 8 (1), 95-107 (2016).
7.
Averchenkov, V.I., Miroshnikov, V.V., Podvesovskiy, A.G.,
Korostelyov, D.A.: Fuzzy and Hierarchical Models for Decision Support in
Software Systems Implementations, A. Kravets et al. (Eds.). In: JCKBSE 2014,
Communications in Computer and Information Science, vol. 466. pp. 410-421.
Springer International Publishing (2014). DOI: 10.1007/978-3-319-11854-3_35.
8.
Figuera, J., Greco, S. Ehrgott, M. (Eds): Multiple Criteria Decision
Analysis: State of the Art Surveys. Springer, New York (2005). – DOI:
10.1007/b100605.
9.
Zakharova, A.A., Korostelyov, D.A., Fedonin, O.N.: Visualization
Algorithms for Multi-criteria Alternatives Filtering. Scientific Visualization
11(4), 66-80 (2019). DOI: 10.26583/sv.11.4.06.
10.
Cohen, J., Cohen, P., West, S., Aiken, L.: Applied Multiple
Regression/Correlation Analysis for the Behavioral Sciences. Routledge, New
York (2003). DOI: 10.4324/9780203774441
11.
Andreev, S.V., Bondarev, A.E., Bondareva, N.A. Stereo images of
error surfaces in problems of numerical methods verification. Scientific
Visualization. 12(2), 151-157 (2020). DOI: 10.26583/sv.12.2.12.
12.
Bondarev, A.E., Kuvshinnikov, A.E. Analysis of the Accuracy of
OpenFOAM Solvers for the Problem of Supersonic Flow Around a Cone. In: ICCS
2018, LNCS, vol. 10862. pp. 221-230. Springer, Cham (2018). DOI:
10.1007/978-3-319-93713-7_18.
13.
Bondarev, A., Kuvshinnikov, A.: Comparative Estimation of QGDFoam
Solver Accuracy for Inviscid Flow Around a Cone. In: IEEE The Proceedings of
the 2018 Ivannikov ISPRAS Open Conference (ISPRAS-2018). pp. 82-87 (2018). DOI:
10.1109/ISPRAS.2018.00019.
