The development of digital systems for image recording and
processing has significantly expanded the capabilities of optical diagnostic
methods.
Among the methods of
digital image processing, in the field of optical-physical registration, the
cross-correlation algorithm is the most widely used. This algorithm is
successfully applied in the shadow background method [1] and in the digital
tracer visualization method [2]. The use of cross-correlation processing allows
us to obtain quantitative information about the studied environment in addition
to qualitative data.
The
experimental data obtained in this way allow to conduct the verification of
numerical modeling techniques, which is demonstrated in [3 – 6].
The purpose of
this work is to study the explosion in dry sandy ground, the verification of
numerical method, and work out the method of optical and physical registration
of the disturbance of the free surface of the ground. The results of the work are
planned to be used in the future as the basis for determining the detonation’s
depth the specified mass of TNT equivalent explosives or mass of TNT
explosives at a predetermined depth.
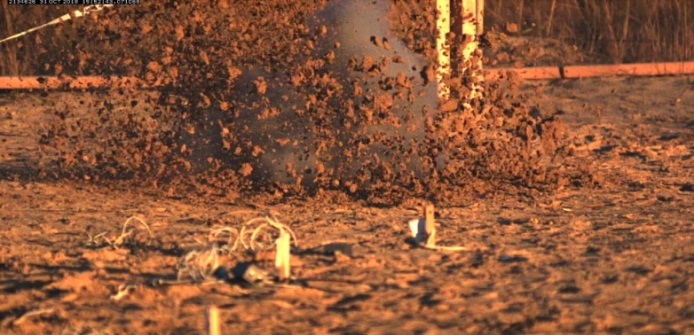
An experimental
study of a buried blast was performed by high-speed video recording of the
surface of sandy ground (Figure 1). Two experiments were carried out in which a
cylindrical high explosive charge (HE) located at a depth h from the free
surface of the field was initiated (0.5 m in experiment 1, 0.5 m in experiment
2). The mass of HE in TNT equivalent was 0.113 kg.
The initiation of the charge was carried out using a high voltage
generator (VG). Simultaneously with the activation of the VG, a high-speed
video camera was switched on.
Video
recording was performed with a frame sequence period of 0.24 ms, a frame
exposure time of 50 µs, and a resolution of the camera matrix of 1440×700
pixels.
Video recording was
performed from a distance of Z=32 m. The spatial resolution of the video
recording scheme in the area of the explosion epicenter was 0.6 pixel/mm.
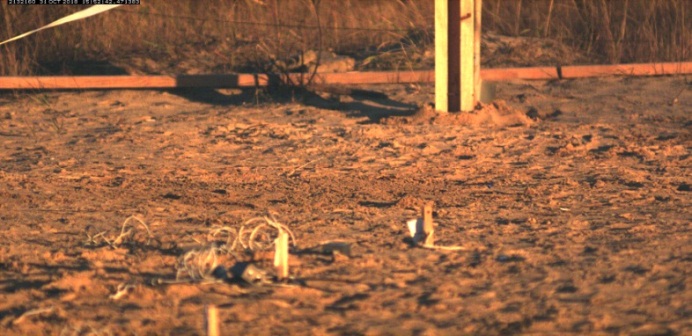
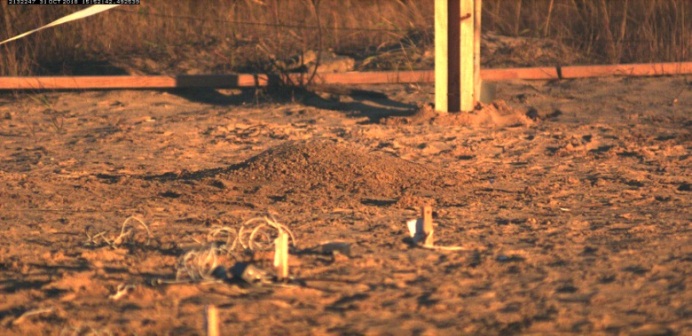
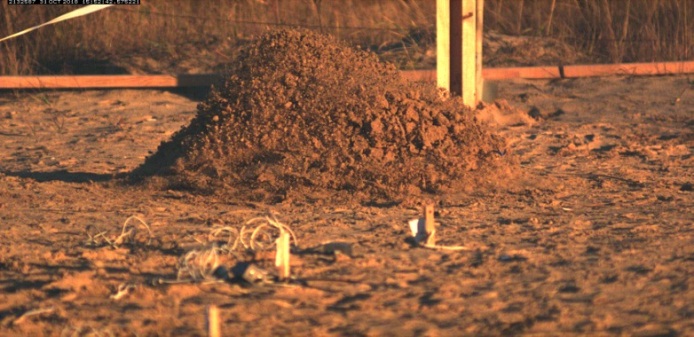
In experiments, the same
pattern of ground dome formation and its expansion was registered.
Starting at a time
of ~ 60 ms, the dome begins to fragment. The upward movement of ground
particles continues until ~ 570 ms,
then there is a change of direction. Figure
2 shows, as an example, fragments of video registration obtained during
experiment 1.
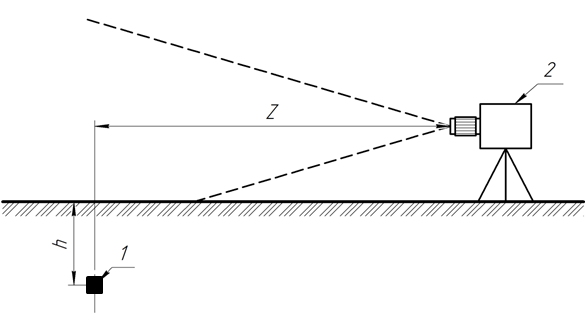
Figure 1-video recording scheme: 1-explosives
charge (HE), 2-high-speed video camera.
|
|
|
|
t
= 17.70
ms
|
t
= 38.86
ms
|
|
|
|
|
t
= 121.54
ms
|
t
= 617.38
ms
|
Figure 2-Fragments of video recording the epicenter’s area of a
deep explosive charge explosion.
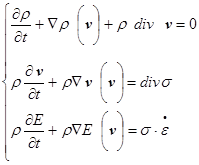
Numerical simulation was performed using an explicit solver on a
three-dimensional Euler grid.
The system of
equations describing the flow of the medium [7] has the form
|
|
|
|
(1)
|
|
|
where
 - the
density of medium,
v
- the velocity vector of medium,
F
- the
vector field of mass forces,
- the
density of medium,
v
- the velocity vector of medium,
F
- the
vector field of mass forces,
 – stress tensor,
 - strain rate tensor,
E
– internal energy
t
- current time.
- strain rate tensor,
E
– internal energy
t
- current time.
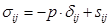
The stress-strain state at a point in the calculated area was
determined by the General system of equations:
|
p
=
p
(
ρ,
E
)
,
|
(2)
|
where
 - stress
tensor,
- stress
tensor,
 - stress tensor
deviator,
- stress tensor
deviator,
 - Kronecker’s
symbol,
- Kronecker’s
symbol,
p
- the hydrostatic pressure given by
the equation of state (SE).
The geometric parameters of the calculation model are shown in
figure 3. Each part of the calculation model corresponds to its own
mathematical model of the material.
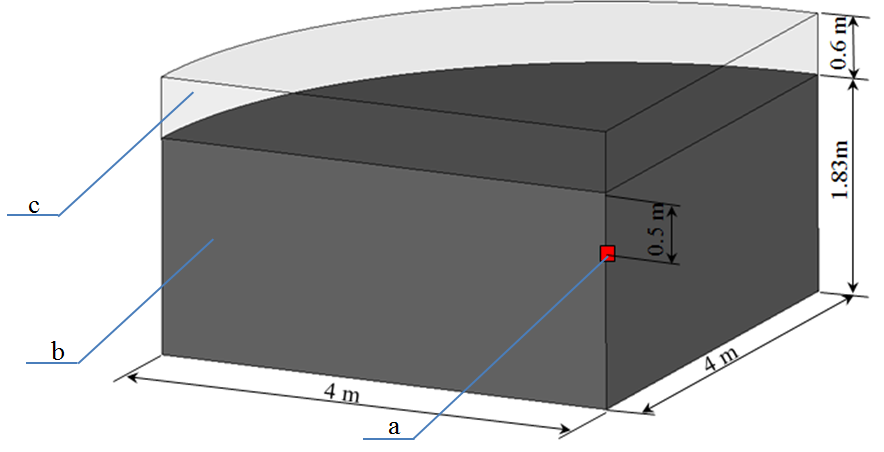
Figure
3-Geometry of the calculation model: a-explosive substance, b-sandy ground, c-air.
Air in the
calculation was described as a continuous medium with the equation of state of
an ideal gas:
|
|
(3)
|
where
 = 1,4 - adiabatic index,
E
-internal
energy per unit volume,
= 1,4 - adiabatic index,
E
-internal
energy per unit volume,
 -
initial density.
-
initial density.
To specify the explosive material, a special model of
explosive was used, which allows modeling the detonation and flow of explosion
products [8, 9].The pressure in the element HE in each moment of time is
determined by the formula
|
 ,
,
|
(4)
|
where
 – percentage
of explosive burnout
– percentage
of explosive burnout
 ,
,
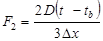 ,
ρ
– density explosives,
D
– detonation velocity,
P
CJ
- pressure Chapman-Jouguet,
t
b
– element burn-out time,
Δ
x
- the characteristic element size.
,
ρ
– density explosives,
D
– detonation velocity,
P
CJ
- pressure Chapman-Jouguet,
t
b
– element burn-out time,
Δ
x
- the characteristic element size.
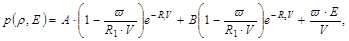
SE for explosives detonation products is accepted in the form of
Jones-Wilkins-Lee [8, 10]:
|
|
(5)
|
where
 is the
relative volume of detonation products HE during the explosion,
A, B, R1,
R2, ω
are empirical constants,
E
is the internal energy
assigned to a unit of volume,
is the
relative volume of detonation products HE during the explosion,
A, B, R1,
R2, ω
are empirical constants,
E
is the internal energy
assigned to a unit of volume,
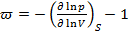 - when the explosion products expand to a value of
V >10, S
is the entropy.
- when the explosion products expand to a value of
V >10, S
is the entropy.
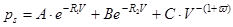
Equation (1) corresponds to the isentrope of the explosion
products:
|
|
(6)
|
The parameters of the HE material model adopted in accordance with
[11] are shown in table.1.
The parameters of SE HE are taken in accordance with [11] and are
shown in table. 2.
Table 1 - Parameters of the explosives material model
|
Explosives
density
ρ
, kg/m
3
|
Detonation
speed
D, km/s
|
Pressure
Chapman-Jouguet
P
CJ
, GPa
|
|
1821
|
8.48
|
34.2
|
Table 2-Parameters of the equation of
state of detonation product HE
|
A
,
GPa
|
B
,
GPa
|
R
1
|
R
2
|
ω
|
|
748.6
|
13.38
|
4.5
|
1.2
|
0.38
|
Elastic properties of sandy ground were assumed
according to Table 3 [12].
Table 3-Elastic properties of sand
|
Density
of sand

|
Shear
modulus

|
Poisson
Ratio

|
|
1.5
|
150
|
0.3
|
The dependence of the yield strength of
sand on pressure was determined by the ratio in accordance with [13]
|
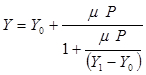 ,
,
|
(7)
|
where
 is the
adhesion (strength at zero pressure)
is the
adhesion (strength at zero pressure)
 – the value that restricts
the intensity of shear stresses from above:
– the value that restricts
the intensity of shear stresses from above:
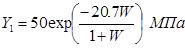 [13], W – weight humidity
in fractions of a unit.
[13], W – weight humidity
in fractions of a unit.
 – the value associated with
the coefficient of internal friction, φ - the angle of internal friction.
– the value associated with
the coefficient of internal friction, φ - the angle of internal friction.
Parameter values, and are shown in Table. 4.
Table 4 - Parameters of sandy ground taken in the
calculation [12]
|
Density
of sand

|
Parameter value
|
|

|

|

|
|
1.5
|
0.01
|
8
|
0.91
|
A graphical representation of the dependence of the
yield strength on pressure is shown in Figure 4.
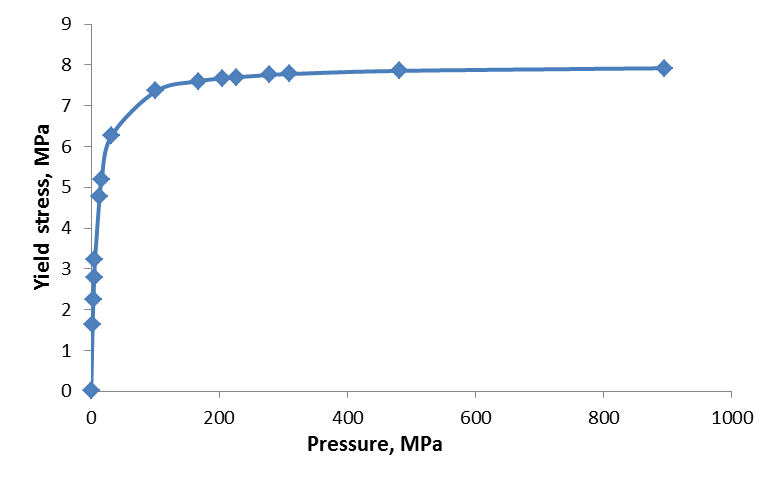
Figure 4-Dependence of yield strength on
pressure
The graph of the logarithm’s
dependence of the relative volume on the pressure when compressing sandy ground
is shown in Figure 5.
On the graph,
 , where V - the current volume, V0 - the initial volume, and
θ
- the volumetric strain. The dependence of the volume strain
on the pressure has the form [14]:
, where V - the current volume, V0 - the initial volume, and
θ
- the volumetric strain. The dependence of the volume strain
on the pressure has the form [14]:
|
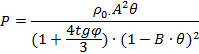
|
(8)
|
where tgφ=0.6
- the internal friction angle tangent, A = 511 m/s is the coefficient of impact
adiabate [12], B = 1.72 is the coefficient of impact adiabate [12].
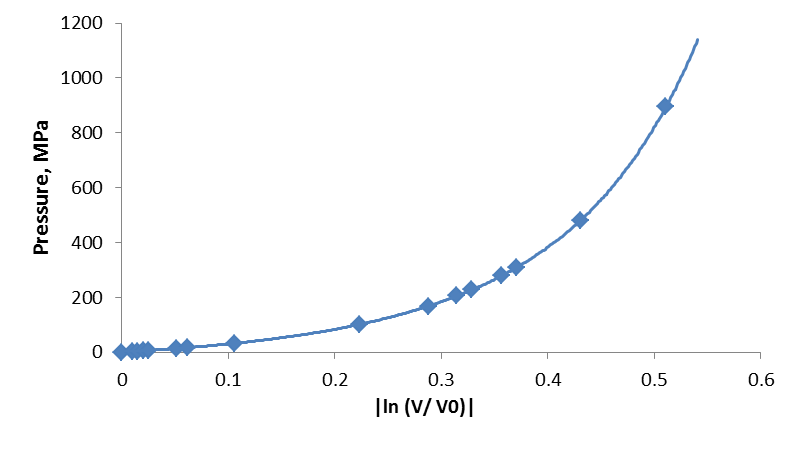
Figure 5-Dependence of strain on pressure
The Unloading module
for different density values p is defined by the formula [14]
|

|
(9)
|
where
 - the function of density dependence on the pressure.
Numerical simulations were performed using an explicit
solver on a three-dimensional Euler grid
The video information obtained in the experiments was used to
determine the dome’s height of the sandy ground (H) at discrete moments of time.
Direct measurement of the dome height by video recording frames caused
difficulties, especially for small H values, related to identifying the top
point of the ground dome. To solve this problem, we used cross-correlation
processing of video recording frames. A multi pass cross correlation processing
algorithm with a square survey window and 50% overlap was used.The size of the
survey window was iteratively reduced from 256 to 8 pixels. Approximation of
the correlation function was carried out using three-point Gaussian
interpolation without pre-processing images. The fast Fourier transform
algorithm was used to calculate the correlation function.
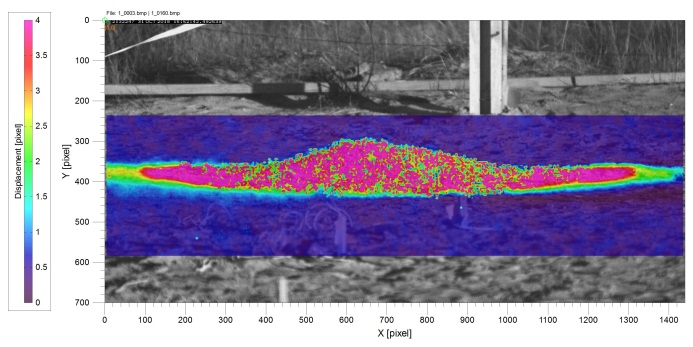
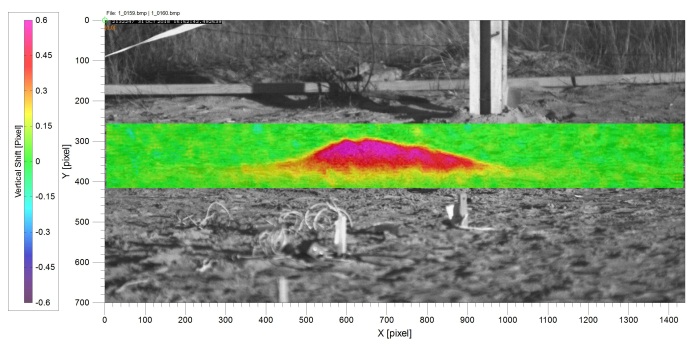
Fragments of the results of cross-correlation processing of video
recording frames are shown in Figure 6. The sequential image analysis was
performed after the explosion of explosive charge HE with the image of an
undisturbed surface of sandy ground.This approach allows to visualize the field
areas of displacement of the ground surface where there is no significant
change in its structure. The received information can be used for estimating the
diameter of the disturbance area (Figure 7), but is not suitable for
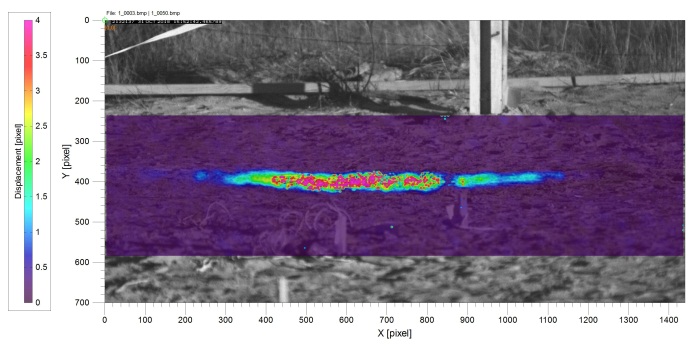
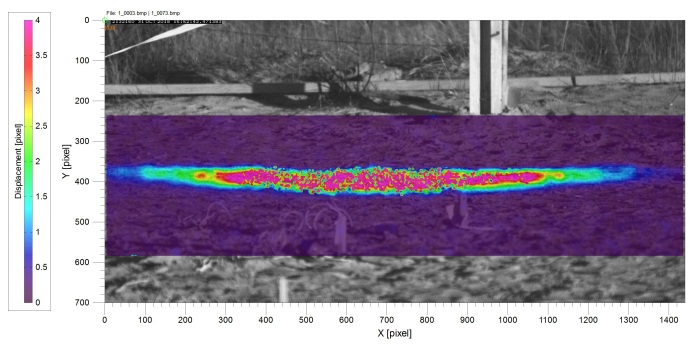
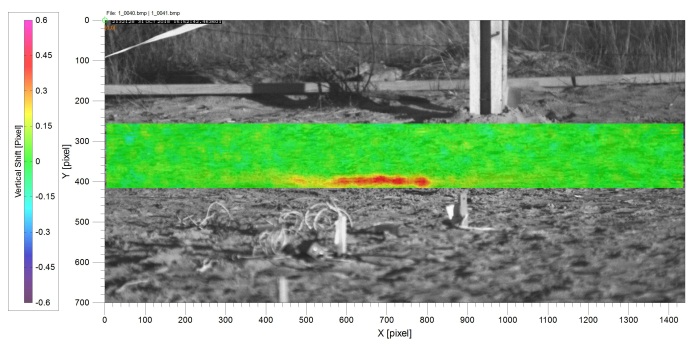
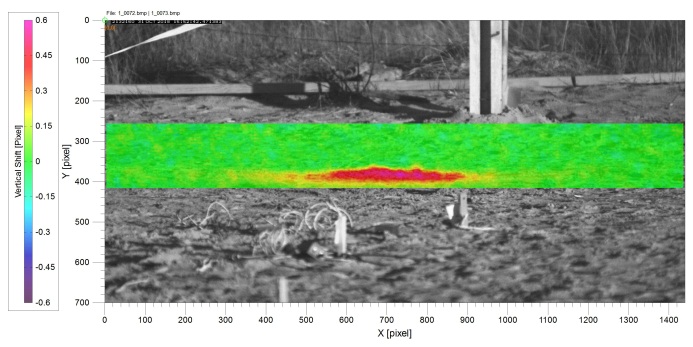
determining the height of the ground dome.For information about the height of
the dome of the sandy ground, the surface structure of which changes, two
consecutive images of the sandy surface were analyzed, and the maximum change
in the analyzed area in the vertical direction was determined (Figure 8). Thus,
the increment of the height of the ground dome H was determined for the time
equal to the video registration period The cross-correlation processing
algorithm allows to analyze images in the sub-pixel area, in this case, the
standard deviation from the increment H was 0.06 pixels, which, taking into
account the registration scheme, is 0.1 mm. Experimental data in comparison
with the results of numerical simulation are presented in Figure 9 as a graph
of the ground dome height dependence on time
|
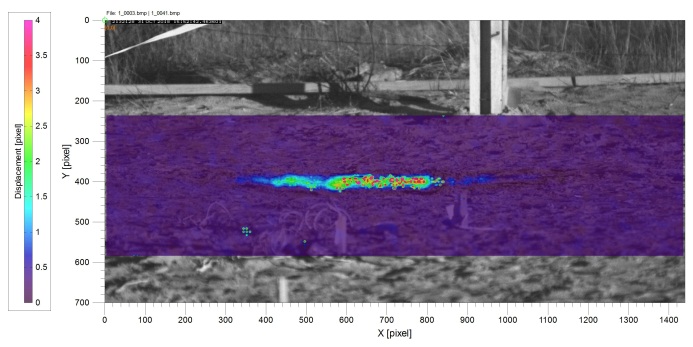
|
|
|
t
= (0 – 9.92)
ms
|
t
= (0 – 12.11)
ms
|
|
|
|
|
t
= (0 – 17.70)
ms
|
t
= (0 – 38.86)
ms
|
Figure
6-Experimental values of the displacement field (absolute values) of sandy ground
relative to its initial (undeformed) state
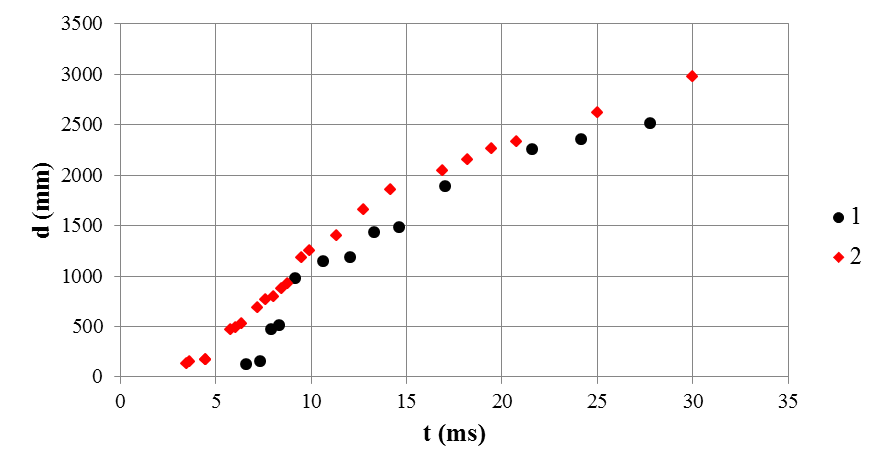
Figure
7-Estimated data on the diameter of the perturbation area: 1 – experimental
data at h=0.55 m, 2-experimental data at h=0.5 m.
|
|

|
|
t
= (9.68 – 9.92)
ms
|
t
= (11.87 – 12.11)
ms
|
|
|
|
|
t
= (17.46 – 17.70)
ms
|
t
= (38.62 – 38.86)
ms
|
Figure
8-Experimental values of the displacement field (vertical component) of sandy ground
that occurred during the frame period of video registration
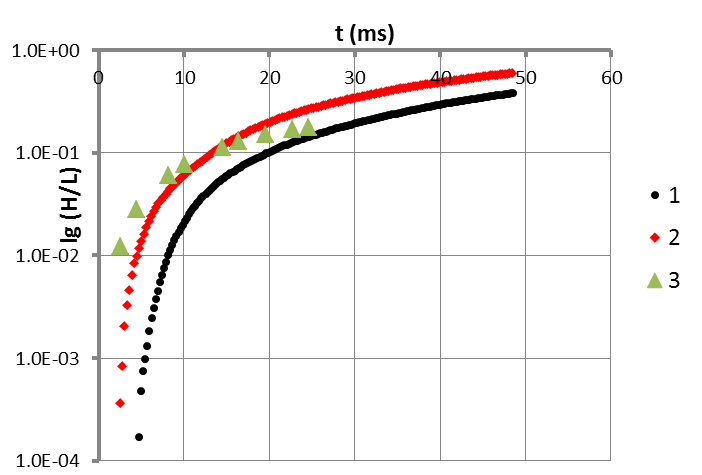
Figure
9 - Dependence of the height of the ground dome on time: 1-experimental data at
h=0.55 m, 2-experimental data at h=0.5 m; 3-calculated data for h=0.5 m.
From the analysis of the results of experiments and calculations, it
can be concluded that the ground dome ‘s rate of growth increases up to a
certain point in time, after which it becomes almost constant. This can
probably be explained by the fact that at the initial stage of the explosion’s
development in the cavern, the high pressure of the explosion products promotes
accelerated movement of a solid mass of ground. After the expansion of the
cavern, the pressure of the explosion products decreases - the rate of growth
of the dome height also decreases.
The comparison of calculated and experimental data is given up to
the time of 25 ms, since after that the dome begins to fragment into separate
parts, which cannot be described by numerical algorithms within the continuum
model.
The paper considers an experimental and computational investigation
of a cylindrical charge explosion in dry sandy ground with a density of 1.5
g/cm3. During the experiment, optical and physical registration of the disturbance
development process on the ground surface was used. The diameters of the
perturbation zone and the height of the dome were determined using a
cross-correlation image algorithm. The correlation function was approximated
using three-point Gaussian interpolation without pre-processing images. The
fast Fourier transform algorithm was used to calculate the correlation
function. The results of numerical simulation are also presented. The
comparison of the calculated data on the height of the sandy ground discharge
and the experimental data on the height comparison showed their satisfactory
correspondence, which indicates the adequacy of the applied mathematical model.
The work was
supported by the grant of the President of the Russian Federation no. MK-2078.2019.8.
1.
Raffel,
M. Background-oriented schlieren (BOS) techniques. // Experiments in Fluids.
2015. Vol.56. № 3. P. 1-17.
2.
Adrian,
R.J. Twenty years of particle image velocimetry. // Experiments in Fluids.
2005. Vol. 39. No. 2. P. 159-169.
3.
Interaction
of numerical and experimental visualization of flows. I. A. Znamenskaya [et
al.] // Scientific visualization. 2013. Vol. 5. No. 3. P. 40-51.
4.
Using
the shadow background method to study a non-stationary flow with a shock wave.
F. N. Glazyrin et al. // Scientific visualization. 2013. Vol. 5. No. 3. P.
65-74.
5.
In situ
velocity and stress characterization of a projectile penetrating a sand target:
experimental measurements and continuum simulations. J.P. Borg et al. //
International Journal of Impact Engineering. 2013. Vol. 51. P. 23-35.
6.
Computational and experimental study of shock-wave loading
of optically transparent bodies. S. I. Gerasimov et al. // Technical Physics.
2019. Vol. 89. No. 9. P. 1319-1324.
7.
Muizemnek A.Yu., Bogach A.A. Mathematical modeling of
impact and explosion processes in the LS-DYNA program. Penza: Information and
publishing center of PSU, 2005.
8.
Hallquist J.O. LS-DYNA: Theoretical manual. Livermore
Software Technology Corporation, Livermore, 1998. 498 p.
9.
Souli M. "LS-Dyna Advanced Course in ALE and
Fluid/Structural Coupling". Course Note for Arbitrary Lagrangian-Eulerian
Formulation Technique. Livermore, LSTC, CA, 2000.
10.
Lee E., Finger M., Collins W. JWL equation of state
coefficients for high explosives. Rept-UCID-16189, Lawrence Livermore National
Laboratory, 1973.
11.
Orlenko A.P. Physics of explosion/ edited by L. P. Orlenko.
- Ed. 3rd, ISPR. - In 2 t. T. 1. Moscow: FIZMATLIT, 2004.
12.
Balandin V.V., Bragov A.M., Igumnov L.A., Konstantinov
A.Yu., Kotov V.L., Lomunov A.K. Dynamic deformation of soft ground media:
experimental research and mathematical modeling. Solid state mechanics, no. 3,
2015. PP. 69-77.
13.
Zamyshlyaev B.V., Evterev L.S. Models of dynamic
deformation and destruction of ground media. Moscow: Nauka, 1990. 215 p.
14.
Bazhenov V.G., Kotov V.L. Mathematical modeling of
non-stationary processes of impact and penetration of axisymmetric bodies and
identification of properties of ground media. M: FIZMATLIT, 2011. 208 p.
