The paper describes the results of the study of methods for analysis burning torch infrared images obtained by an infrared camera in the band of electromagnetic wavelengths of 1.5-5.1 μm. It was shown that the known infrared image analysis methods cannot provide the quantitative parameters extraction that could describe combustion process. In addition, it was figured out that the known methods are time-consuming and cannot run in real time. As a result, nowadays the combustion control system that uses optical control of torch parameters in infrared band cannot be designed.
In our study we analyzed the pixels quantity distribution density in the range of [520,560] relative Celsius degrees on each frame of the initial infrared sequence of burning torch. It was shown that the pixels quantity distribution has the bimodal distribution law and can be described by three local extremes coordinates: two maximums and a minimum located between them. The pixels that have relative degrees values in the range from 520 degrees to the value of the minimum’s abscissa and from the value of the minimum’s abscissa to 560 degrees relatively form two separate zones on the burning torch visualization.
It was demonstrated that time-domain series constructed from frame-by-frame calculated local extremes coordinates of the P(T) distributions are stationary random sequences. This result allows to use these time-domain series as quantitative parameters of the torch combustion. It was shown that the local minimum’s abscissa value of the P(T) distribution with a relative error of 2.8 % is a constant value equal to 536.3 relative degrees. This allows to count the pixels quantity of each of the separate zones without using time-consuming Rosenblatt – Parzen estimation and run data processing in real time.
At present, the torch combustion systems
that convert energy content of the fuel into the thermal energy are widely
spread in various industry branches. Nonetheless, these systems have
significant drawback, since the torch combustion is accompanied by formation of
harmful combustion products and subsequent environmental pollution. Therefore,
the reduction of harmful content (such as nitrogen oxides group NO
x
)
is the pressing problem. One of the possible approaches to harmful content
reduction in exhaust gases is based on the implementation of the modern and
accurate automatic combustion control systems that perform real-time
measurements of the combusting torch parameters.
In order to measure the torch combustion
parameters, contact [1] or non-contact (e.g. PIV systems [2]) sensors are
traditionally used. The contact sensors are usually mounted inside the torch
that results in transformation of the torch heat and mass transfer mode. Also,
the problem of positioning a sensor that works under high thermal stress
conditions arises. Therefore, the contact torch measuring methods are
inappropriate for industrial application, and they are usually implemented only
in laboratory studies of the flames. The non-contact methods usually employ
optical cameras; they provide information about the field of measuring
parameter, instead of the point in contact methods. However, in present these
technologies are also implemented only in laboratory studies due to the problem
of the obtained data processing, in particular quantitative parameters
extraction from the initial data.
A matter of
major interest in non-contact torch investigation is optical investigation in
infrared (IR) band. This approach is fulfilled by using IR cameras, i.e.
thermal imagers, providing registration of the sequences of instant IR images
of the torch. The instant image of the torch is projected onto two-dimensional
system of photo sensors. Then the sensor output values (traditionally measured
in Volts) are calculated to the temperature values of the investigated object
surface, and the temperature field of this surface restored as a
two-dimensional image [3].
It should be
noted, that it is impossible to calculate a real temperature field of the
burning torch using IR imaging, because the emissive coefficients of the torch
surface are unknown. In this case it is assumed that the torch radiance is
measured in the relative units – relative Celsius degrees. Then the recorded
temperature field or its transformation into another feature space is
visualized as an image representing the color map. The examples of typical
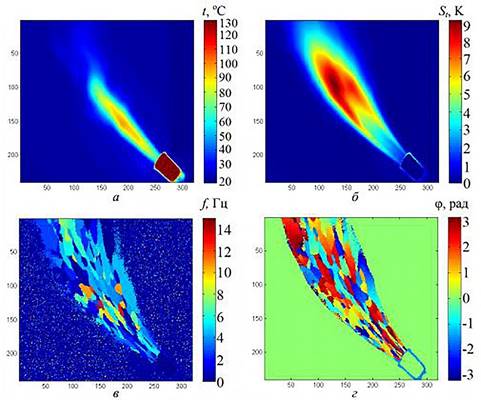
experimental data visualization are shown on fig. 1.
Figure. 1. The
visualization of instant IR images of the gaseous fuel torch (temperature field
) in various feature spaces: a) the standard deviation of the
temperature
;
б
) the field of temperature pulsations frequency
,
в
) the field of temperature pulsations phase;
г
) the
field of two-dimensional Wavelet transform coefficients of the initial IR
sequence [5]
Fig. 1 shows that the shapes of the torch
are different depending on the feature space. Also, in the space of pulsations
phase as well as in the space of wavelet coefficients the torch is represented
as a composition of the close to each other values segments. This result,
according to the authors of original investigation [5] demonstrates the
turbulent structure of the flame. However, there are no such structures on 1a,
1б images. Hence, the torch shape and the combustion parameters depend on the
feature space, and transfer between feature spaces does not simplify the
quantitative parameters extraction.
Therefore, the study of the torch IR data
analysis approaches in order to choose the quantitative parameters extraction
methods is a problem of great interest due to application in modern
automated combustion control systems.
The paper substantiates the choice of the
torch IR data processing methods that allow to extract the quantitative
parameters of the gaseous fuel torch combustion.
To perform the study the experimental
complex was constructed. This complex makes possible to obtain instant IR
images of the gaseous fuel torch at given frequency (IR video record). This
complex has been described in details in [6], and the experimental complex
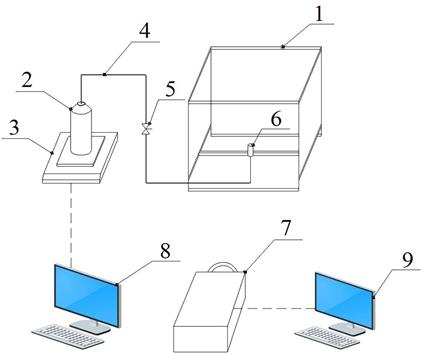
scheme is shown at fig. 2.
Figure 2. Scheme
of the experimental complex: 1 – the torch area frame, 2 – gas fuel container,
3 – the scales, 4 – connection tubes, 5 – ball valve, 6 – the burner, 7 –
thermal imager, 8,9 – operating personal computers
In that experimental complex the FLIR7700M
thermal imager is used, that obtain IR radiation in the 1.5 – 5.1 µm
wavelength. This thermal imager provides recording of IR images sequences of
the torch in resolution of 320×256 pixels with frequency of 412 Hz, the
record duration is 10 seconds.
Figure 3. Visualization
of the obtained initial IR images sequence
of the burning torch
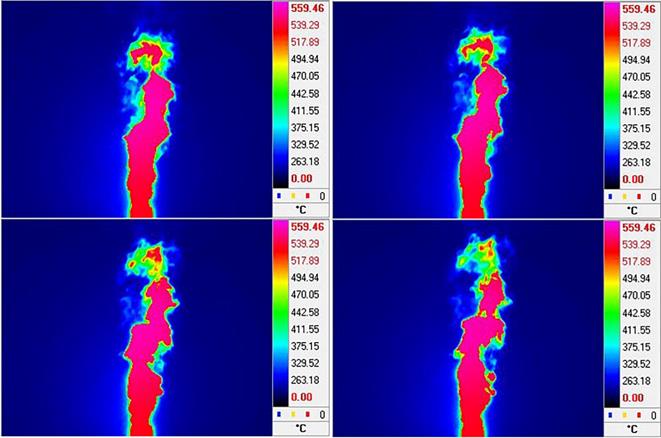
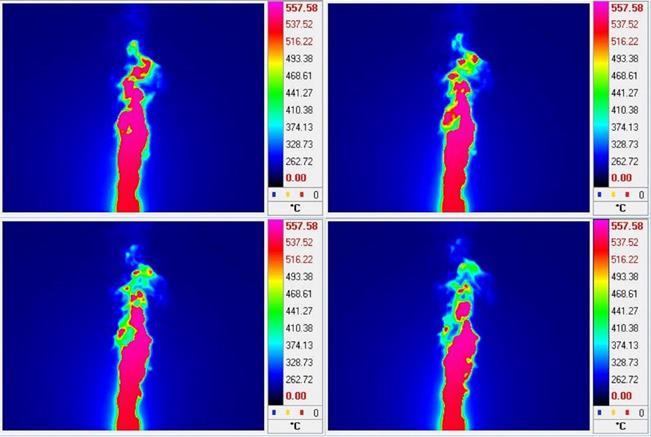
The results of the burning torch IR images
visualization using “Rainbow” color map are presented on fig. 4 (844-th,
846-th, 848-th and 850-th frames of the initial IR sequence).
Figure 4. The
visualization (using “Rainbow” color map) of the IR images of the burning torch
under continuous mode of the gaseous fuel supply mode: the interval between
adjacent frames is
seconds
Mathematically, the initial IR sequences are
three-dimensional arrays
with size of 320×256×4120 (
i
,
j
− pixels quantity in the
ХоY
plane,
k
− frame number). Typical pixels distribution on the the
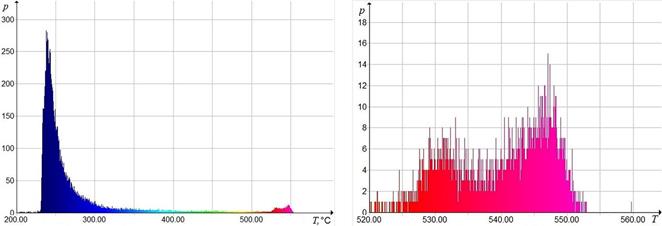
ranges of the relative temperature values is shown on fig. 5.
Figure 5. Histogram (left) and its fragment
(right) of the series
Fig. 5. shows that on the initial IR image
of the burning torch three groups of pixels can be distinguished, with values
in the ranges of
,
, [520,560] relative Celsius degrees consequently.
The
analysis of the burning torches IR images showed that:
-
Pixels with values in the
range of
relative Celsius degrees represent background;
-
Pixels with values in the
range of
relative Celsius degrees are located at the
torch borders;
-
Pixels with values in the
range of [520,560] relative Celsius degrees are located in the area of the
torch.
Also,
fig. 5 shows that pixels distribution density
of
the series
(where
relative
Celsius degrees,
k
−
serial number
of the pixel) can be approximated by the line with two local maximums
and local minimum
located
between them. This feature of the
distribution
density makes possible to consider the series
as
a random series with bimodal distribution law.
To compute
the approximations of the
distribution density, in accordance with [7] the nonparametric
method – kernel density estimation (KDE) was applied. This method, also known as
Rosenblatt – Parzen approximation, is implemented in the MATLAB program library
ES&RP [8].
Approximation of the
series distribution
density was computing in accordance with the following algorithm.
1)
Selection of the current frame
from the initial IR sequence.
2)
Composition of the series
by deployment along the row of the selected frame
.
3)
Composition of the series
by deleting values less than 520 relative Celsius degrees.
4)
Computing of the
series distribution density using KDE method.
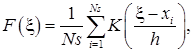
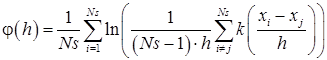
In the KDE method
restoring (approximation) of the distribution function of the random sequence
, where
is found as:
(1)
where
is a kernel function that
agrees with following features:
−
− monotonically decreasing
function, with range of values in
interval;
−
−this function is
symmetric relative to zero;
−
when
;
h −
scattering factor, that defines smoothness of the evaluation of distribution
function. (If the scattering factor is non-optimal, the Rosenblatt – Parzen
approximation will deviate from the true distribution function).
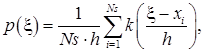
Respectively, the
distribution density of the random series
,
is calculated as:
(2)
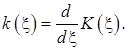
Where
(3)
Since in the KDE
method a range of kernel functions
is commonly used:
uniform, triangular, biweight, triweight, Epanechnikov, normal, and others,
there are two tasks to be solved in the KDE procedure:
1)
choice of the optimal value
for the smoothing parameter for the current kernel function.
2)
choice of the kernel
function which provides the best accuracy of the distribution density
approximation.
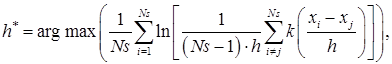
In [7] it was suggested to choose optimal
value of the smoothing parameter
by solving the equation:
(4)
and then choose the
function that has the maximum value
(5)
at the
condition.
The experience of ES&RP library
implementation showed that calculation of the
series density
distribution approximation even for only one IR frame requires significant time
excess (up to 417 seconds and more). Therefore, preliminarily 120 frames of the
initial IR sequence were selected and density distribution approximations of the
series
using KDE method and each of the common kernel functions was calculated. Then
the values of the function
were analyzed (
m
- is a number of the index of the current
kernel function), and it was figured out that on all 120 frames the maximum
value of the function
was reached when the normal distribution was used as a kernel
function. This result allowed to use only one (the best for our case) kernel
function that reduced the total processing time from 417 to 232 seconds.
An example of calculated KDE approximation
of the
series
density distribution, using normal distribution as a kernel function is shown
on fig. 6.
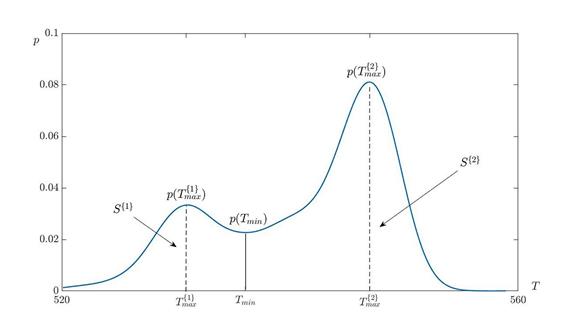
Figure 6.
The function
of the series
Fig. 6 shows that the distribution can be
described by the abscissa values of three local extreme points
,
and related values
of the function at these points:
and the value
(6)
and
:
(7)
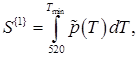
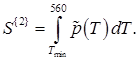
Knowing the
values of (6), (7), we can also calculate the quantity of the pixels
, with values in the
ranges of
and
relative Celsius degrees, respectively:
(8)
(9)
where
is the quantity of
the pixels with values in the ranges of
relative Celsius
degrees.
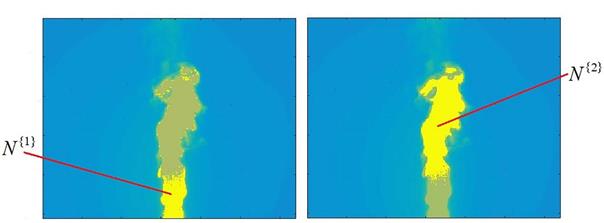
Then we performed an analysis of the pixels
location with values in the ranges of
and
relative Celsius
degrees at the initial IR frame. The analysis of the result demonstrated that
these pixels are located in two zones respectively, and these zones may be
approximated by the curves with no intersections and self-intersections (fig.
7).
Figure 7.
The visualization of the pixels zones, with values in the ranges of
(left) and
(right) relative Celsius
degrees
The comparison of the obtained result with
the known thermal-fluid dynamics torch combustion models showed that allocated
zones in the torch IR image correspond with the physical concepts of the torch
structure [9].
Using the selected quantitative indicators
that characterize the instantaneous state of the torch, the researchers can
describe the dynamics of torch fuel combustion. To do so the time sequences
(TS)
,
,
, should be compared
by computing the values of the related quantitative indicators for each frame
of the IR record of the torch. To describe the torch fuel combustion in terms
of their statistical and frequency-temporal characteristics one should make a
transition from the 3D matrix
to these time sequences.
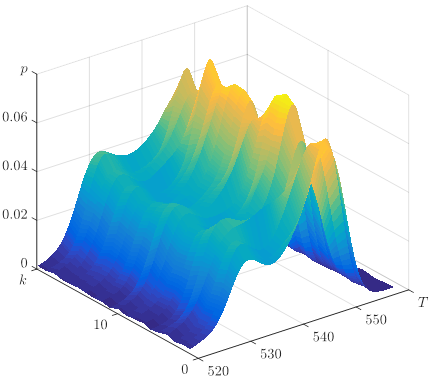
Figure 8.
Graphical representation of the surface built through approximations of
distribution density
sequences
with the time interval between adjacent frames of 0.0121
sec.
Based on the analysis of the surface
generated by approximations of the time sequences distribution density
, (Fig. 8) we draw a
conclusion that there are differences between functions
that manifest
themselves by different values of
in different frames.
This conclusion is supported by visual analysis of dependencies of the selected
quantitative indicators from time in some random sequences
,
,
. The detection of
this phenomenon necessitated verification of their stationarity.
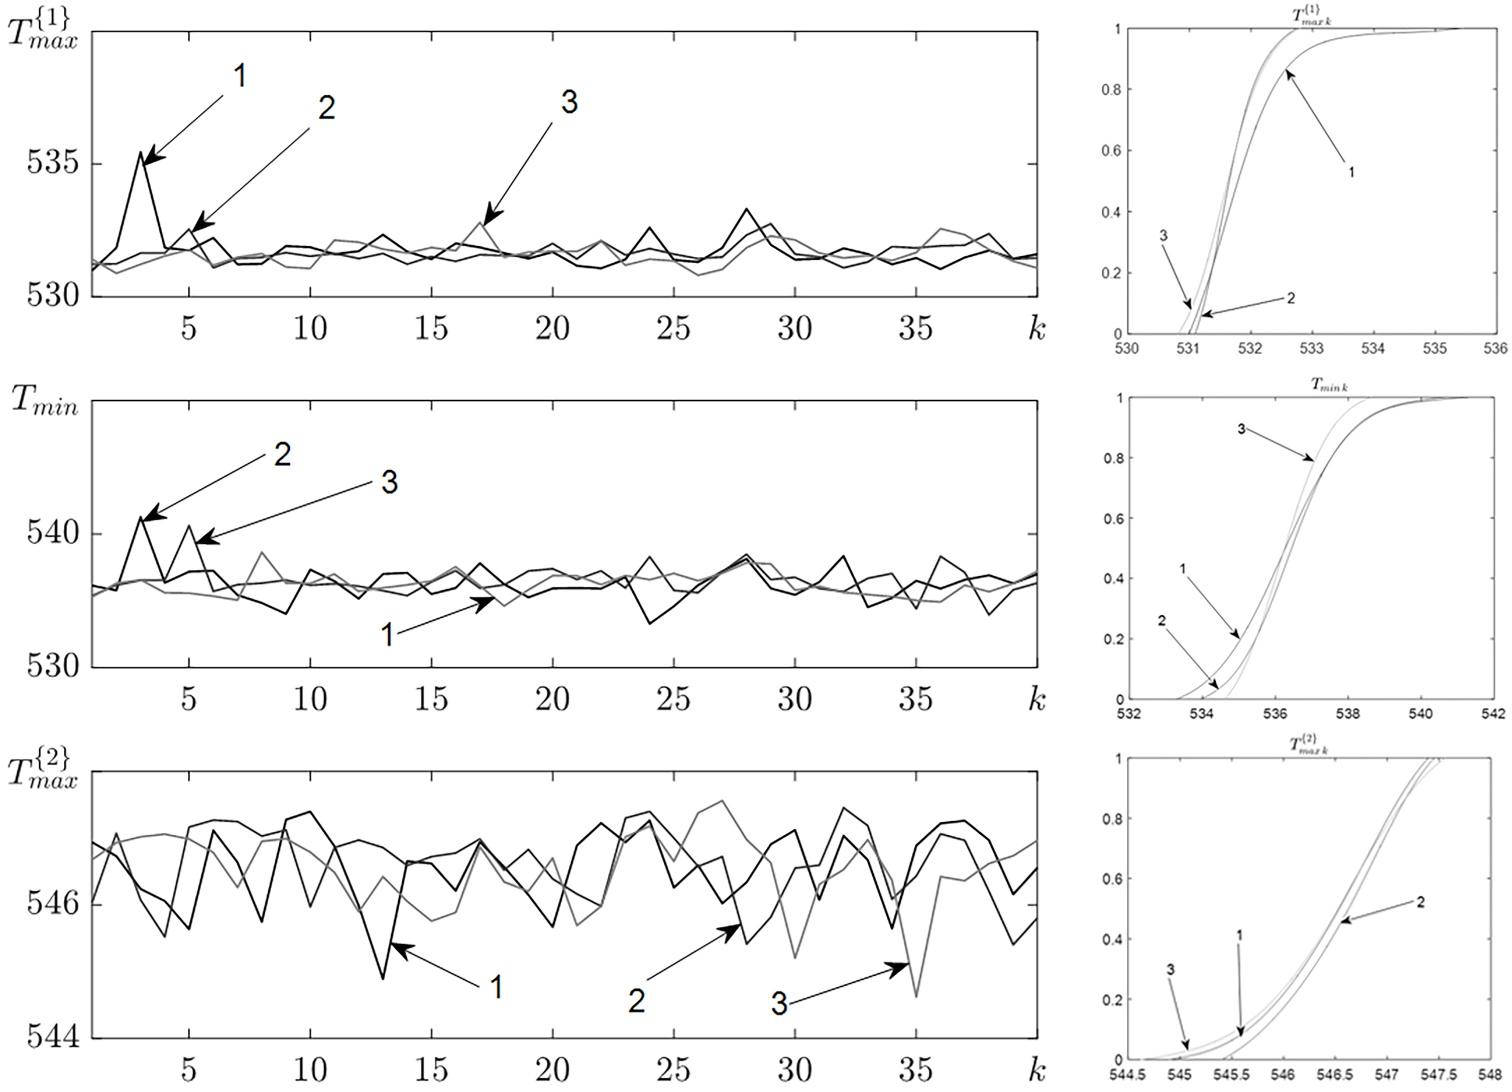
The study of stationarity of time sequences
,
,
employed the
procedure described on the example of TS ВР
:
1)
Three subsequences
,
и
were made, each 40 frames long. These
subsequences were extracted from the beginning, middle and end segments of the
original IR record
,
which was 10 second long. Samples were taken once each 5 frames, which equals
to the time interval of 0.0121 sec.
2)
Each frame of the
subsequences
,
,
was subjected to horizontal scanning to make
sequences
with their subsequent transformation to sequences
as per the described procedure.
3)
Determination of Rosenblatt
– Parzen approximations
for
each sequence
obtained at phases 1 and 2.
4)
Determination of
x-coordinate of the local extrema
,
of
Rosenblatt – Parzen approximations
for
each of the sequences
,
obtained at the phase 3 of this procedure.
Fig. 9 shows time sequences
,
computed for the
beginning, middle and the end segments of the burning torch IR imaging.
Components of these sequences were obtained through the procedure described
above.
Figure 9. ВР
,
,
(left) and their distribution
functions (right) at the selected segments of the IR thermal imager record: 1 –
beginning segment, 2 – middle segment, 3
−
end segment.
Then the approximation quantiles of TS
distribution functions
,
и
,
,
,
were calculated through the Rosenblatt – Parzen method. The above
functions are those for which the confidence levels are 0.05, 0.5 and 0.95 as
shown in Table 1.
Table 1. Quantiles of
Rosenblatt - Parzen approximations of time sequences distribution functions
,
и
,
,
,
Parameter
Segment of the IR thermal imager
Confidence level
Relative deviation of quantiles, %
0.05
0.5
0.95
0.05
0.5
0.95
Beginning
531.09
531.79
533.13
0.02
0.02
0.07
Middle
531.17
531.65
532.44
End
530.95
531.62
532.47
Beginning
534.00
536.27
538.84
0.09
0.02
0.09
Middle
534.60
536.45
538.76
End
534.90
536.25
537.94
Beginning
545.42
546.54
547.28
0.03
0.01
0.01
Middle
545.63
546.63
547.34
End
545.27
546.52
547.39
Beginning
0.0275
0.0344
0.0424
6.59
2.57
4.21
Middle
0.0313
0.0358
0.0405
End
0.0289
0.0341
0.0390
Beginning
0.0234
0.0294
0.0364
3.35
1.05
1.94
Middle
0.0232
0.0299
0.0374
End
0.0247
0.0300
0.0360
Beginning
0.0495
0.0652
0.0805
4.54
1.03
3.21
Middle
0.0530
0.0643
0.0765
End
0.0540
0.0655
0.0759
Beginning
1329
1782
2450
7.05
1.54
7.11
Middle
1312
1729
2283
End
1488
1747
2125
Beginning
2777
3903
4928
6.90
4.73
6.21
Middle
2859
3578
4375
End
3161
3871
4815
Beginning
4985
5667
6438
3.18
3.29
3.35
Middle
4683
5323
6060
End
4891
5597
6411
The table 1 demonstrates that
1) The quantiles of approximations of
distribution functions for time sequences
,
,
are close to each
other. Therefore, statistically the time sequences under study are partial
samples extracted from the corresponding sampled population.
2) The quantiles of approximations of
distribution function for the time sequence
at confidence levels
0.05, 0.5, 0.95 differ for no more than 1.8%. Therefore, the quantitative
parameter
can be assumed a constant equal to 536.3. This result allows to
calculate quantitative indicators of the combustion process
,
and make
corresponding time sequences without running Rosenblatt – Parzen approximation
of sequences
.
Due to relatively large differences between
quantiles of distribution functions at the confidence levels of 0.05, 0.5, 0.95
for time sequences
,
, similar values of time sequences
,
were found.
Comparative analysis of those shows that the maximum deviations between
quintiles of distribution functions of time sequences
,
at confidence levels
of 0.05, 0.5, 0.95 is 2.87%. This confirms stationarity of time sequences
,
.
In addition, the assumption of stationarity
of time sequences
,
,
,
,
,
,
was confirmed
through the use or Kwiatkowski–Phillips–Schmidt–Shin test [10]. To run the test
the authors used the function kpss.m that is included in the MATLAB toolkit
Econometrics
Toolbox
[11].
We tested the hypothesis that the selected
set of indicators can be used for description of combustion process where fuel
is supplied in pulsating mode. This mode is of practical interest because it
helps reduce content of environmentally noxious nitrogen oxides that can be
found in gaseous fuel combustion products [12].
In these experiments we used an upgraded
test unit with a solenoid valve installed in the fuel supply line. The valve
controlled the fuel flow rate by fast (as compared with durations of its
open/closed states) opening and closing at the rate from 0 to 10 Hertz
(pulsating fuel supply mode). The average fuel supply flow rate was maintained
the same as in the continuous fuel supply mode (0.07 g/sec).
Analysis of the obtained IR images demonstrated
that where the valve opening/closing rate was 1 Hz, the gas-air mixture burning
process was unstable, causing the torch to shut down. Due to that, we further
studied only those IR image sequences
where the valve
opening/closing rate was in the range of 2 to 10 Hz. Figure 10 shows an example
of IR imaging record for the pulsating fuel supply mode.
Figure 10. Visualization
of the IR heat imager sequence
for a burning torch where the fuel is
supplied to the burner at the pulsation rate of 2 Hz
Figure 11 shows visualization of IR images
of the burning torch operating in the pulsating mode. This visualization
resides in the relative Celsius degrees space using the color scale «Rainbow»
at the 500th, 502th, 504th и 506th frames of the IR image recording, fragments
of which are shown on Fig. 10.
Figure 11.
Visualization of IR images of the burning torch operating in pulsating mode at
the rate of 2 Hz using the color scale
Rainbow
. Time interval between
adjacent frames is
sec.
Fig. 10 and 11 suggest that the raw data
obtained at IR imaging of the torch operating in pulsating fuel supply mode
does not differ visually from data obrained in continuous fuel supply.
Therefore, following the procedure descibed in section 2 the authors performed
analysis of the raw data – sequences of IR images containing images of burning
torch. Fig. 12 depicts a typical example of surface generated by Rosenblatt –
Parzen approximations of density distributions for sequences
computed for a 0.242
seconds-long interval taken from the image sequence
for pulsating mode
of fuel supply with the pulsating rate of 2 Hz.
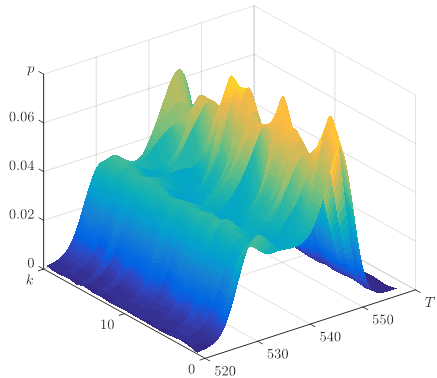
Figure. 12.
Image of the surface generated through approximations of Rosenblatt – Parzen
distribution density for sequences
(time interval between adjacent frames is 0.0121 seconds).
The IR image sequences were obtained when operating the torch in pulsating fuel
supply mode with the pulsation rate of 2 Hz.
As follows from Fig. 12, this surface is
shaped similarly to that generated for the continuous fuel supply option (Fig.
8). This means that for the pulsating fuel supply mode the approximations of
sequences
are bimodal random sequences with a constrained scattering region.
Distribution densities of these sequences are characterized by the pre-selected
set of parameters:
,
,
,
,
,
. This conclusion is also confirmed by the fact that for the
pulsating mode, as well as for the continuous fuel supply mode, it is advisable
to use normal kernel in computations of Rosenblatt – Parzen approximations of
the
distribution density for sequences
. It should be noted
that the analysis of time sequences
,
,
,
,
,
,
, performed following
the procedure described in section 3, confirmed their stationarity. In
addition, the stationarity of time sequences in the range of the control valve
opening/closing rates of 2…10 Hz was confirmed by the running the
Kwiatkowski–Phillips–Schmidt–Shin test.
The results shown here demonstrate that the
suggested quantitative characteristics are universal parameters of the burning
torch regardless of the studied gaseous fuel supply modes. Availability of
these parameters makes it possible to develop an automatic burning process
control system based on IR thermal imagers.
The analysis of IR images of burning torch
with continuous supply of gaseous fuel has demonstrated that the combustion
process is characterized by the following set of qualitative indicators
evaluated through Rosenblatt – Parzen approximations of the pixel distributions
of torch images at the given frame on the relative temperature:
− x-coordinate of the first
maximum,
− x-coordinate of
the second maximum,
− the value of
the minimum,
− y-coordinate of
the first maximum,
− y-coordinate of
the second maximum,
− y-coordinate of
the minimum,
− number of
pixels with values in the range of
relative
,
− number of pixels with values in
the range of
relative
,
− number of
pixels with values in the range of
relative
.
Time sequences
,
,
,
,
,
,
,
, composed from the
values of the selected quantitative indicators of the combustion process, which
were calculated for each frame of the image sequences, are stationary random
sequences.
The finding that
with the relative
error of less than 2.8% is a constant equal to 536.3 relative
opens the
opportunity to reduce the scope of real-time mathematical operations to be
performed by the combustion control system. The time sequences
,
,
can be found without
Rosenblatt – Parzen approximation of distribution of pixels in IR-images of the
torch, which is rather resource-consuming procedure. Instead, this allows to
directly cound the number of pixels that represent temperatures in the ranges
,
of relatives
.
1)
Fristrom R. M. Struktura
plameni / R. M. Fristrom, A. A. Vestenberg. - Moscow : Metallurgiya, 1969. -
364 p. [in Russian]
2)
Primenenie sovremennyh
opticheskih metodov dlya diagnostiki i prostranstvennoj struktury turbulentnyh
plamyon / V. M. Dulin, D. M. Markovich, M. P. Tokarev, L. M. CHikishev //
Avtometriya. - 2012. - V. 48, № 3. - P. 22-32. [in Russian]
3)
Astaria T. Infrared
thermography for thermo-fluid-dynamics / T. Astaria, G. M. Carlomagno. - Berlin
: Springer-Verlag Berlin Heidelberg, 2013. - 226 p.
4)
Strukturnaya diagnostika
fakela v real'nom vremeni kak osnova sozdaniya sovremennyh sistem upravleniya /
P. YU. Hudyakov, I. A. Berg, N. A. Melkozyorov, B. P. ZHilkin // Sbornik
dokladov VIII mezhdunarodnoj nauchno-tekhnicheskoj konferencii studentov,
aspirantov i molodyh uchyonyh "Energiya-2013". - 2013. - 24-25 april.
- P. 191-195. [in Russian]
5)
Primenenie teplovizionnogo metoda dlya
obnaruzheniya ochagov plamennogo goreniya / B. P. Zрilkin, N. S. Zajkov, A. Yu.
Kisel'nikov, P. Yu. Hudyakov, S. G. Alekseev // Fire and Explosion Safety. –
2012. – Vol. 21, № 4. – PP. 38-40. [in Russian]
6)
Berg I. A. Identification of
Pulsating Combustion Modes of Gazeous Fuel / I. A. Berg, S. V. Porshnev, B. P.
Zhilkin //AIP Conference Proceedings 1906. – 2017. – P. 070016.
7)
Syzrancev V. N. Raschet
prochnostnoj nadezhnosti izdelij na osnove metodov neparametricheskoj
statistiki / V. N. Syzrancev, YA. P. Nevelev, S. L. Golofast. - Novosibirsk :
Science, 2008. - 218 p. [in Russian]
8)
Porshnev S. V., Koposov A.
S. Programm library ES&RP. - Federal registration certificate // Federal
registration certificate № 2016614275 (Application № 2016611747 from 2 march of
2016. Issued 20 april of 2016).
9)
Warnatz J. Concentration-,
Pressure-, and Temperature-Dependence of the Flame Velocity in
Hydrogen-Oxygen-Nitrogen Mixtures / J. Warnatz // Combustion Science and
Technology. - 1981. - Vol. 26, Issue 5-6. - P. 203-213.
10)
Testing the null hypothesis
of stationarity against the alternative of a unit root / D. Kwiatkowski, P. C.
B. Phillips, P. Schmidt, Y. Shin // Journal of Econometrics. - 1992. - Vol. 54.
- P. 159-178.
11)
Econometrics Toolbox Product
Description [Electronic resource] / The MathWorks, Inc. // Matlab
documentation. - Mode of access:
https://www.mathworks.com/help/econ/product-description.html (date of accsess:
24.06.2019).
12)
Berg I. A. Pulsating
combustion: Theoretical and empirical substantiation of ecological effect / I.
A. Berg, S. V. Porshnev, V. Y. Oshchepkova // AIP Conference Proceedings 1910.
– 2017. – P. 020010.
RUSCOMNADZOR Reg. Number El. № ФС77-37344 INFORMREGISTR Reg. Number № 0421100125
Copyright http://sv-journal.org