Detection of the background
thermal neutron flux allows for the investigation of long-period [1, 2] and
short-period [3] variations of cosmic rays (CR), CR anisotropy [4, 5] and solar
CR [6, 7], the influence of various meteorological parameters on the neutron
flux [8, 9] (including atmospheric pressure and air humidity [10], soil
moisture and terrain [11, 12]), as well as various geophysical processes (tidal
waves in the Earth's crust, free oscillations of the Earth, etc.).
At the Experimental Complex
NEVOD (National Research Nuclear University MEPhI, Moscow) [13], the studies of
cosmic ray variations are conducted by detecting thermal neutrons using three
scientific facilities: PRISMA-36 [14], URAN [15], and "Neutron" [16].
The schematic diagrams of the
detectors used in these facilities are shown in Fig. 1.
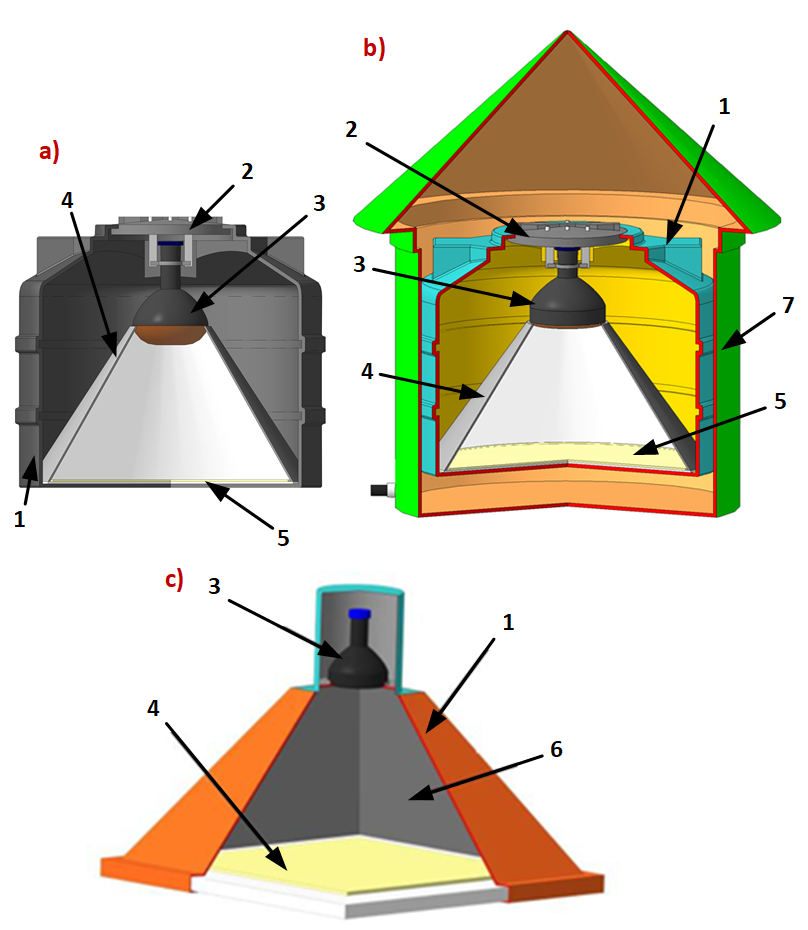
Fig. 1. Detectors of the PRISMA-36
(a), URAN (b), and "Neutron" (c) facilities: 1 – light-isolated
housing; 2 – cover with suspension; 3 – PMT; 4 – scintillator; 5 –
light-reflecting cone; 6 – light-reflecting coating; 7 – outer housing.
The PRISMA-36 facility is
located on the 4th floor of the EC NEVOD and consists of three
independent clusters of 12 detectors each. The distance between detectors is
3.6 m × 5.3 m, and the total area of the facility is about 500 m². A
200-liter black polyethylene cylindrical tank with a height of 570 mm and a
diameter of 740 mm is used as the light-isolated housing for the PRISMA-36
detector. A specialized inorganic scintillator (SL6-5 phosphor) based on
ZnS(Ag) with the addition of ⁶LiF (enrichment degree with the ⁶Li
isotope is 90%) with an area of 0.36 m² is installed at the base of the
detector housing. A PMT EMI 9350KA is used to record light flashes from the
scintillator.
The URAN facility is located on
the roofs of two EC NEVOD buildings and consists of 72 detectors divided into 6
clusters of 12 detectors each. The distance between detectors is about 5 m, and
the total area of the facility is 10³ m². The URAN detectors are
nearly identical in design to those used in the PRISMA-36 facility. The LRB-2
phosphor [17] with the addition of B₂O₃ is used to register thermal
neutrons, and the FEU-200 photomultiplier tube serves as the photodetector.
Since the detectors operate in outdoor conditions, they have an additional
outer metal housing for protection against environmental influences and
mechanical damage.
The "Neutron"
facility includes one cluster of 5 detectors located in the EC NEVOD building
at various heights (from -3 m to 10.5 m) from the ground surface and under
different thicknesses of absorber (from 35 to 350 g/cm²). The detectors
have pyramidal light-isolated housings with dimensions of 1000×1000×700
mm³. The inner surface of housings is painted with a diffuse reflective
coating. A FEU-200 PMT is used as the photodetector. The scintillator is
similar in composition to that used in the PRISMA-36 detectors and has an area
of 0.75 m².
Signal is read out from the
detectors via an integrating circuit with an integration constant of 2.7
μs for PRISMA-36, 20 μs for URAN, and 5 μs for
"Neutron".
All three facilities have
identical data acquisition systems in terms of organization and operating
principle. They include:
- the clusters local posts of
data acquisition and processing for digitizing analog signals from
detectors, selecting signals based on trigger conditions (the signal from any
detector exceeds the amplitude threshold of 10 ADC l.s.b. which corresponds to
16 mV), and assigning timestamps to registered signals with an accuracy of 10
ns;
- the central posts of control,
synchronization, data collection, and processing for receiving, storing,
and primary processing of cluster data, arriving as digitized signal waveforms
with a sampling frequency of 100 MHz and a duration of 20 μs (2048 points
with a step of 10 ns).
Signals from the detectors can
be of two types: from neutrons (neutron signals) and from charged particles or
PMT noise (background signals). Neutron and background signals differ in pulse
shape. Examples of these signals are shown in Fig. 2. Parameters enabling the
separation of these two signal types were defined in [14]: signal duration and
rise time (leading edge duration).
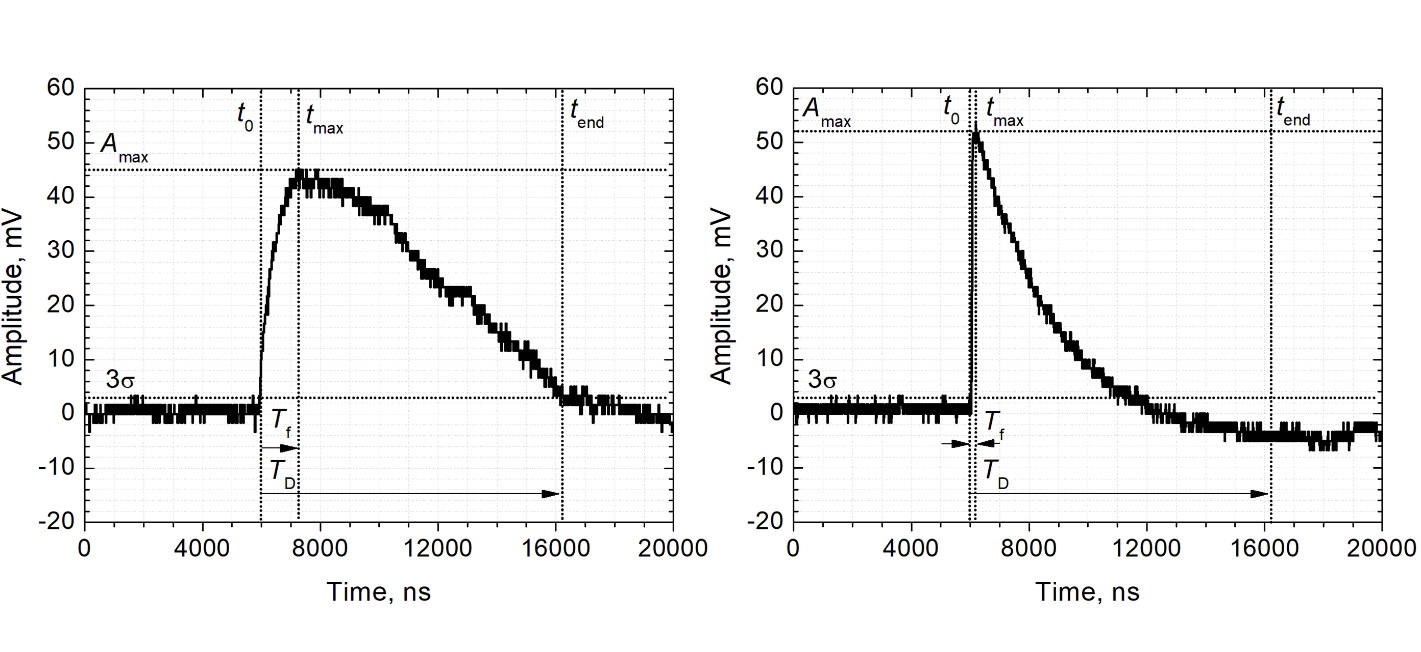
Fig. 2.
Examples of neutron (left) and background (right) signals from detector. Signal
parameters: Amax is the signal amplitude, t0
and tend are the signal start and end times,
TD = tend - t0 is the signal
duration, Tf is the signal rise time.
The main characteristics of
signals from the detectors of the PRISMA-36, URAN, and "Neutron"
facilities are determined in real time processing of their waveforms directly
during the data taking process. These include (Table 1): amplitude, pulse
duration, signal leading edge duration, mean value and r.m.s. deviation of the
ADC baseline, results of signal type identification (neutron or background) taking
into account the specified selection criteria.
Table 1 – Main characteristics
of the detector signals
|
Parameter
|
Description
|
|
time_ns
|
Event registration time according to the internal clock of
the cluster electronics unit in nanoseconds
|
|
amplitude
|
Signal amplitude in ADC l.s.b. (Amax)
|
|
pds_mean
|
Mean value of ADC baseline in ADC l.s.b.
|
|
pds_rms
|
r.m.s. deviation of ADC baseline in ADC l.s.b.
|
|
zero_crossing
|
Signal duration in nanoseconds (TD)
|
|
zc_result
|
Signal identification result based on pulse duration
parameter: 0 – background, 1 – neutron
|
|
rise_time
|
Signal leading edge duration in nanoseconds (Tf)
|
|
rt_result
|
Signal identification result based on pulse leading edge
duration parameter: 0 – background, 1 – neutron
|
Based on these parameters and taking into account the threshold
conditions (amplitude threshold), the selection criteria (for rise_time and zero_crossing)
and the atmospheric pressure corrections, the neutron
and background counting rates, used for detector operability monitoring, are
calculated for each detector of the facilities:
1. Taking into account the threshold conditions and selection
criteria, the average neutron counting rate N(t) is calculated
for each detector of the facility.
2. The obtained counting rate values are corrected for atmospheric
pressure:
|

|
(1)
|
where
 is
the barometric coefficient,
 is
the mean atmospheric pressure,
 is the current atmospheric pressure in mbar. The coefficient
is set constant for each detector, and the mean pressure
P0 is also set manually.
3. Taking into account the average counting rate
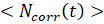 over a specified time interval, the variation
value is calculated:
|

|
(2)
|
A specialized software (SW) has
been developed for data acquisition from the PRISMA-36, URAN, and
"Neutron" facilities, for visualization of time series of thermal
neutron flux variations, as well as for monitoring and analysis of individual
detectors’ operating parameters.
It should be noted that direct
analogues are absent in the open literature, since software for monitoring
specific detector arrays in cosmic-ray physics is traditionally developed for
unique hardware configurations and is not presented in stand-alone publications.
In accelerator physics, as in cosmic-ray physics, the works that are
encountered either address general visualization libraries or astrophysical
catalogs, or else solve problems posed for specific instrumentation [18–20],
but do not address the problem of cluster monitoring of ground-based facilities
with discrete parameters. Therefore, this software may be characterized as
unique within its class of tasks.
The software for studying
cosmic ray variations implements the following set of functions:
• control of the electronics units (EU) of the clusters of the
PRISMA-36, URAN, and "Neutron" facilities;
• reading out of data from the facilities’ EUs, and recording of
information into relational databases (DB) and on the hard disk drives of the
facilities’ control computers;
• visualization, processing, and express analysis of experimental
information from the facilities.
The software was developed in
the Python 3.11 programming language [21] using additional libraries: PyQt5 [22],
PyQtGraph [23] for creating graphical interfaces, psycopg2 [24] for working
with the PostgreSQL relational database management system (DBMS) [25],
MessagePack [26] for writing and reading experimental data, NumPy [27], SciPy [28],
pandas [29] for experimental data processing.
The architecture of the
software for studying cosmic ray variations at the PRISMA-36, URAN, and
"Neutron" facilities includes three components:
• the "Server" for interacting with the electronics units
of the facilities’ clusters;
• the “Online Client" for visualizing recorded experimental
information and monitoring the facility status in real time;
• the "Offline Client" for detailed analysis of
experimental data and facilities’ statuses over a specified time interval.
The software architecture is
shown in Fig. 3.
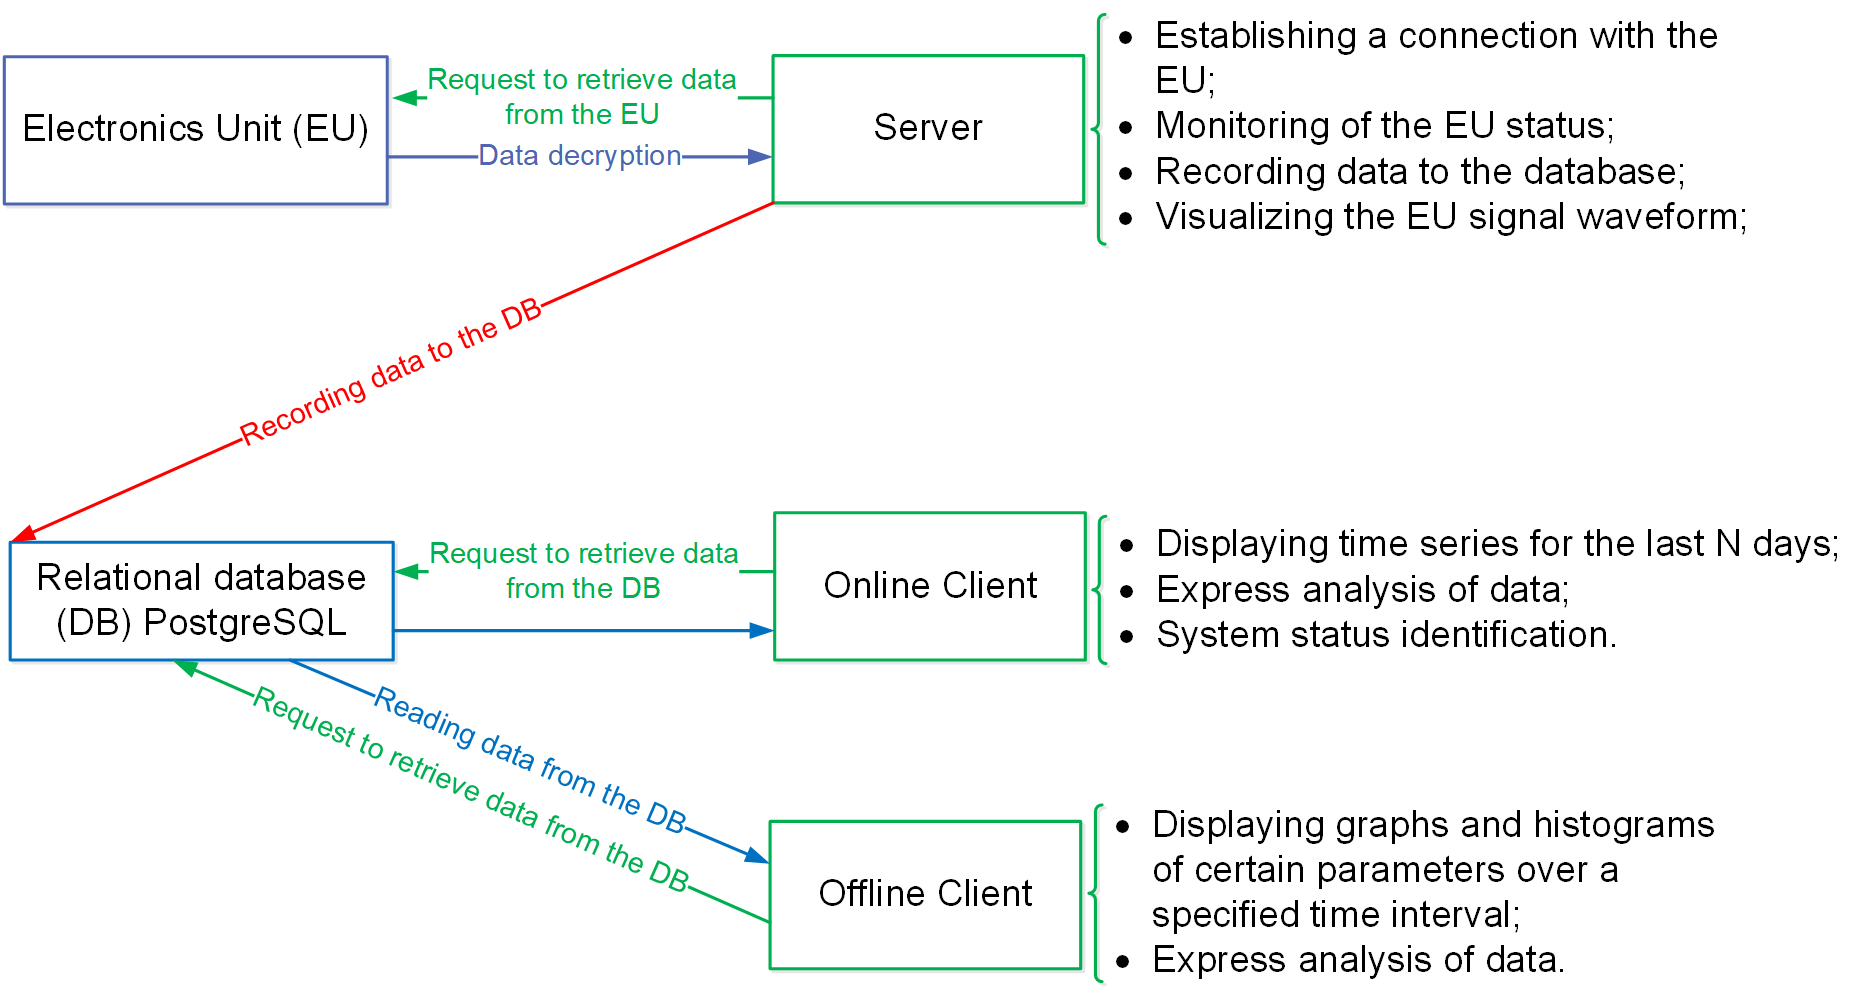
Fig. 3. Diagram of the architecture of
the software for studying cosmic ray variations at the PRISMA-36, URAN, and
"Neutron" facilities.
The "Server" program
runs on the facility’s control computer. It controls and configures the EUs,
performs primary processing of the information received from them, and records
the processing results into the DB. After establishing a connection with the EUs
and starting the measurement process, the program waits for data packets from
the electronics units, caches the received information, processes it, and
writes the processing results to the PostgreSQL relational DB. To monitor
system operation, the "Server" program interface displays waveforms
of registered signals as graphs in real time, and also presents various service
and statistical information about the obtained experimental data and the
measurement process in text form.
The client part of the software
can be run on any personal computer that is part of the EC NEVOD local area
network. It sends queries to read data from the relational DB and performs
their visualization in online or offline modes.
The "Online Client"
of the software implements the following functionality:
• online display of graphs of averaged variation values and neutron
counting rates for all operating detectors of the facility;
• online indication of the statuses of individual detectors of the
facility’s clusters based on detector’s neutron and background counting rates
over the last minute;
• online indication of operational statuses of the individual
clusters and facility as a whole;
• configuration of event selection parameters;
• configuration of alarm thresholds for individual detectors;
• express analysis of data;
• export of data processing results.
The
"Offline Client" is intended for displaying graphs and histograms of
various signal and facility parameters for a specified time interval, express
analysis of data, exporting data processing results. It can also be used to
periodically load the latest data from the DB in the automatic mode.
For
the PRISMA-36, URAN, and "Neutron" facilities, the graphical user interfaces
of the software are identical except for the number of detector and/or cluster
widgets displayed in the windows. The software interface is described below
using the PRISMA-36 facility as an example.
The
software architecture supports horizontal scalability, allowing new detectors
and clusters to be added via a configuration file.
The graphical user interface of
the "Server" program for the PRISMA-36 facility (Fig. 4) is built at
startup dynamically according to the configuration file. The configuration file
contains information about the number of clusters in the facility,
their network and operational settings, DB connection settings, etc.
The interface includes 4 main
elements:
• a control panel with
Connect, Disconnect, Start, Stop
buttons for establishing/terminating network connection to the EUs
of the facility's data acquisition system, and for starting/stopping the
measurement process;
• a panel for displaying information about the number of events
registered by each cluster of the facility (the number of fields depends on the
number of clusters in the facility);
• a panel for displaying service information about program operation
including mandatory tabs
Log (history and results of various operations)
and Status (fill level of internal message queues), as well as several
Status Cl #N tabs (statistical information on the number of events and quality of
data packets for each cluster), the number of which depends on the number of
clusters in the facility;
• a graph display panel including several tabs (the number depends
on the number of clusters in the facility) for event-by-event rendering of
signal waveforms from cluster detectors, which provides the possibility to set
axis limits or auto-scaling, to enable/disable rendering of individual graphs,
and to enable interactive tools for express analysis of graphs: horizontal (red
line) and vertical (orange line) cursors, and a crosshair cursor (green lines).
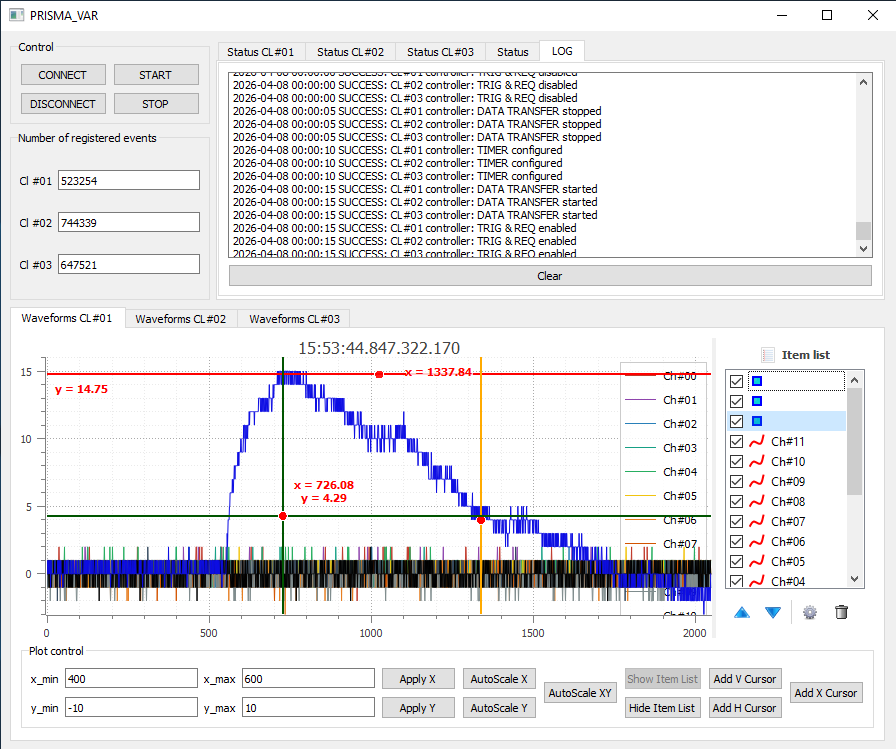
Fig. 4. Graphical interface of the "Server" program for the PRISMA-36.
In the development process, we followed
the classical principles of Gestalt psychology, namely: proximity (grouping of
detectors by clusters), similarity (uniform representation of elements of the
same type), and figure-ground segregation (inactive detectors merge with the
gray background, thereby not diverting attention) [30]. Additionally, the
principle of redundancy is employed—critical information is duplicated in
numerical tooltips.
The interface was developed
iteratively in accordance with the technical specifications provided by the
physicists responsible for the facility, and was repeatedly revised based on
their feedback.
The "Online Client"
interface consists of 3 main blocks (Fig. 5): program control, graph display,
and cluster status display.
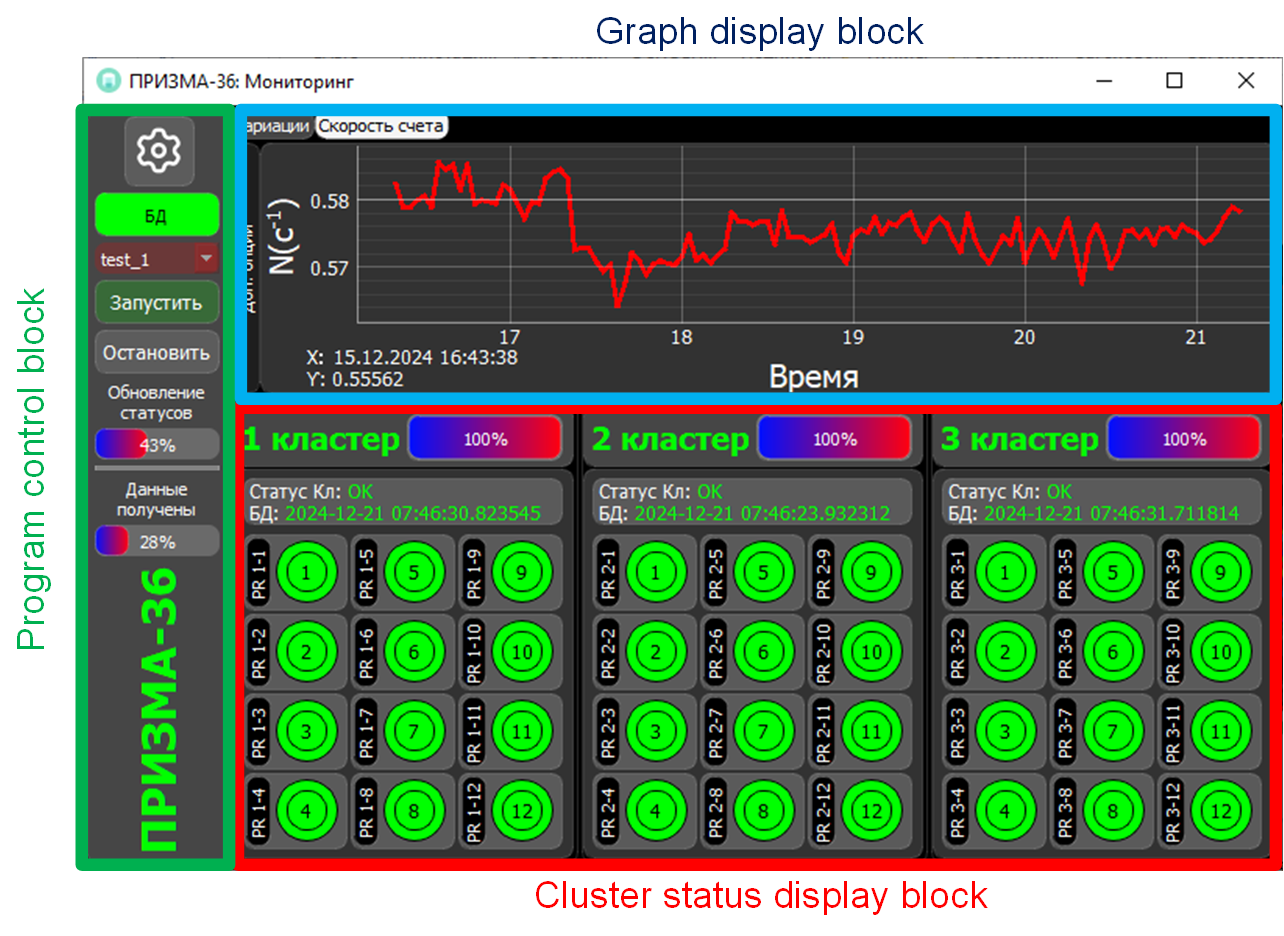
Fig. 5. Graphical user interface of
the “Online Client” for the PRISMA-36.
The
program control block (Fig. 6) contains: a button to call the program
parameters window, a DB connection status indicator, a dropdown list for
selecting the analyzed DB table, buttons to start and stop the program operation
in online mode, an indicator bar to present the progress of the cluster status
information updating, an indicator bar to show the progress of the graph
plotting, and a facility (program) operation indicator.
The
DB connection status indicator has two states: flashing green/white during
normal program operation with an established DB connection; flashing red/white
when the DB connection is lost.
If
the DB connection is established, the list of experimental tables available in
the database is automatically loaded. After selecting the table corresponding
to the current measurement, the monitoring of the PRISMA-36 facility operation
can be started.
The
program parameters window (Fig. 10) allows setting threshold conditions and
selection criteria (see Section 2), which are taken into account when analyzing
experimental data, for each detector of the facility.
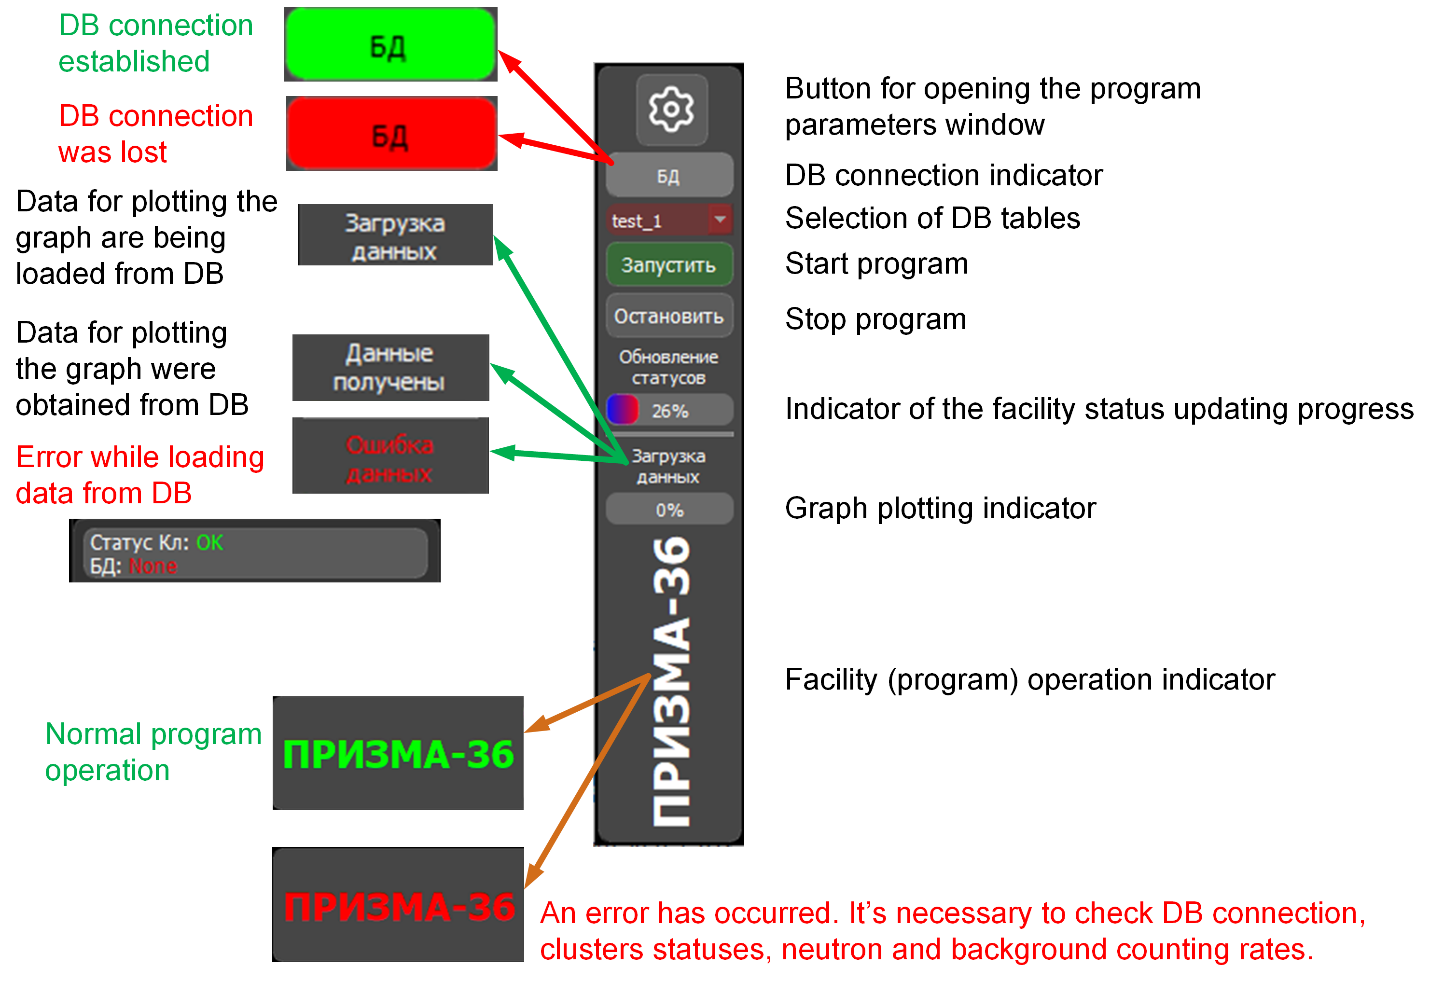
Fig. 6. Program control block of the
“Online Client”.
During monitoring, the data are
periodically (the interval is set in the configuration file) exported from the
DB in automatic mode. After analysis, the graphs and cluster statuses are
updated.
The indicator (bar) of the
facility status updating progress shows the time remaining until the next
update.
The graph plotting indicator
consists of a text field and a bar. The text field can take the following
values: "Loading"/"Загрузка данных", "Data received"/"Данные получены",
"Data error"/"Ошибка данных". The bar shows the time until the next graph update.
The facility (program)
operation indicator has two states: flashing green/white during normal facility
(program) operation; flashing red/white when the DB connection is lost, when
neutron and background counting rate values for individual detectors go beyond
the specified range, or when no new data appears in the DB for more than 5
minutes from the current time.
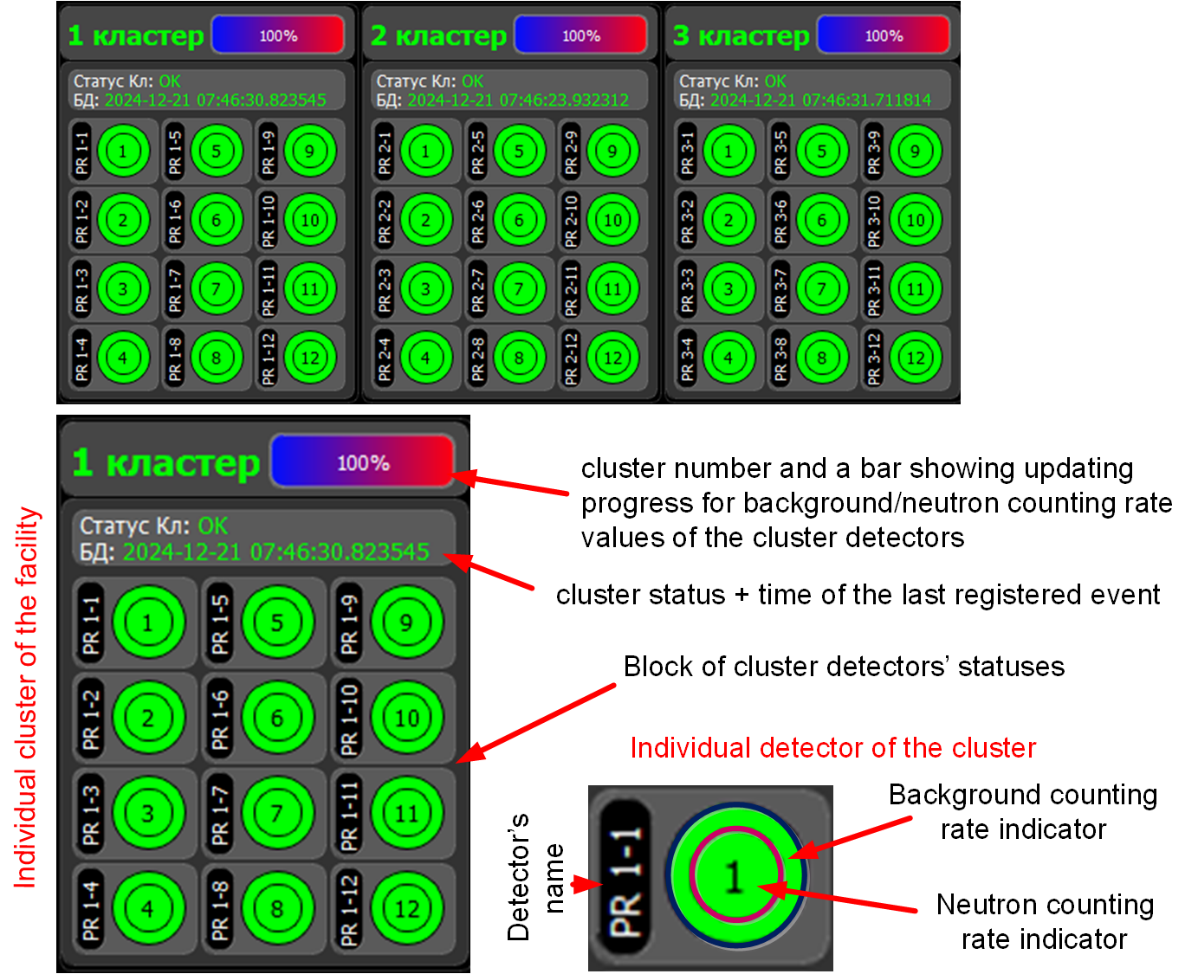
Fig. 7. Cluster status display block
of the “Online Client”.
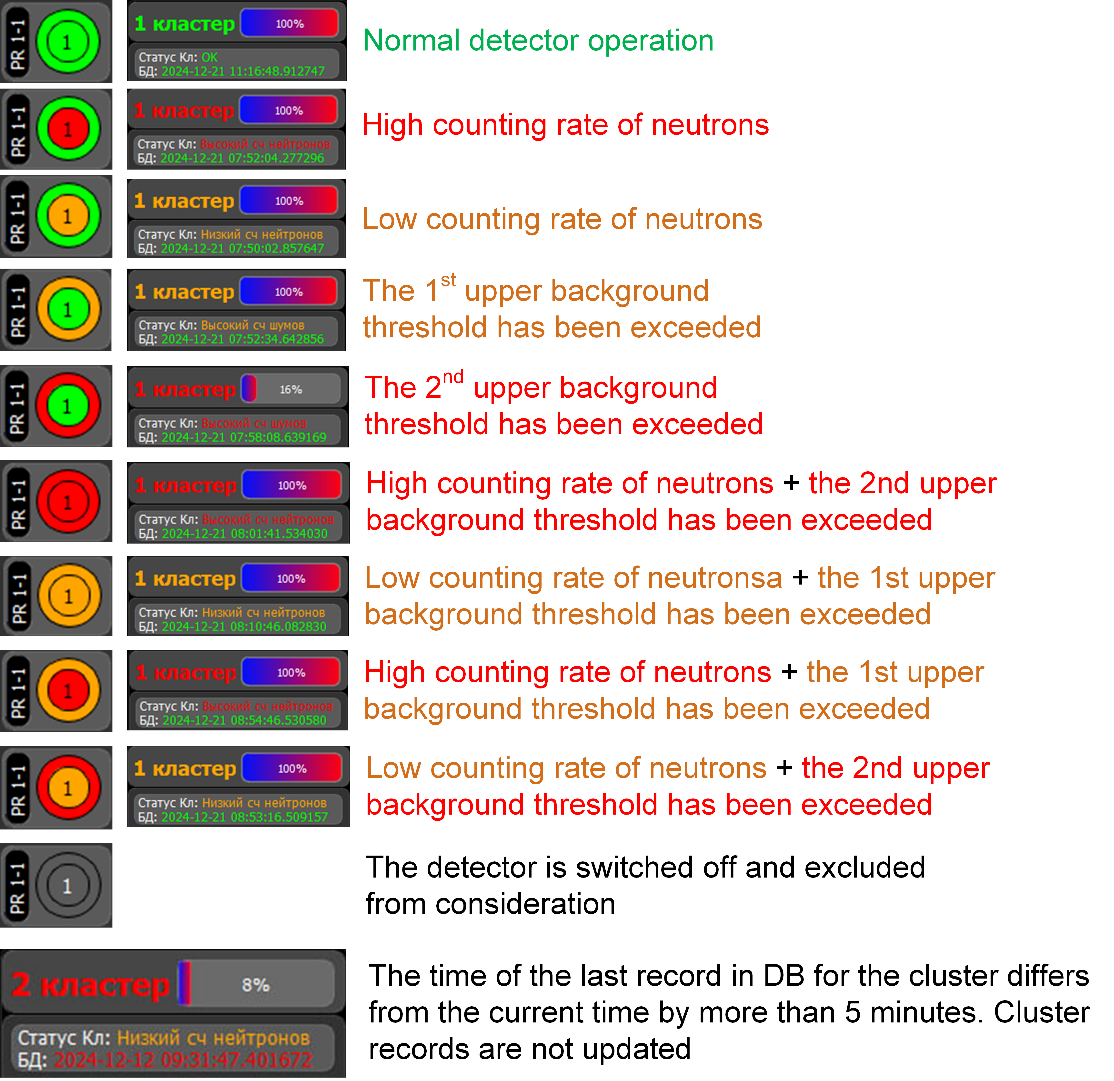
Fig. 8. Indicators of detector and
cluster statuses.
The cluster status display
block (Fig. 7) includes a set of "cluster" widgets (three widgets for
PRISMA-36). Each such widget consists of: a cell with the cluster number and a
bar showing updating progress for background/neutron counting rate values of
the cluster detectors; a cluster status cell indicating the time of the last registered
event; a block of 12 cells symbolically representing the statuses of the
cluster detectors.
The circular form factor was
selected for three reasons: compactness when displaying 36 or more detectors on
a single panel, high-speed state recognition via peripheral vision, and visual
correspondence to the circular geometry of detectors within the clusters.
The detector cell indicates the
detector number (in this case, "PR 1-1" means "first detector of
the first cluster of the PRISMA-36 facility"). A background/neutron
counting rate is presented by outer/inner circle of indicator. Hovering the
mouse pointer over the indicator displays the corresponding background/neutron
counting rate averaged over one minute since the last data update.
The status of each detector is
represented using a traffic
‑
light
color code (green for nominal performance, orange for pre
‑
critical deviations, and red for critical
violations of preset thresholds). This coding convention is widely established
in industrial process monitoring and, being intuitive, obviates the need for
specialized user training.
Possible color options for
detector and cluster indicators are: gray — disabled, green — normal operation,
orange — warning mode, red — alarm mode. Variants of detector indication and
cluster status are shown in Fig. 8. Threshold values for changing indicator
colors are set in the program parameters window (Fig. 10).
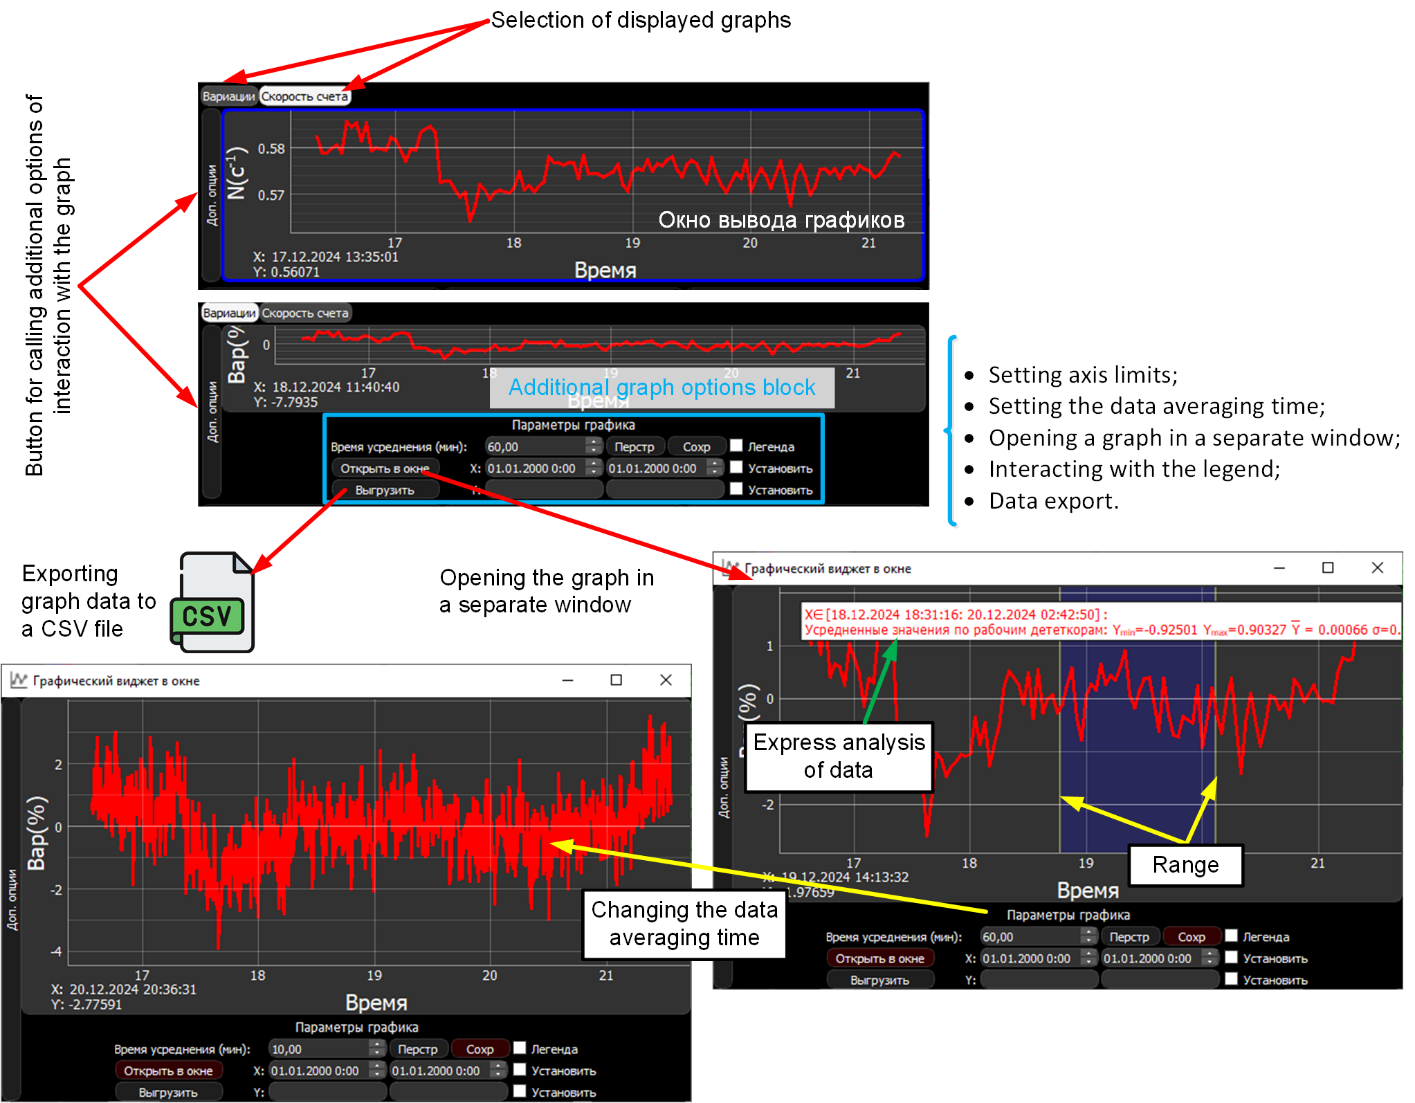
Fig. 9. Graph display block.
The graph display block (Fig.
9) consists of: a graph output window, buttons for selecting the type of
displayed graph, and a button for calling additional functionality.
The graph output window
displays a plot of the neutron counting rate averaged over all operating
detectors of the facility, or a plot of its variations. The plots are rendered
in a linear scale, since the ranges of all monitored quantities are known in
advance and do not exceed one to two orders of magnitude. Logarithmic
representation is not required, as operators are primarily concerned with
absolute deviations from nominal values. The averaging interval is user-definable, enabling the display to be adapted to
the specific task at hand-ranging from
the detection of short-duration bursts to the analysis of long-term
trends. The duration of the displayed time interval is set in the configuration
file. It is possible to interact with the graph output window using mouse
buttons: stretching/compressing the graph along axes, moving across the graph
scene, calling the "range" express-analysis tool (the minimum,
maximum, and average values, as well as the standard deviation of the displayed
quantity are determined for the selected time interval).
Additional functionality of the
graph display block, revealed by clicking the "Advanced
options"/"Доп.опции" button, includes:setting axis limits, setting averaging time, hiding/showing the legend, and
exporting the data presented in the window to a CSV file.
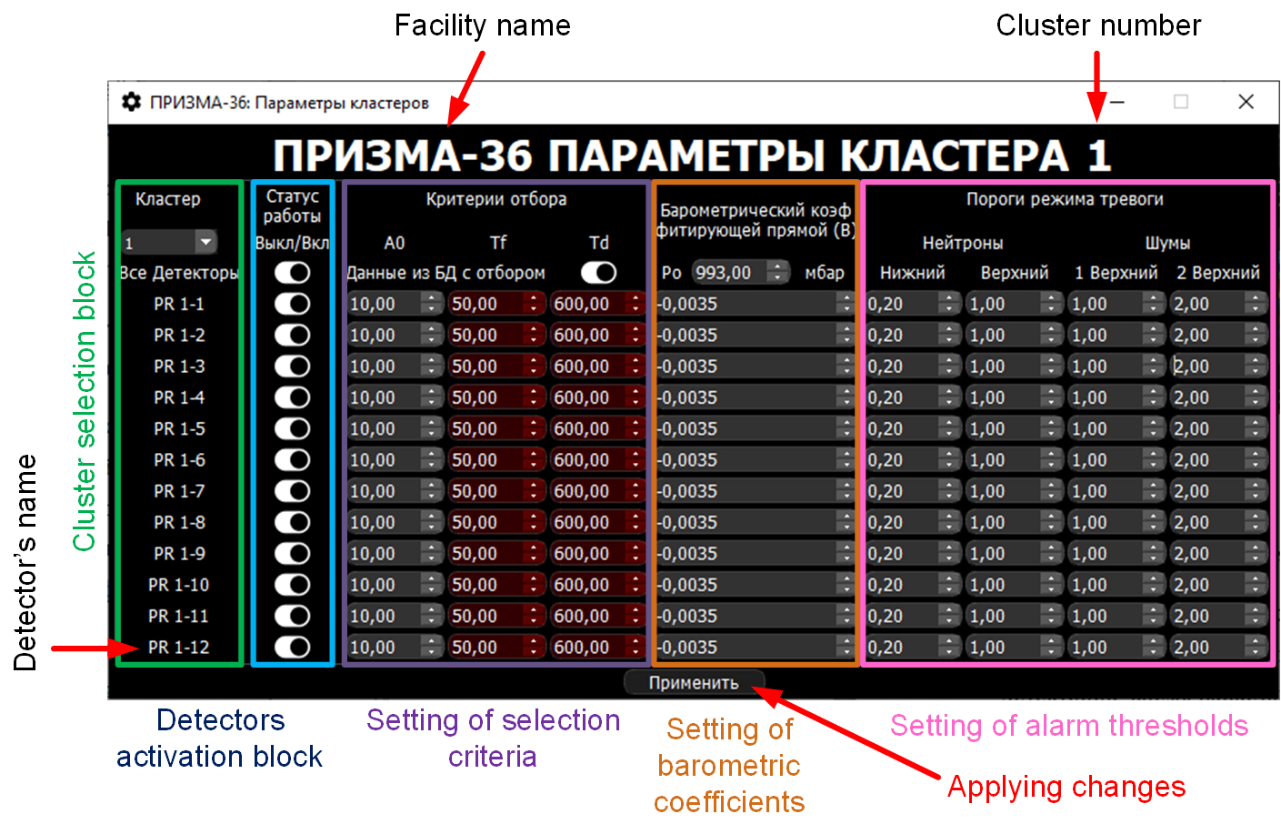
Fig. 10. Program parameters window of
the “Online Client”.
The program parameters window
(Fig. 10) consists of five blocks:
• a cluster selection block, including a dropdown list of facility
clusters and a list of their detectors;
• a cluster detectors block for including/excluding individual
detectors from analysis;
• a block for setting cluster event selection conditions and
criteria for data analysis based on amplitude (A0), duration (Td), and rise
time (Tf) of the signal;
• a block for setting barometric coefficient values for detectors
and the mean atmospheric pressure P₀ for the cluster in mbar, which are
taken into account when plotting graphs;
• a block for setting alarm thresholds, which are taken into account
when coloring the neutron and background counting rate indicators for
individual detectors.
The graphical user interface of
the "Offline Client" program consists of 2 main blocks (Fig. 11): DB
interaction and graph display.
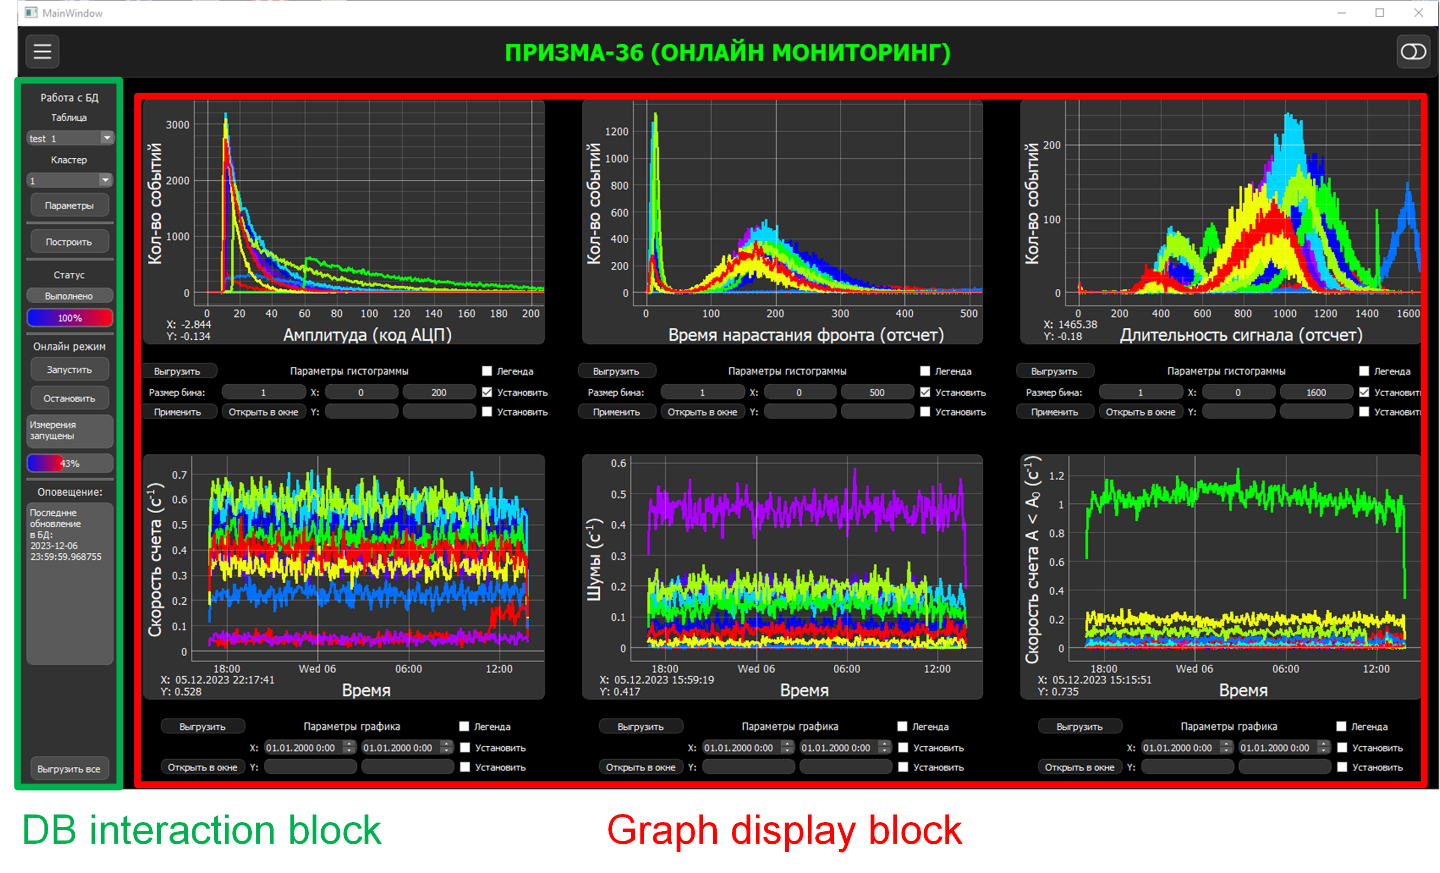
Fig. 11. Graphical user interface of
the “Offline Client” for the PRISMA-36.
The graph display block
contains 6 interactive graphical widgets (Fig. 12): three are used to display
histograms of amplitudes, rise times, and durations of signals from detectors,
and the others are used to display graphs of neutron and background counting
rates, as well as amplitude-limited counting rates for each detector of one
cluster. Interaction with the graphical widgets is similar to interaction with
the “Online Client” graph display window (described above). Additionally,
histogram widgets provides opportunity to change the bin width. Each graphical
widget displays parameter values for 12 detectors of one cluster of the
facility over a specified time interval.
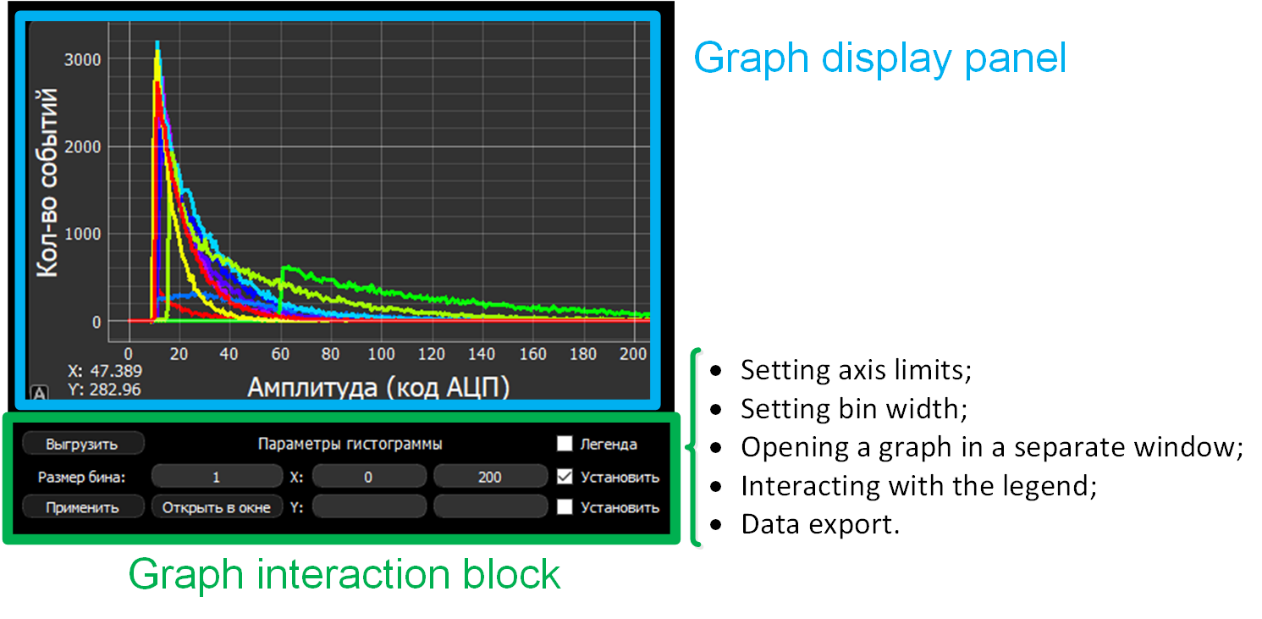
Fig. 12. Graphical widget (for
histograms) in the “Offline Client” for the PRISMA-36.
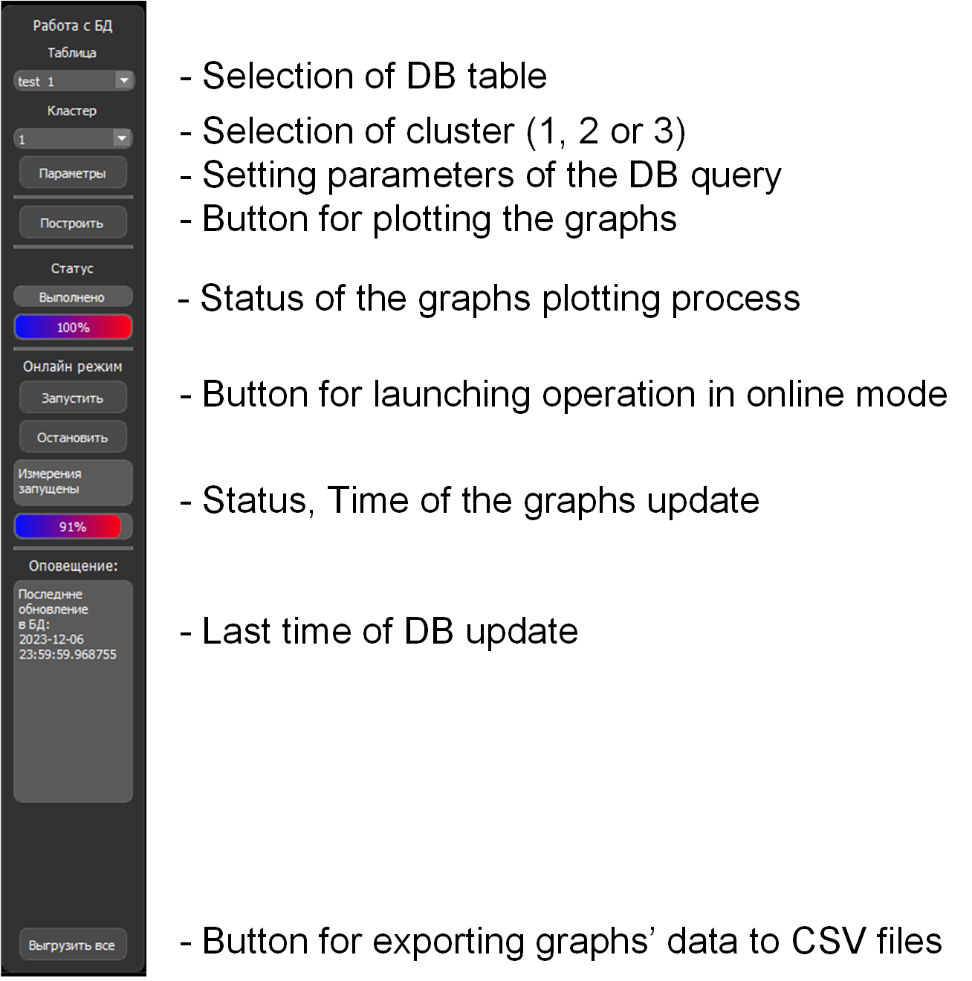
Fig. 13. DB interaction block in the
“Offline Client” for the PRISMA-36.
The DB interaction block (Fig. 13) consists of 9 fields and allows user to:
• select a specific table from the facility DB and the cluster for which the measurement results will be displayed;
• set parameters for the query sent to the DB (Fig. 14);
• plot graphs with taking into account the set parameters;
• start online mode, in which the graphs are automatically updated
at 1-minute intervals (a graph for the last 24 hours from the current time is
displayed);
• obtain information about the time of the last DB update;
• export data processing results to a CSV file.
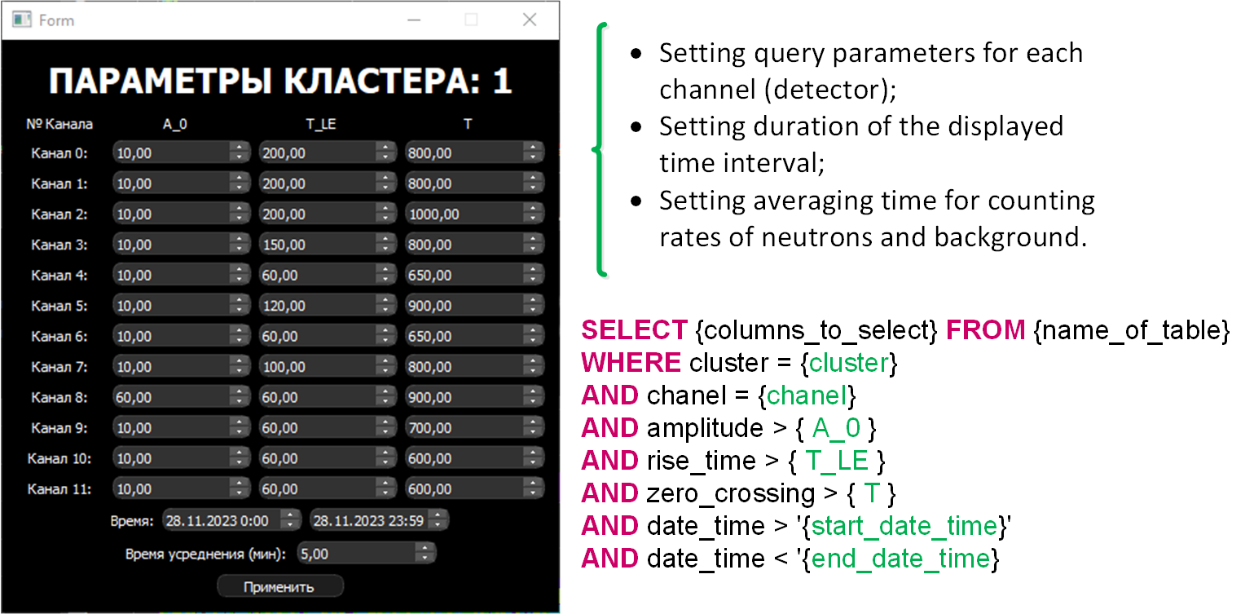
Fig. 14. DB query parameters.
When setting DB query
parameters, the user inputs boundary values for amplitude, rise time, and signal
duration. Based on these values, the query is subsequently formed, and neutron
and background signals are separated.
If an error occurs in the
program, the program title and the "Online mode" label flash red.
Such errors may be caused by a DB server stop, loss of DB connection, or
incorrect input of DB query parameters.
Using the developed software,
the GLE 77 event (a sharp increase in the number of protons in cosmic rays
caused by a class X5.1 solar flare) was observed with the PRISMA-36 and URAN
facilities in real time on November 11, 2025 [31]. The relative increase in
counting rate reached a maximum of 20.1% ± 1.1% at the PRISMA-36 facility and
24.8% ± 1.3% at the URAN facility. The event was compared with observations
from the neutron monitor (NM) network, which recorded an increase in neutron
counting rate of about 20.9% ± 0.5% (for the Moscow NM) and 102.5% ± 0.1% (for
the SOPO NM).
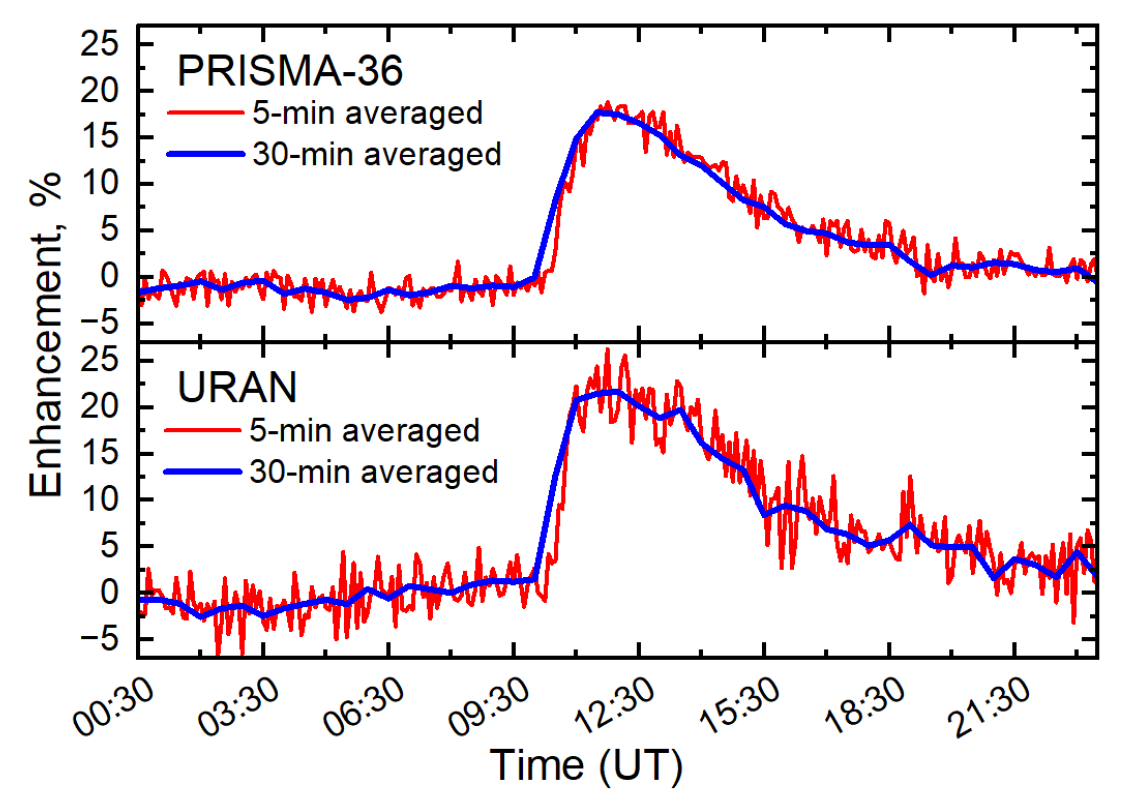
Fig. 15. Time profiles of a neutron
flux enhancement observed by neutron detectors of the PRISMA-36 and URAN
facilities.
A modern experiment in cosmic
ray physics represents a comprehensive research toolkit that, in addition to
complex recording equipment, includes specialized software for visualization
and interpretation of experimental data.
The specialized software for
studying variations in the intensity of the cosmic ray flux using the neutron
facilities PRISMA-36, URAN, and "Neutron" of the Experimental Complex
NEVOD has been developed in the Python programming language. The software
allows observing changes in cosmic ray variations, monitoring the average
neutron counting rate in real time, as well as offline monitoring of the
parameters of individual detectors of the EC NEVOD neutron facilities and
analyzing data from the facilities over a specified time interval in mode.
The approach to real-time
visualization of data from the EC NEVOD neutron facilities enables fast
identification of unique events in cosmic ray physics (powerful solar storms,
Forbush decreases, etc.), and to study various periodic effects during the
analysis of experimental data over long-time intervals in offline mode.
The work was supported by the
Russian Science Foundation, grant No. 22-72-10010-П.
1. E. Paouris, H. Mavromichalaki, A. Belov, R. Gushchina, V. Yanke,
Galactic cosmic ray modulation and the last solar minimum, Sol. Phys. 280
(2012) 255–271.
2. E.W. Cliver, I.G. Richardson, A.G. Ling, Solar drivers of 11-yr
and long-term cosmic ray modulation, Space Sci. Rev. 176 (2013) 3–19.
3. M. Livada, H. Mavromichalaki, Spectral analysis of forbush
decreases using a new yield function, Sol. Phys. 295 (2020) 115.
4. P. Sommers, Cosmic ray anisotropy analysis with a full-sky
observatory, Astropart. Phys. 14 (2001) 271–286.
5. H.S. Ahluwalia, M.M. Fikani, Cosmic ray solar semidiurnal
anisotropy: 2. Heliospheric relationships of anisotropy parameters, J. Geophys.
Res. Space Phys. 101 (A5) (1996) 11087–11093.
6. G.A. Bazilevskaya, E.W. Cliver, G.A. Kovaltsov, A.G. Ling, M.A.
Shea, et al., Solar cycle in the heliosphere and cosmic rays, Space Sci. Rev.
186 (2014) 409–435.
7. L.I. Miroshnichenko, J.A. Perez-Peraza, Astrophysical aspects in
the studies of solar cosmic rays, Int. J. Mod. Phys. 23 (2008) 1–141.
8. M. Tramontini, M. Rosas-Carbajal, C. Nussbaum, D. Gibert, J.
Marteau, Middle-atmosphere dynamics observed with a portable muon detector,
Earth Space Sci. 6 (2019) 1865–1876.
9. P.G. Kobelev, YuB. Hamraev, V.G. Yanke, Analysis of meteorological
effects of cosmic ray neutron component based on data from midlatitude
stations, Solar- Terrestrial Phys. 10 (2024) 99–105.
10. V.L. Yanchukovsky, M.A. Kalyuzhnaya, R.Z. Khisamov, Intensity of
the neutron component of cosmic rays and air humidity, Solar-Terrestrial Phys.
10 (2024) 34–39.
11. J. Jakobi, J.A. Huisman, M. K¨ohli, D. Rasche, H. Vereecken,
H.R. Bogena, The footprint characteristics of cosmic ray thermal neutrons,
Geophys. Res. Lett. 48 (2021) e2021GL094281.
12. M. K¨ohli, J. Weimar, M. Schr¨on, R. Baatz, U. Schmidt,
Soil moisture and air humidity dependence of the above-ground cosmic-ray
neutron intensity, Front. Water 2 (2021) 544847.
13. I.I. Yashin, M.B. Amelchakov, I.I. Astapov, N.S. Barbashina, A.G.
Bogdanov, F.A. Bogdanov, V.V. Borog, A. Chiavassa, A.N. Dmitrieva, D.M.
Gromushkin, S.S. Khokhlov, V.V. Kindin, R.P. Kokoulin, K.G. Kompaniets, A.Yu.
Konovalova, A.A. Kovylyaeva, G. Mannocchi, Yu.N. Mishutina, V.V. Ovchinnikov,
A.A. Petrukhin, I.A. Shulzhenko, V.V. Shutenko, Yu.V. Stenkin, G. Trinchero,
V.S. Vorobiev, K.O. Yurin, E.A. Yurina and E.A. Zadeba. NEVOD — An experimental
complex for multi-component investigations of cosmic rays and their
interactions in the energy range 1–10^10 GeV. Journal of Instrumentation
(2021). 16 (8), T08014.
14. M.B. Amelchakov, A. Chiavassa, A.N. Dmitrieva, D.M. Gromushkin,
S.S. Khokhlov, E.P. Khomchuk, V.V. Kindin, A. Yu Konovalova, P.S. Kuzmenkova,
E.S. Morgunov, N.A. Pasyuk, A.A. Petrukhin, I.A. Shulzhenko, E.P. Volkov, I.I.
Yashin. The PRISMA-36 array for studying variations of the thermal neutron
flux. Nuclear Instruments and Methods in Physics Research A 1076 (2025) 170547.
15. Gromushkin D.M., Bogdanov F.A., Khokhlov S.S., Kokoulin R.P.,
Kompaniets K.G., Petrukhin A.A., Shulzhenko I.A., Stenkin Y.V., Yashin I.I.,
Yurin K.O. The array of scintillation detectors with natural boron for EAS
neutrons investigations. Journal of Instrumentation. 2017. Vol. 12. № 7.
C07029.
16. Experimental Complex NEVOD: monograph / Ed. by A.A. Petrukhin,
S.S. Khokhlov. M.: NRNU MEPhI, 2022. 260 p.
17. Description of LRB-2 phosphor (access date 24.02.2026): https://himbaz.ru/shop/lyuminofory/lrb-2/
18. Mánek, P., Burian, P., David-Bosne, E., Smolyanskiy, P.,
& Bergmann, B. (2024). Track Lab: extensible data acquisition software for
fast pixel detectors, online analysis and automation. Journal of
Instrumentation, *19*(01), C01008.
19. Allakhverdyan, V. A., Avrorin, A. D., Avrorin, A. V., Aynutdinov,
V. M., Bardačová, Z., Belolaptikov, I. A., ... & Zvezdov, D. Y.
(2025). Real-time follow-up of multimessenger alerts at the Baikal-GVD
telescope. Journal of Physics: Conference Series, *2984*(1), 012023
20. Niaei, M. S., & Yeşilyaprak, C. (2020). COSMILOG: A
Cosmic Ray Logger. In Astronomical Data Analysis Software and Systems XXIX
(Vol. 527, p. 623). Astronomical Society of the Pacific Conference Series.
21. Python programming language documentation (access date 24.02.2026): https://docs.python.org/3.11/
22. PyQt5 documentation (access date 24.02.2026): http://pyqt.sourceforge.net/Docs/PyQt5/
23. PyQtGraph documentation (access date 24.02.2026): https://www.pyqtgraph.org/
24. Psycopg2 documentation (access date 24.02.2026): http://initd.org/psycopg/docs/
25. PostgreSQL DBMS documentation (access date 24.02.2026): https://www.postgresql.org/docs/
26. MessagePack documentation (access date 24.02.2026): https://msgpack.org/index.html
27. NumPy documentation (access date 24.02.2026): https://numpy.org/doc/stable/
28. SciPy documentation (access date 24.02.2026): https://docs.scipy.org/doc/scipy/
29. Pandas documentation (access date 24.02.2026): https://pandas.pydata.org/docs/
30. Wagemans,
J., Elder, J. H., Kubovy, M., Palmer, S. E., Peterson, M. A., Singh, M., &von der Heydt, R. (2012). A century of Gestalt psychology in visual perception:I. Perceptual grouping and figure–ground organization. Psychological Bulletin,
*138*(6), 1172–1217.
31. E. Volkov,
K. Chelidze, D. Gromushkin, S. Khokhlov, E. Khomchuk, A. Petrukhin, I.
Shulzhenko. The Observation of Ground-level Enhancement GLE 77 by the Neutron
Detectors of the Experimental Complex NEVOD. The Astrophysical Journal. 998:336
(3pp), 2026 February 20.