With the
continuous improvement of modern living standards, interior environment design
[1-2] has become an important part of people's pursuit of high-quality life. As
an important part of interior design, soft furnishing design [3-4], with its
color [5-6] and material matching, directly affects the visual effect and
emotional experience of the overall space. Traditional soft furnishing design
[7-8] mainly relies on the designer's rich experience and subjective
aesthetics, and there are strong individual differences and uncertainties,
resulting in the lack of unified quantitative standards and replicability in
the design results in terms of color [9-10] and material matching. The rapid
development of computer vision [11-12] and deep learning technology has provided
new ideas and technical means for quantitative color and material matching.
This paper uses GMM to perform probabilistic modeling on the extracted color
information, accurately distinguishes the primary color from the secondary
color, and constructs a dedicated color database for different space types.
This study introduces the PSO algorithm into the multi-objective optimization
process, comprehensively considering the color harmony index, material
compatibility, and user preference. It achieves the transformation and
optimization of the design scheme from perceptual to rational by constructing
multi-dimensional evaluation indicators including ΔE (the degree of
difference between the extracted color and the original image color in the
CIELAB color space), SSIM (Structural Similarity Index Measure), CHI, ECS, and
MCI. By building a virtual scene on the Unity platform and integrating advanced
rendering technologies such as global illumination and physical rendering, the
study not only verified the actual effect of the optimization algorithm in a
virtual environment, but also provided an intuitive and interactive evaluation
tool for future designers. This study has achieved breakthroughs in algorithm
innovation, data-driven design, and realistic rendering, bringing new
theoretical perspectives and practical tools to the field of soft furnishing
design.
With the rapid
development of computer vision and deep learning technology, image processing
[13-14] is increasingly widely used in the field of interior design. A large
number of studies have focused on using convolutional neural networks [15-16]
and their variants to automatically analyze the color, material, and spatial
layout of indoor scenes. Researchers have achieved accurate capture of the main
color tone [17-18] and secondary colors of indoor scenes through deep feature
extraction methods, and quantified color matching and differences using CIELAB
color space [19-20] conversion calculations. In order to solve the problems of
strong subjective judgment of designers and lack of unified quantitative
standards in traditional soft furnishing design, Gaussian mixture model [21]
and cluster analysis technology [22] were introduced to statistically model the
color information extracted from the image and build a color database, which
initially realized data-driven design assistance. Regarding material feature
extraction [23-24], related studies not only focus on physical properties such
as texture, glossiness and roughness, but also use structural similarity index
to evaluate the similarity between material textures, providing quantitative
support for material matching. Existing work has made significant progress in
image feature extraction [25-26], color space modeling and material recognition.
However, there are still many shortcomings in how to integrate these technical
systems to achieve comprehensive soft decoration design optimization. This
provides a theoretical basis and improvement direction for this study in the
construction of an automated soft decoration design system.
In terms of
optimization design methods and multi-objective decision-making, researchers
have also conducted a lot of explorations to make up for the shortcomings of
strong subjectivity and low efficiency in traditional design. Research based on
intelligent optimization algorithms such as genetic algorithms [27-28] and
particle swarm optimization [29-30] provides an effective way to solve the
problem of balancing multiple objectives in design. Many scholars have proposed
multi-dimensional evaluation indicators, such as using the color wheel theory
[31] to construct a color harmony index, using semantic segmentation and the
Pantone color psychology database to construct emotional color similarity, and
combining gloss difference with SSIM to construct a material conflict index.
These methods have laid a theoretical foundation for the quantitative
evaluation of automatic design solutions. At the same time, with the
development of virtual reality [32-33] and rendering technology, building
highly realistic virtual scenes using platforms such as Unity [34-35] has
become a research hotspot. By integrating technologies such as global
illumination and physical rendering, it not only intuitively demonstrates the
optimization design effect, but also further verifies the practical
applicability of the algorithm. Although existing work has achieved remarkable
results in data collection, feature extraction and optimization algorithms,
there are still shortcomings in the full-process integration of soft decoration
design, expansion of data set scale and response to user personalized needs.
These issues provide a direction for further innovation in this study, that is,
on the basis of inheriting and improving the previous work, a more complete
soft decoration design optimization system is constructed by combining ConvNeXt
deep network, Gaussian mixture model and PSO multi-objective optimization
algorithm. This can realize the transformation of design schemes from
perceptual experience to quantitative analysis, and verify the realistic
rendering in virtual scenes, promoting the intelligent development of soft
decoration design theory and practice.
Researchers have
also conducted extensive exploration in optimizing design methods and
multi-objective decision-making to compensate for the shortcomings of
traditional design, such as strong subjectivity and low efficiency. The
generation and evaluation of soft decoration design schemes essentially
constitute a complex multi-objective optimization problem, with non-linear or
even conflicting relationships between its objectives (such as color harmony,
emotional expression, material compatibility). The research based on
metaheuristic algorithms such as genetic algorithm and particle swarm
optimization provides an effective approach to solving multi-objective
balancing problems in design. This type of method does not rely on gradient
information of the problem, and is particularly suitable for global exploration
in non convex, multi-modal high-dimensional solution spaces, which can
effectively approximate the Pareto optimal solution set and provide designers
with a series of solutions that achieve different trade-offs between multiple
criteria. Many scholars have proposed multidimensional evaluation indicators,
which have laid a theoretical foundation for the quantitative evaluation of
automated design schemes.
The data source of
this study is mainly based on public soft furnishing design data, and a total
of 167 design images from the Houzz platform were selected. As an
internationally renowned interior design and decoration communication platform,
Houzz covers a wide variety of design cases and styles, providing
representative and diverse image resources for this study.
Although the
dataset used in the current research is relatively limited in scale, it covers
various types of indoor spaces and typical soft decoration objects, with good
representativeness and structural diversity, which can effectively support the
validation of core tasks such as color and material feature extraction,
probability modeling, and multi-objective optimization. By using a pre trained
ConvNeXt model combined with transfer learning strategy, high feature
expression ability and optimization performance were achieved even with limited
samples, indicating that the current data scale is sufficient for verifying the
feasibility and effectiveness of the method.
The acquired
design object information is shown in Table 1.
Table 1. Acquired design object information
|
Space type
|
Design object
|
Number of images
|
|
Living room
|
Sofa
|
20
|
|
Coffee table
|
23
|
|
TV cabinet
|
18
|
|
Bedroom
|
Bed
|
24
|
|
Lamp
|
15
|
|
Kitchen
|
Dining table and
chairs
|
15
|
|
Tableware
|
13
|
|
Bathroom
|
Mirror
|
18
|
|
Shower curtain
|
21
|
The living room
design objects mainly include sofas, coffee tables and TV cabinets, of which
20, 23 and 18 images were collected respectively; the bedroom part mainly
includes beds and lamps, with a total of 24 bed images and 15 lamp images
collected; the kitchen design covers dining tables and chairs and tableware,
with 15 and 13 images obtained respectively. The bathroom focuses on mirrors
and shower curtains, collecting 18 and 21 images respectively. Through the
quantitative statistics and spatial distribution analysis of various design
objects, the characteristics and style differences of various space types in
soft decoration design can be more carefully reflected, providing detailed data
support and basis for subsequent feature extraction, color and material
matching, and multi-objective optimization.
The obtained image
display is shown in Figure 1.
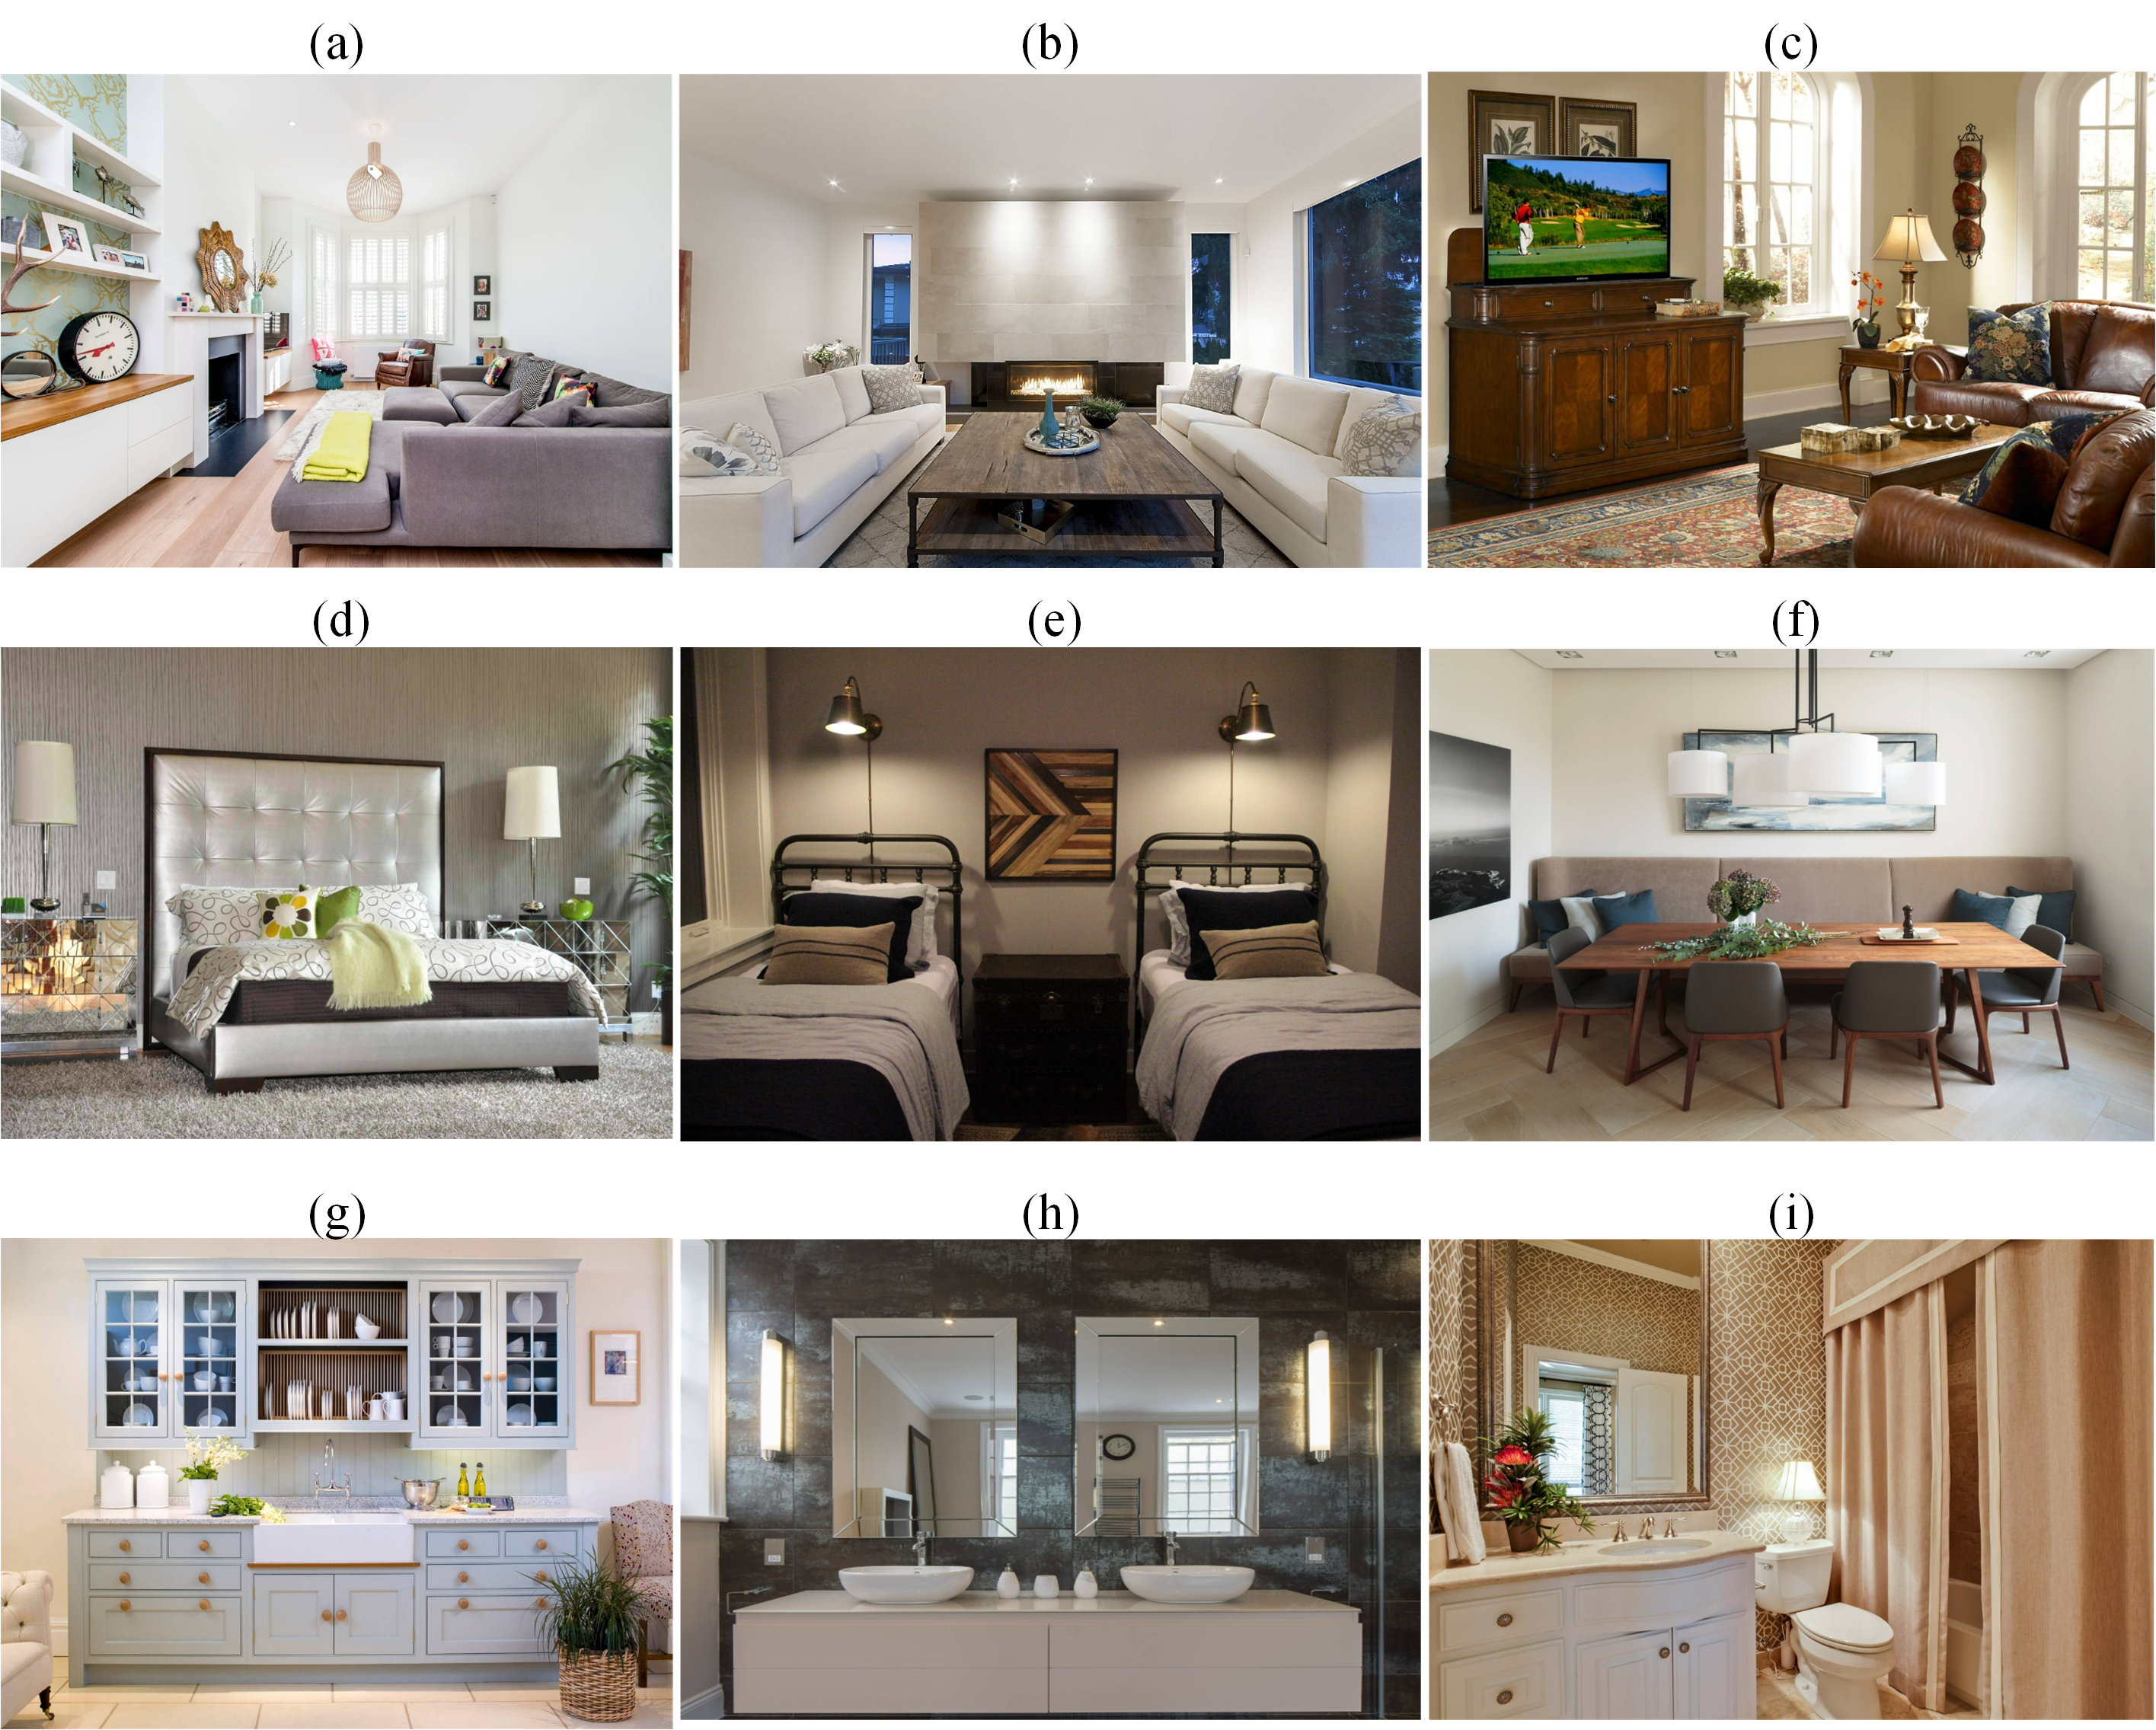
Figure 1. Display of acquired images. a) Sofa; b) Coffee table; c) TV cabinet;
d) Bed; e) Lamp; f) Dining table and chair; g) Tableware; h) Mirror; i) Shower
curtain
The acquired
images have been strictly screened and sorted to ensure the authenticity and
practicality of the data. In order to facilitate subsequent feature extraction
and model training, the image data is classified according to the space type,
including four categories: living room, bedroom, kitchen and bathroom. Such
classification helps to reveal the differences in color, material and layout of
different spaces, and also provides more detailed scene description and data
support for the optimization algorithm.
The acquired image
data is preprocessed, including image size normalization, color space
conversion and denoising, so as to reduce the impact of environmental factors
on color and material feature extraction and improve the robustness of the
analysis. Image size normalization ensures that all input images meet the
neural network model input requirements. Since images from different sources
have different resolutions and scales, direct input may cause the neural
network to be unable to process efficiently.
All input images
are uniformly resized to a fixed size of 512×512 to improve computational
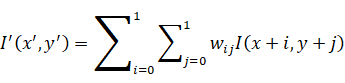
efficiency while preserving details. The bilinear interpolation method is used
for scaling, and the formula is:
|
|
(1)
|
In formula 1,
 is the
target image pixel value, and
 is the
interpolation weight, which is calculated from neighboring pixels.
Color space
conversion is to reduce the impact of illumination changes on color analysis.
This study uses the CIELAB color space, which is designed based on human eye
perception, where the L channel represents brightness, and the a and b*
channels represent color information, which helps to process brightness and
color information independently.
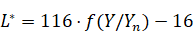
The formula for
conversion to CIELAB is:
In formula 2-4,
 ,
 ,
and
 are the reference white points of the D65 standard light source.
 is the nonlinear transformation function:
|

|
(5)
|
This study uses
Gaussian filtering to smooth the image and reduce high-frequency noise.
Gaussian filtering is a smoothing method based on normal distribution. The
calculation method of its two-dimensional convolution kernel is as follows:
|

|
(6)
|
In formula 6,
 controls
the standard deviation of the filter and determines the degree of smoothing.
The convolution calculation of this filter on the image can be expressed as:
|

|
(7)
|
Through Gaussian
filtering, random noise in the image is effectively removed, while the basic
structure of edge features is maintained to ensure the accuracy of subsequent
feature extraction. This study uses three steps: image size normalization,
color space conversion, and denoising to make the input image more consistent
and stable in the process of structural, color, and material feature
extraction, thus providing a high-quality data foundation for subsequent color
harmony index calculation, material compatibility analysis, and deep learning
model training.
In soft furnishing
design analysis, color distribution features are crucial for the evaluation of
spatial aesthetics. This study uses the ConvNeXt pre-trained model and its deep
convolutional feature extraction capabilities to accurately model the color
information in the image. The ConvNeXt network architecture design is inspired
by Transformer and combines standard convolution with a more powerful
normalization strategy to improve feature extraction capabilities.
The ConvNeXt model
structure is shown in Figure 2.
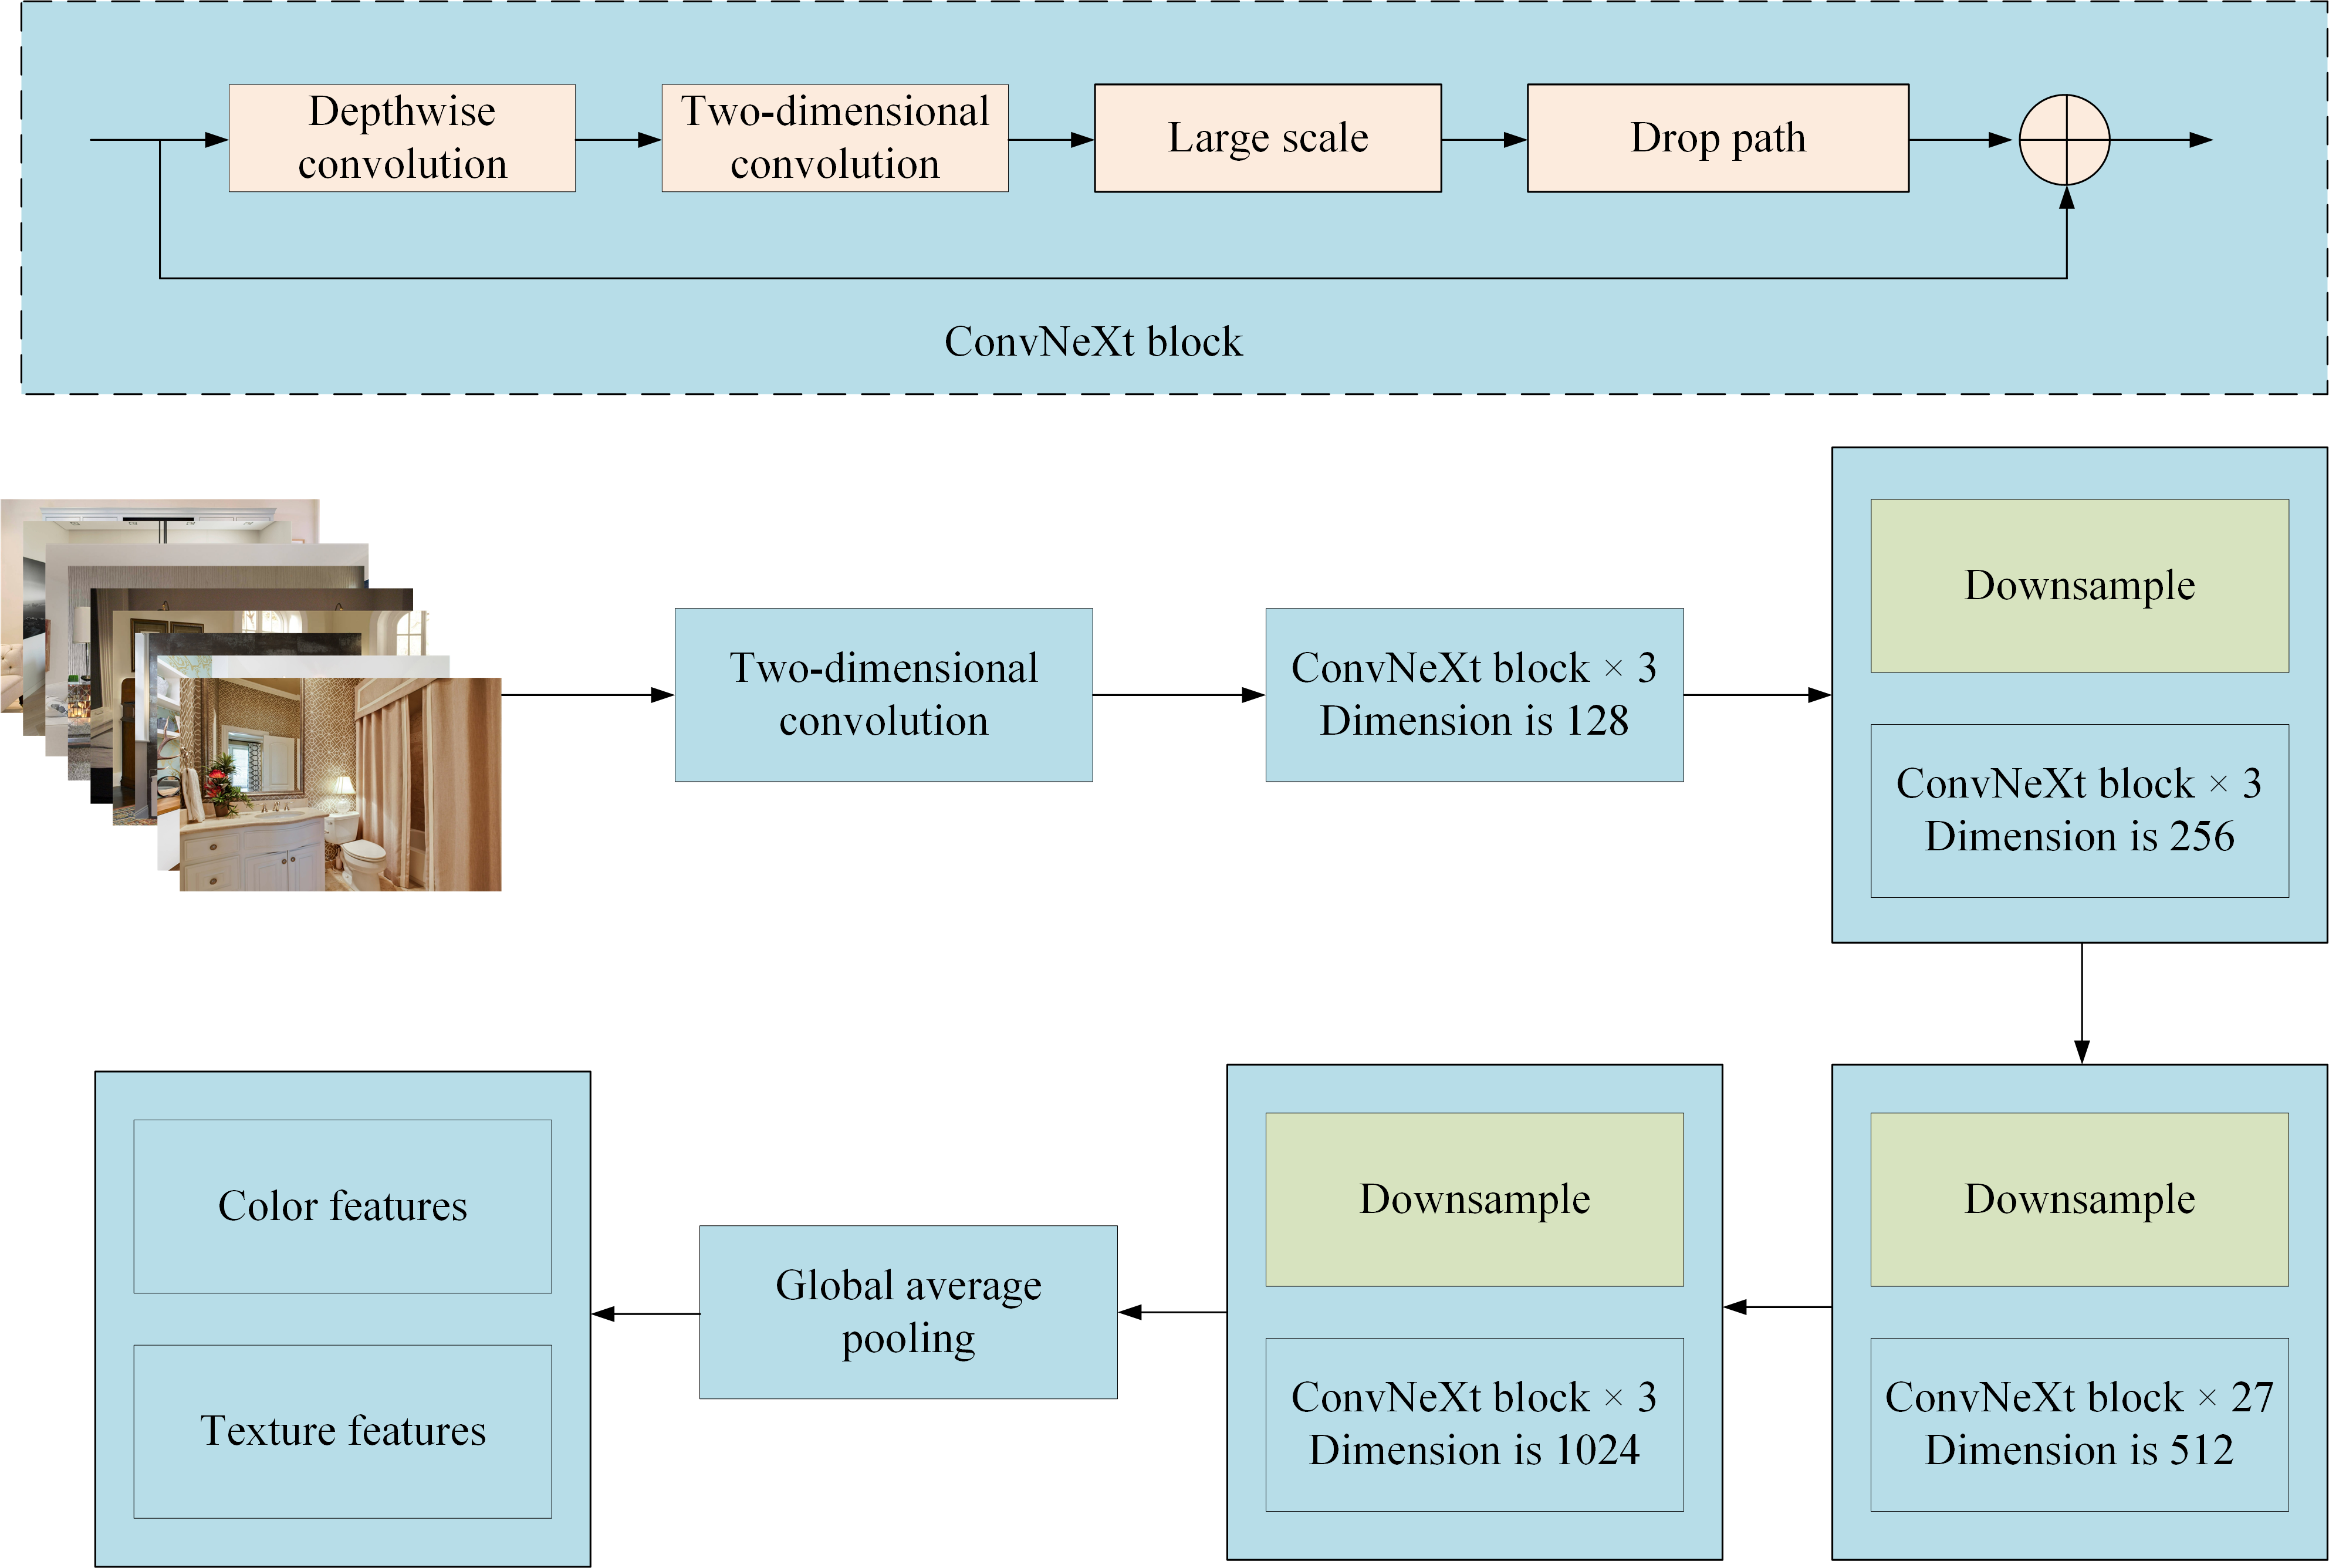
Figure 2. ConvNeXt model structure
The ConvNeXt block
uses Depthwise convolution for feature extraction, forms the initial feature
map through two-dimensional convolution, and uses the Drop path mechanism to
enhance training stability. This paper gradually extracts features through
multiple layers of ConvNeXt blocks.
The first stage
consists of 3 ConvNeXt blocks (feature dimension 128). The second stage uses 3
ConvNeXt blocks (feature dimension 256) to further extract high-level color
features. The third stage uses 27 ConvNeXt blocks (feature dimension 512) for
deep learning. In the fourth stage, three ConvNeXt blocks (feature dimension
1024) are used to maximize the model's ability to express complex material
characteristics, and global average pooling is combined to calculate global
color and texture features.
ConvNeXt-Large is
used as the backbone network to focus on high-dimensional feature mapping.
After ConvNeXt processing, the obtained feature mapping is expressed as:
|

|
(8)
|
In Formula 8,
 and
 are
the spatial dimensions of the feature map, and c is the number of channels. The
feature map covers the local color information of each region in the image and
enhances the ability to capture color patterns through the self-attention
mechanism.
In order to
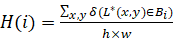
further quantify the color distribution characteristics, this study converts
the feature map extracted by ConvNeXt into the CIELAB color space. The color
distribution of each image region is statistically analyzed, and the pixel
ratio in each interval is calculated:
|
|
(9)
|
In formula 9,
 is the
normalized histogram value of the i-th color interval, and
 is the
pixel set of the interval.
ConvNeXt extracts
rich local texture patterns through multi-scale convolution kernels. It is
difficult to capture texture structures with strong periodicity and
directionality using convolution features alone. This study further combines
Gabor filters to calculate frequency responses in different directions. The
formula for Gabor filtering is:
|

|
(10)
|
In formula 10,
 is the
wavelength, which determines the texture frequency.
 is the
filter direction angle, which controls the extracted texture direction.
controls
the scale of the Gaussian envelope.
 is the
spatial aspect ratio, which is used to adjust the filter shape.
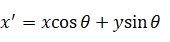
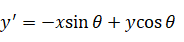
The formula for
rotating coordinates
 and
 is:
|
|
(11)
|
|
|
(12)
|
Through Gabor
filtering at different angles, direction-sensitive texture features are
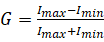
obtained. The Retinex algorithm is used to extract brightness information and
calculate glossiness. The formula is:
|
|
(13)
|
In formula 13,
 and
 represent
the brightness of the highlight area and the shadow area respectively.
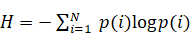
Texture entropy is
used to measure the complexity of the material surface, and the formula is:
|
|
(14)
|
In formula 14,
 is the
probability distribution of Gabor texture features. The larger the entropy
value, the more complex the material.
In the process of
color feature modeling, GMM is used to fit the color histogram of each image to
estimate the probability distribution of the color in the image. Assuming that
the color distribution of the image conforms to the mixture model of K Gaussian
components, its probability density function is expressed as:
|

|
(15)
|
In formula 15,
 is the
weight of the i-th Gaussian component.
 is the
i-th Gaussian distribution, and its parameters include the mean vector
 and
the covariance matrix
 :
|

|
(16)
|
In formula 16,
 corresponds
to the three dimensions of the CIELAB color space, and the GMM parameters are
optimized by the expectation maximization algorithm.
In order to
extract the dominant and secondary colors of the image, based on the mixing
weights calculated by GMM, the Gaussian component with a larger weight
represents the dominant color, while the second largest component represents
the secondary color.
During the image
analysis process, the extracted material area is analyzed for features and key
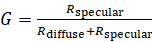
material properties are recorded. The surface light reflection characteristics
are calculated using the formula:
|
|
(17)
|
In formula 17,
 represents
the specular reflection component, that is, the brightness of the highlight
area.
 represents
the diffuse reflection component, that is, the overall light reflection of the
surface.
In order to
analyze the compatibility of different materials, a material compatibility
matrix is constructed based on physical properties. The formula is:
|

|
(18)
|
 are
the glossiness, roughness and texture characteristics of material i.
 are
the corresponding attributes of material j.
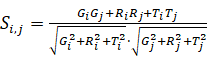
The formula for
calculating similarity is:
|
|
(19)
|
In formula 19, the
closer
 is to
1, the more compatible materials i and j are in terms of physical properties.
This matrix can be used to recommend material combinations. High-gloss metal
combined with low-roughness glass has high compatibility and is suitable for
modern style design. Rough fabric combined with low-gloss wood has moderate
compatibility and is suitable for warm atmosphere. High-roughness concrete
combined with high-gloss plastic has low compatibility and is not recommended.
In the PSO-based
method, the color matching and material combination are optimized through the
objective function. The objective function covers the color harmony index,
emotional color similarity, material conflict index, and user preference matching
to ensure that the optimization results meet both the design specifications and
the personalized needs of users.
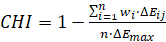
The Color Harmony
Index (CHI) is used to measure the coordination of the primary and secondary
colors in the CIELAB color space. The formula is:
|
|
(20)
|
In formula 20,
 is the
color difference between the primary color and the secondary color calculated
according to the CIEDE2000 standard, and
 is the
area ratio of the color in the design area.
 is the
theoretical maximum color difference. The closer CHI is to 1, the more
harmonious the color matching is.
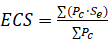
Emotional color
similarity (ECS) reflects the degree of match between the color expression in
the design scheme and the target emotion. Its calculation formula is:
|
|
(21)
|
In formula 21,
 is the
pixel ratio of a specific color area, and
 determines
the emotional intensity of the color based on the Pantone color psychology
database.
The Material
Conflict Index (MCI) is used to evaluate the possible conflicts between
different materials during the matching process. The formula is:
|

|
(22)
|
In order to
further enhance the personalization of design and user experience, user
preference matching is introduced as an additional goal. By using historical
user feedback data to establish a user preference model, an evaluation index
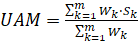
for user aesthetic matching is constructed. User preference matching is
calculated through collaborative filtering, and the formula is:
|
|
(23)
|
In formula 23,
 is the
user's preference weight for historical design solutions, and
 is the
similarity between the current design solution and the historical solution in
terms of multi-dimensional features.
The objective
function is expressed as a weighted sum:
|

|
(24)
|
The pseudo code of
the PSO optimization process is shown in Figure 3.
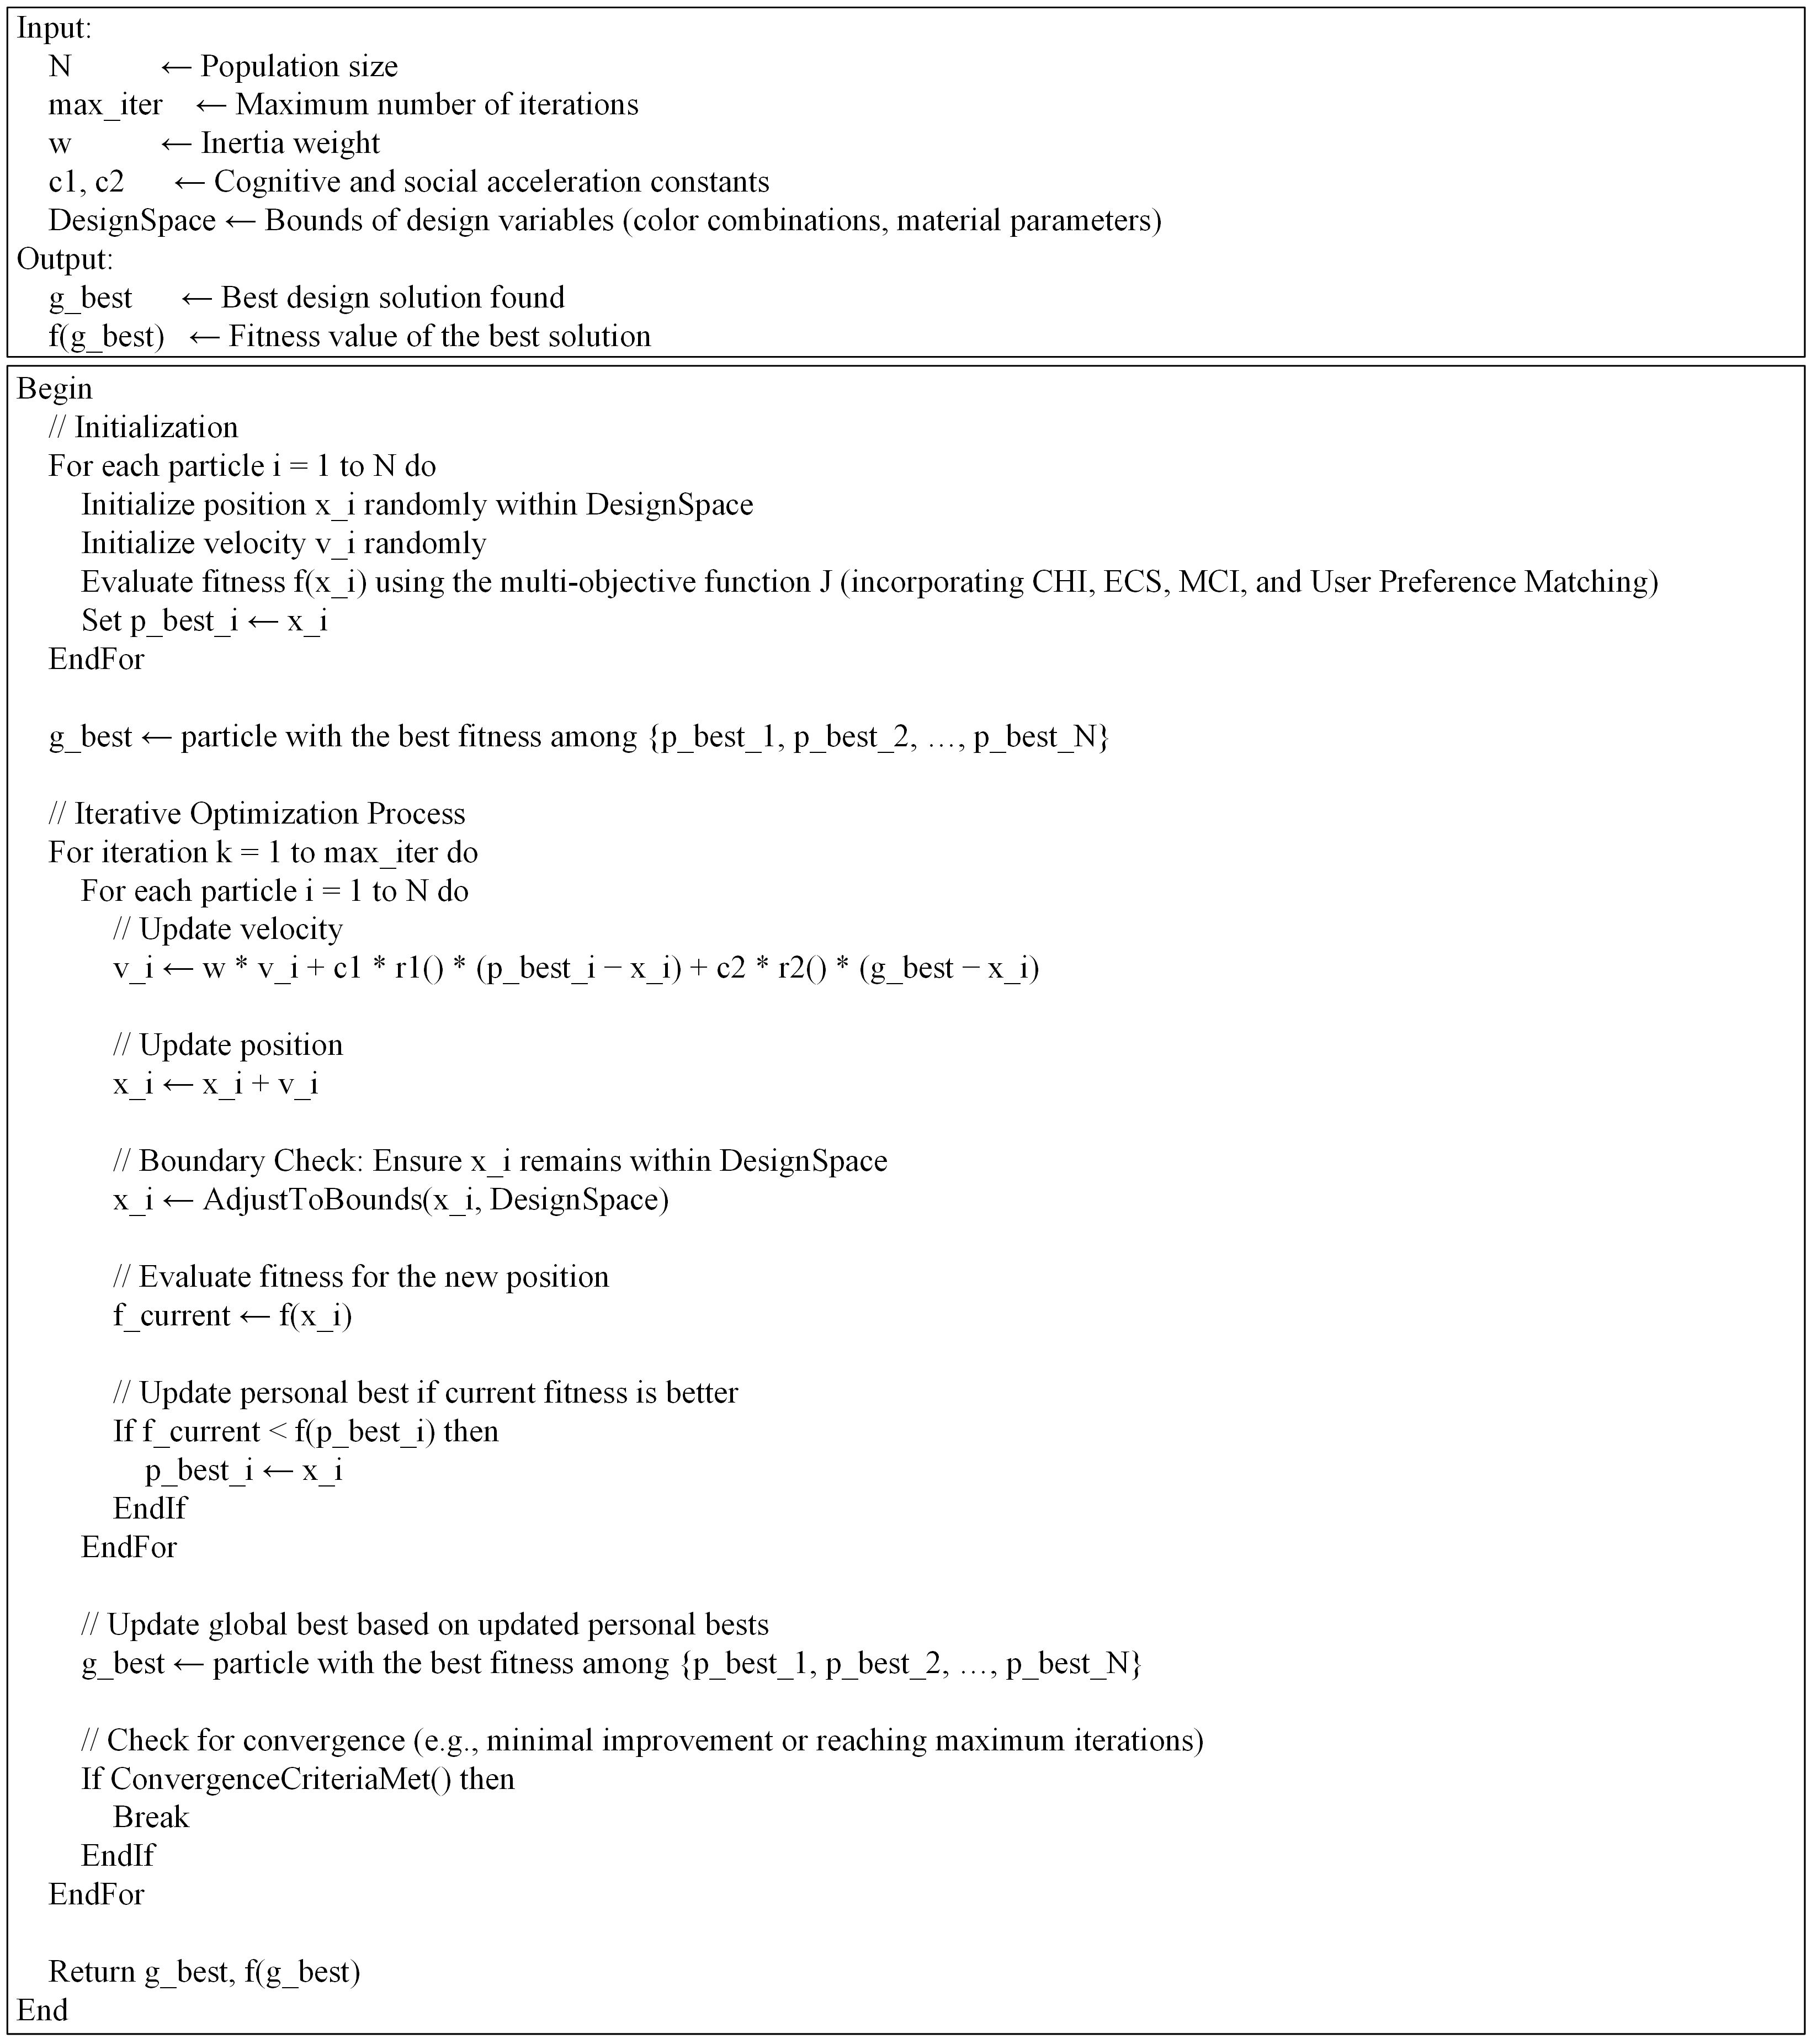
Figure 3.
Pseudocode of PSO optimization process
In this study, the
PSO algorithm is used to search for the optimal soft decoration design scheme.
In the initialization stage, a certain number of design schemes are randomly
generated. Each scheme consists of a set of color combinations and material
configurations. The scheme variables include the main color, auxiliary color
and corresponding material parameters of each area. In this way, each particle
represents a feasible design solution, forming the initial population. In the
fitness evaluation phase, each particle is evaluated according to a predefined
objective function, which comprehensively considers CHI, ECS, MCI and user
preference matching indicators. The comprehensive fitness value of each design
solution can be calculated. The evaluation results can serve as the
"fitness" feedback of the particle in the search space, guiding the
optimization process towards the design goal.
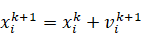
The particle update formulas are as follows:
|

|
(25)
|
|
|
(26)
|
In formula 25-26,
 and
 represent
the velocity and position of particle i at the kth iteration, respectively.
 is the
inertia weight, which controls the inertia of the particle.
 and
 are
acceleration constants, which guide the particle to its historical optimal
position
 and
the global optimal position
 ,
respectively.
 and
 are
random factors used to increase the randomness and diversity of the algorithm,
thereby preventing it from falling into the local optimum.
By repeating the
steps of fitness evaluation and particle update, the PSO algorithm enters an
iterative process until the stopping criterion is met: reaching a predetermined
number of iterations or the fitness value converges.
In virtual soft
furnishing design, three-dimensional scenes are built to simulate different
types of home spaces, such as living rooms, bedrooms, kitchens, bathrooms, etc.
Unity is used as a rendering and interaction platform, and professional
modeling tools are used for detailed modeling to ensure the true restoration of
the spatial structure. After the model is built, it is imported into Unity and
the geometry, textures, and material mapping are optimized to ensure rendering
quality and computational efficiency.
The 3D scene
construction process is shown in Figure 4.
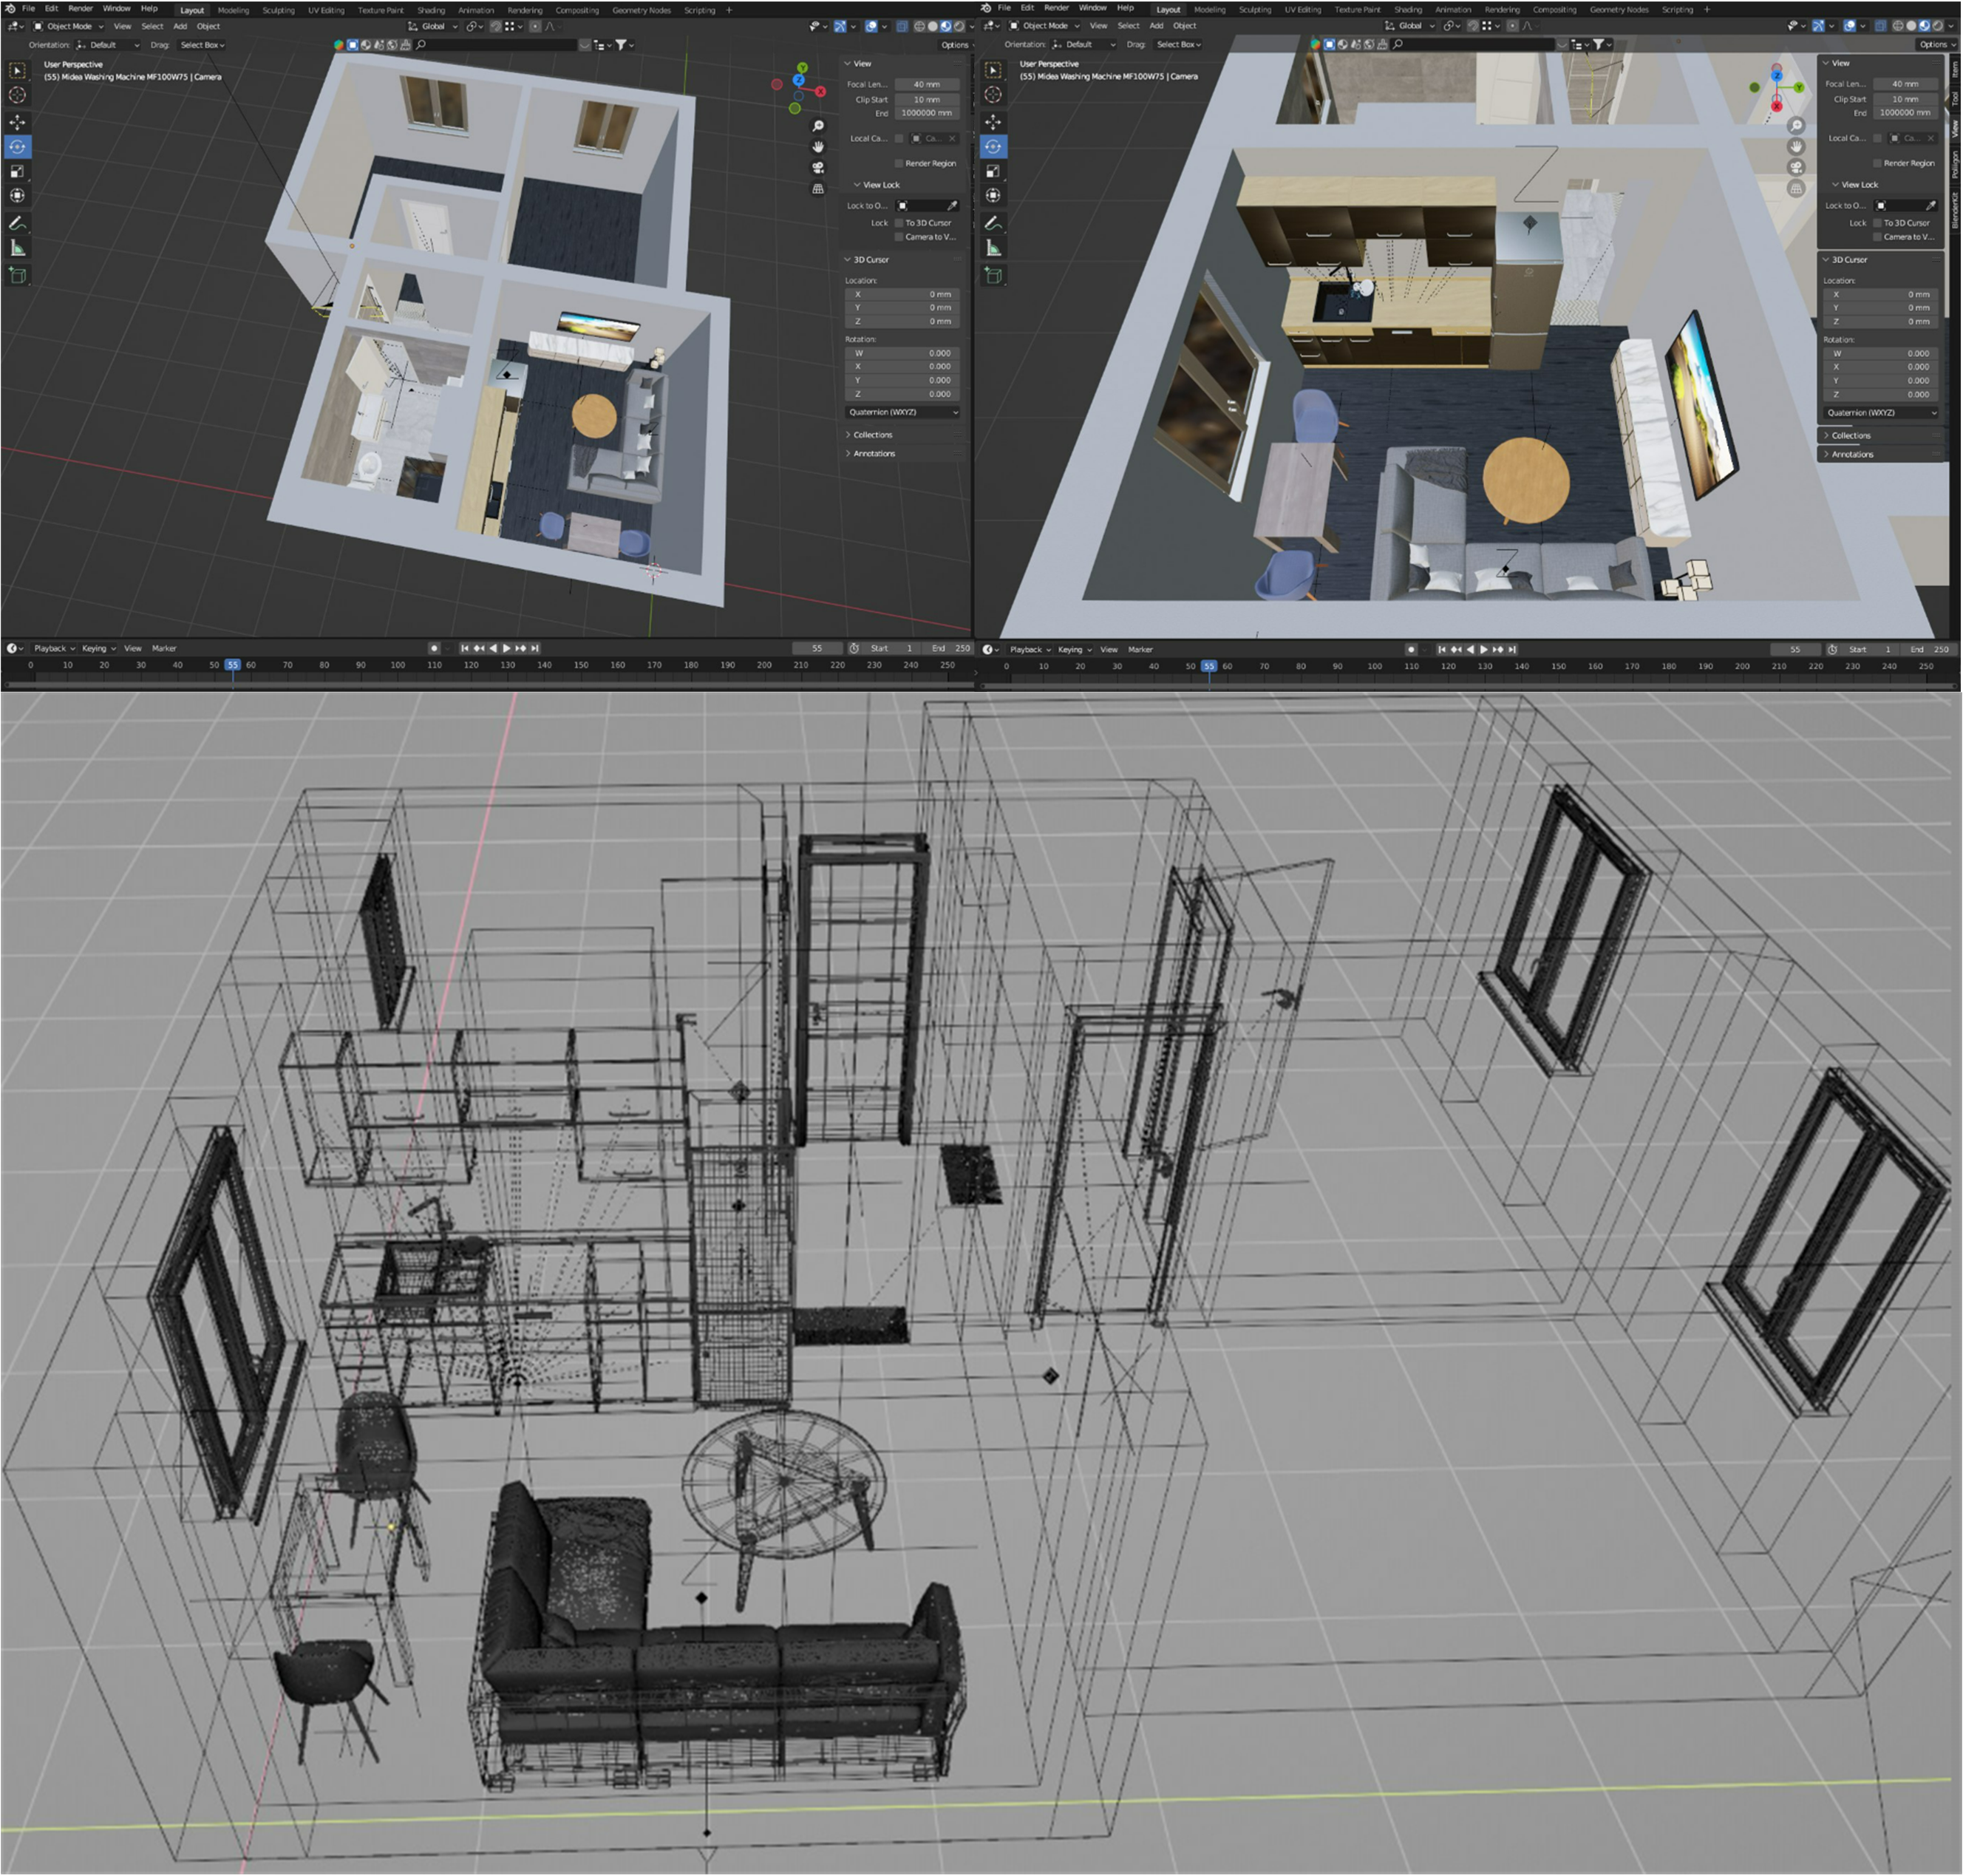
Figure 4. 3D scene construction process
Figure 4 shows the
construction process of the 3D scene, including modeling, material mapping, and
visualization of the structural wireframe. The two pictures in the upper part
show the scene rendering view completed in the 3D modeling software. From a
bird's-eye view, people can see the complete interior layout, including room
structure, furniture placement, and material application. The right window
provides rendering results from different perspectives, showing texture and
lighting effects. The wireframe view in the lower part shows the geometric
structure of the scene, highlighting the boundaries and vertex relationships of
the model. This process combines modeling, material mapping, and rendering
techniques to ensure the authenticity and aesthetics of the three-dimensional
scene.
Based on the
optimal soft furnishing design generated by the PSO algorithm, the calculated
color matching and material parameters are accurately mapped to each soft
furnishing element in the scene, such as sofas, coffee tables, curtains, TV
cabinets, etc. Through Unity's material system and Shader processing, different
materials can be realistically presented. Combined with color mapping rules,
the color matching of each element is ensured to conform to the PSO calculation
results to achieve optimal visual harmony.
Unity's built-in
physically based rendering provides a material modeling method that conforms to
real physical properties. By defining parameters such as glossiness, roughness,
normal map, and reflectivity, soft furnishings can present realistic physical
performance under lighting conditions. Smooth metal surfaces have high
reflectivity, while the surface of fabric sofas presents a high-roughness
diffuse reflection effect.
In order to improve
the lighting effect of virtual scenes, global illumination is used to calculate
indirect lighting, and real-time lighting and shadow technology is combined to
enhance the interactive effect of light on different material surfaces. With
the support of high-performance hardware, ray tracing technology is introduced
to enhance the softness of shadows, the realism of light refraction and
reflection, and make the overall vision more natural.
In order to
further optimize the rendering output and make it conform to the laws of human
visual perception, color management and Tonemapping technology are used for
post-production adjustments. It ensures that colors remain consistent across
different devices and lighting conditions, improves color expression by adjusting
highlight compression and contrast, and enhances the visual beauty of the final
rendered image.
In order to study
the accuracy of color feature extraction, ConvNeXt is compared with ResNet-50
(Residual Network-50), EfficientNet-B3, and ViT (Vision Transformer), and the
color difference between the extracted color features and the original image
color is calculated. The results are shown in Figure 5.
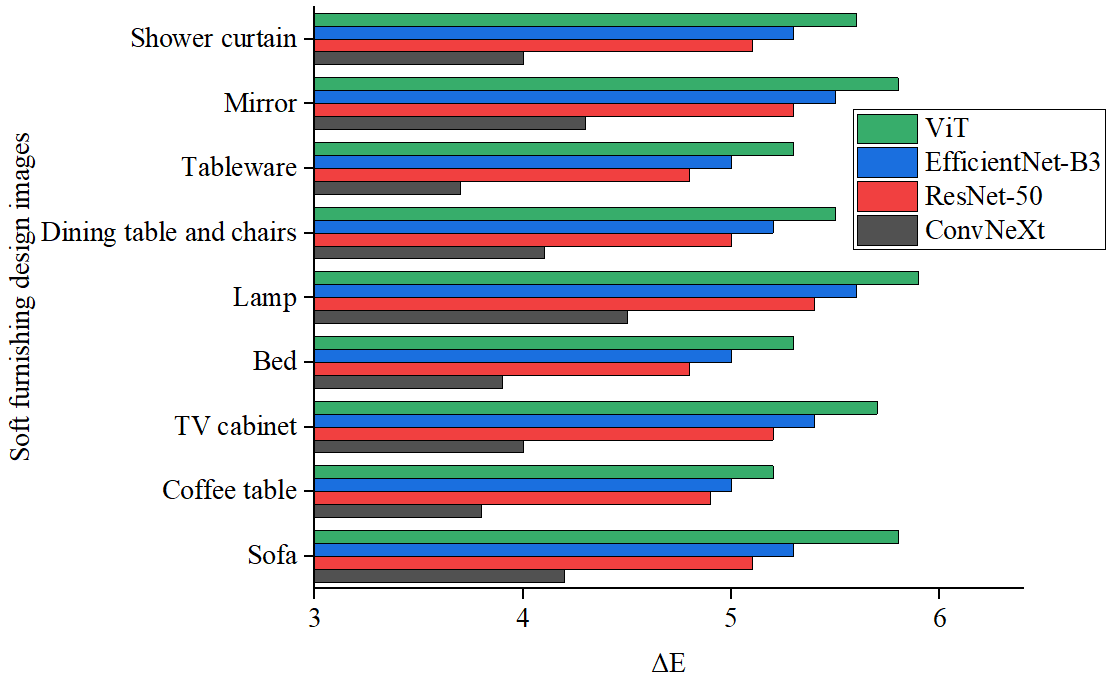
Figure 5. Color extraction color difference
The horizontal
axis ΔE in Figure 5 represents the difference between the extracted color
and the original image color in the CIELAB color space. The larger the value,
the more obvious the color difference is. It is used to evaluate the accuracy
of color restoration and matching. In the comparison of color feature
extraction accuracy of soft furnishing design images, the ConvNeXt model has
lower color difference than the ResNet-50, EfficientNet-B3 and ViT models in
all categories (sofa, coffee table, TV cabinet, bed, lamp, dining table and
chair, tableware, mirror, shower curtain). Taking the sofa as an example, the
color difference obtained by ConvNeXt is 4.2, while ResNet-50 and
EfficientNet-B3 are 5.1 and 5.3 respectively, and the color difference of ViT
is up to 5.8; similar situations are reflected in other design objects. This
shows that the ConvNeXt model has higher accuracy in capturing subtle color
changes in images and can more accurately extract the color distribution
information between the main color and the auxiliary color. The possible reason
is that ConvNeXt introduces an improved convolution module and normalization
strategy in the network structure, which makes it more sensitive to capturing
low-level color features. At the same time, its deeper feature layer is also
better at extracting global color information, thus gaining an advantage in
color feature modeling.
In contrast,
although ResNet-50 performs well in classic image classification tasks, its
residual connection design is slightly insufficient in capturing color details;
EfficientNet-B3 strikes a balance between computational efficiency and accuracy
through a compound scaling strategy, but its accuracy in color feature
extraction is slightly lower than ConvNeXt. Since ViT relies on the
self-attention mechanism to model global information, it may have certain
deficiencies in processing local subtle color changes, resulting in generally
higher color difference values. The ConvNeXt model showed lower color
difference values in this comparison, indicating that the difference between
its extracted color features and the original image color is minimal, which is
of great significance for the subsequent construction of color databases and
optimization of soft furnishing design. The lower color difference value
indicates the model's advantage in color restoration, which also means that it
can provide more accurate data support in the automatic generation of color
matching schemes.
The SSIM index is
used to measure the texture similarity between the extracted material texture
and the corresponding area of the original image. The results are shown in
Table 2.
Table 2. Texture similarity results
|
Soft furnishing
design images
|
ConvNeXt
|
ResNet-50
|
EfficientNet-B3
|
ViT
|
|
Sofa
|
0.92
|
0.89
|
0.88
|
0.87
|
|
Coffee table
|
0.93
|
0.90
|
0.89
|
0.88
|
|
TV cabinet
|
0.91
|
0.88
|
0.87
|
0.86
|
|
Bed
|
0.92
|
0.90
|
0.89
|
0.87
|
|
Lamp
|
0.93
|
0.91
|
0.90
|
0.88
|
|
Dining table and
chairs
|
0.91
|
0.89
|
0.88
|
0.87
|
|
Tableware
|
0.90
|
0.88
|
0.87
|
0.86
|
|
Mirror
|
0.92
|
0.90
|
0.89
|
0.88
|
|
Shower curtain
|
0.91
|
0.89
|
0.88
|
0.87
|
In Table 2, for
the texture similarity evaluation of different objects in soft furnishing
design, the ConvNeXt model achieved the highest SSIM value in all test items,
with the data ranging from 0.90 to 0.93, indicating that the material texture
features extracted are highly consistent with the texture of the corresponding
area of the original image. ResNet-50, EfficientNet-B3, and ViT have slightly
lower SSIM values. SSIM is an indicator for measuring the consistency of local
structure, contrast, and brightness of an image. The closer its value is to 1,
the more similar the two images are in texture and structure. ConvNeXt can
achieve a higher SSIM value, probably due to its improved convolution module
and deeper feature expression capabilities, which makes it more robust and
accurate in extracting subtle texture features of images. In addition, ConvNeXt
uses a more advanced normalization strategy and fine-grained feature fusion
method when processing color and texture information, thus performing well in
restoring the texture details of the original image.
Although ResNet-50
has achieved certain advantages in deep feature extraction by relying on
residual connections, its original design focuses more on semantic information,
and its ability to capture local texture details is slightly insufficient
compared to ConvNeXt. EfficientNet-B3 has made better adjustments in the
balance of network width, depth and resolution, but it still fails to surpass
ConvNeXt in high-precision texture feature extraction. As for the ViT model, it
has advantages in global feature modeling based on the self-attention
mechanism, but its sensitivity to local texture information may be limited by
the patch segmentation strategy, resulting in the retention of subtle texture information
not being as delicate as that of traditional convolutional networks. A higher
SSIM value indicates that ConvNeXt retains more original texture information in
material texture feature extraction, and also reflects that it attaches more
importance to local structure, contrast and edge details.
This paper uses a
fully automatic design method constructed by ConvNeXt, GMM and PSO to quantify
the color and material features in the image. Feature extraction combined with
manual design takes into account the aesthetic experience of data-driven and
traditional design, and combines the extracted features with Munsell color
harmony theory for design. Traditional manual design relies on the designer's
experience and intuition. Comparing these three design methods, the color
matching effect is shown in Figure 6.
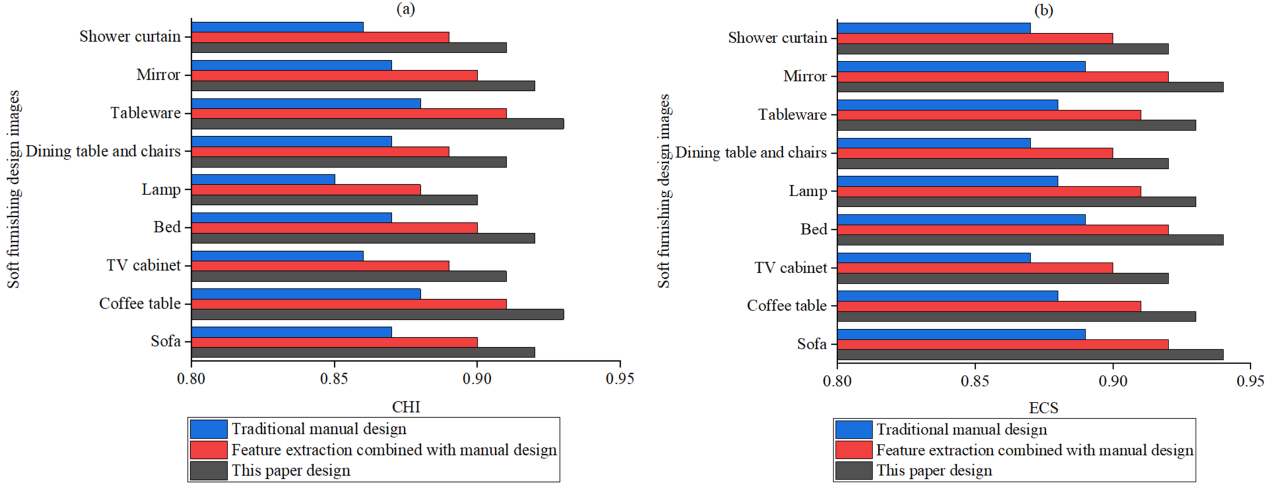
Figure 6. Color
matching effect. a) CHI result; b) ECS result
In Figure 6 (a),
the fully automatic design method constructed using ConvNeXt, GMM and PSO shows
the highest CHI value on all kinds of soft decoration design images. The method
of feature extraction combined with manual design is second, with a slightly lower
CHI value, and the traditional manual design has the lowest CHI value. This
shows that the design method in this paper can achieve more precise
quantification and optimization in color matching, and make full use of deep
learning models to capture tiny color differences in images. The color database
can be established through the Gaussian mixture model to accurately distinguish
the primary color and the secondary color, and then the PSO algorithm can be
used to perform global optimization under multiple design objectives to obtain
a matching solution with minimal color difference. In contrast, although the
feature extraction combined with manual design method introduces Munsell's
color harmony theory and corrects the automatically extracted features based on
traditional aesthetics, it is still affected by the subjectivity of manual
experience, making the color harmony slightly lower than that of the fully
automatic method. Traditional manual design relies entirely on the designer's
experience and intuition, and it is difficult to achieve precise quantitative
adjustment in color matching. It is easily restricted by personal style and
aesthetic bias, and thus performs the weakest in the CHI index. This difference
shows that data-driven fully automatic design has obvious advantages in color
harmony evaluation. Its quantitative algorithm can more accurately grasp the
color balance and proportion distribution in the design, and improve the
overall matching effect and consistency.
The ECS index in
Figure 6(b) also reflects the performance of different design methods in color
emotional expression. The ECS values of the fully automatic design method on
each category of images are maintained between 0.92 and 0.94. This method has
advantages in color difference control and is closer to the expected emotional
intensity in emotional expression, thanks to its fine extraction of color
features and full use of color psychology data. Although the feature extraction
combined with manual design method introduces the emotional intensity of
Pantone color psychology as an auxiliary evaluation in emotional expression,
its ECS value is slightly lower than the design in this paper, ranging from
0.90 to 0.92, because it still partially relies on manual experience in the
later color and material matching design process. Traditional manual design is
limited by the designer's subjective judgment and intuition in emotional color
expression, and its emotional color matching often lacks a unified quantitative
standard, resulting in ECS values generally lower than the automated method,
maintained at a level of 0.87 to 0.89. The design method in this paper achieves
the minimization of objective color difference through data-driven and
intelligent optimization, and can accurately convey the emotional atmosphere
required by the design by combining the emotional model. However, due to the
lack of quantitative support, traditional manual design is easily affected by
personal subjective factors, resulting in unstable emotional expression.
The material
conflict index is used to measure the material matching effect. The comparison
results of this paper's design, feature extraction combined with manual design,
and traditional manual design are shown in Table 3.
Table 3. MCI comparison results
|
Soft furnishing
design images
|
This paper
design
|
Feature
extraction combined with manual design
|
Traditional
manual design
|
|
Sofa
|
0.12
|
0.16
|
0.21
|
|
Coffee table
|
0.11
|
0.15
|
0.20
|
|
TV cabinet
|
0.13
|
0.17
|
0.22
|
|
Bed
|
0.12
|
0.16
|
0.21
|
|
Lamp
|
0.14
|
0.18
|
0.24
|
|
Dining table and
chairs
|
0.13
|
0.17
|
0.22
|
|
Tableware
|
0.11
|
0.15
|
0.20
|
|
Mirror
|
0.12
|
0.16
|
0.21
|
|
Shower curtain
|
0.13
|
0.17
|
0.22
|
The lower the MCI
value, the smaller the conflict between different materials in the matching
process, and the more harmonious the overall matching effect. From the data in
Table 3, it can be seen that the MCI value of the design method in this paper
is significantly lower than that of feature extraction combined with manual
design and traditional manual design in each design object. For sofas, the MCI
of this design method is 0.12, while feature extraction combined with manual
design is 0.16, and traditional manual design is 0.21; for lamps, the MCI of
this design method is 0.14, while the other two design methods are 0.18 and
0.24 respectively. This trend is consistent in all test objects, indicating
that the fully automatic design method shows higher compatibility and
consistency in material matching. The design method in this paper is based on
advanced technologies such as ConvNeXt, GMM and PSO. It can accurately extract
material properties (such as glossiness and texture features) in images and
minimize the physical property differences between materials globally through
data-driven optimization strategies. This method uses quantitative indicators
to accurately capture the subtle differences between each material, achieves
the best balance of material combinations through optimization algorithms, and
significantly reduces the material conflict index. In contrast, although
feature extraction combined with manual design draws on the guidance of
traditional design theory on color and material, there are still certain
subjective factors in the quantification and optimization of specific
parameters, resulting in material matching accuracy slightly inferior to that
of fully automatic methods. Traditional manual design relies entirely on the
designer's intuition and experience. Its design results lack strict
quantitative standards for material matching, which is prone to imbalance or
conflict, and thus the MCI value is relatively high. In general, the design
method in this paper has obvious advantages in material matching optimization.
It can not only better balance the physical properties of different materials,
but also achieve detailed global optimization, thus providing more scientific,
accurate and efficient technical support for virtual soft decoration design.
The purpose of
design time analysis is to quantify the time cost of the design process. The
time comparison between the design, feature extraction combined with manual
design, and traditional manual design in this paper is shown in Figure 7.
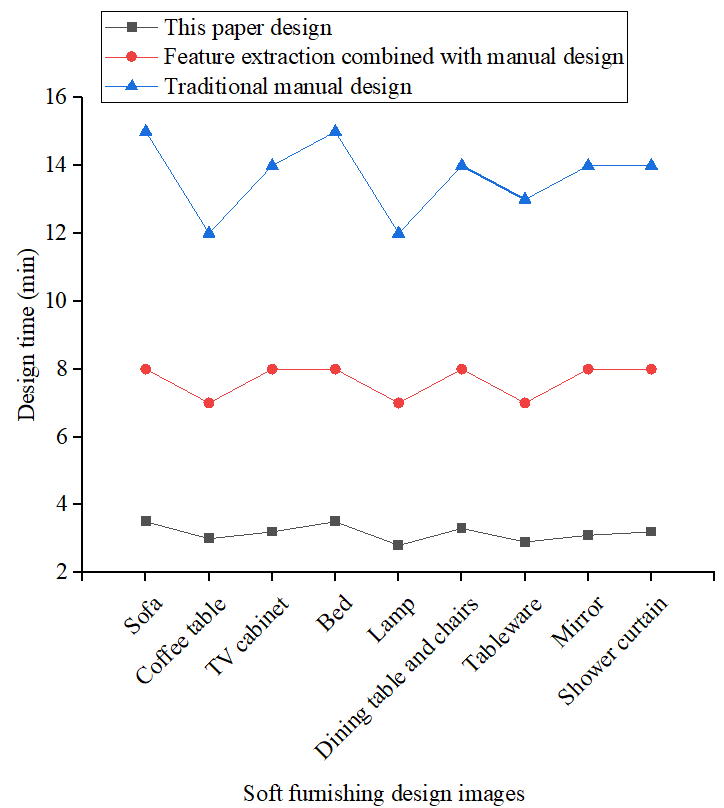
Figure 7. Design time
The design time of
this paper is kept between 2.8 and 3.5 minutes, which is significantly lower
than feature extraction combined with manual design and traditional manual
design. This difference reflects that the design method of this paper greatly
reduces the time of manual intervention in the design process through algorithm
automation and data-driven methods, thereby achieving an efficient design
process. The average design time for this design, feature extraction combined
with manual design, and traditional manual design were 3.2 minutes, 7.7
minutes, and 13.7 minutes, respectively. Although feature extraction combined
with manual design uses advanced image processing and intelligent optimization
methods, and is guided by traditional design theories (such as Munsell's color
harmony theory), it still requires designers to manually calibrate and optimize
the automatically generated solutions, so it takes nearly twice as long as
fully automatic design. Traditional manual design completely relies on the
designer's intuition and experience, and requires repeated discussions, experiments
and adjustments, which significantly prolongs the design time. The design
method in this paper has a relatively consistent time advantage on various
design objects, and the time fluctuation is small, indicating that its process
is highly standardized and automated, which is conducive to large-scale
application and rapid iteration. The improvement in efficiency can shorten the
project cycle, reduce labor costs, and enable the design solution to quickly
respond to market and user needs in multiple optimization iterations, thereby
enhancing the competitiveness of the design. Through this data comparison, it
can be further proved that the data-driven fully automatic design method has
significant advantages in improving design efficiency and reducing project
costs, providing strong support for the intelligent development of soft
decoration design.
Taking the kitchen
space as an example, the soft decoration design effects of different design
methods are shown in Figure 8.
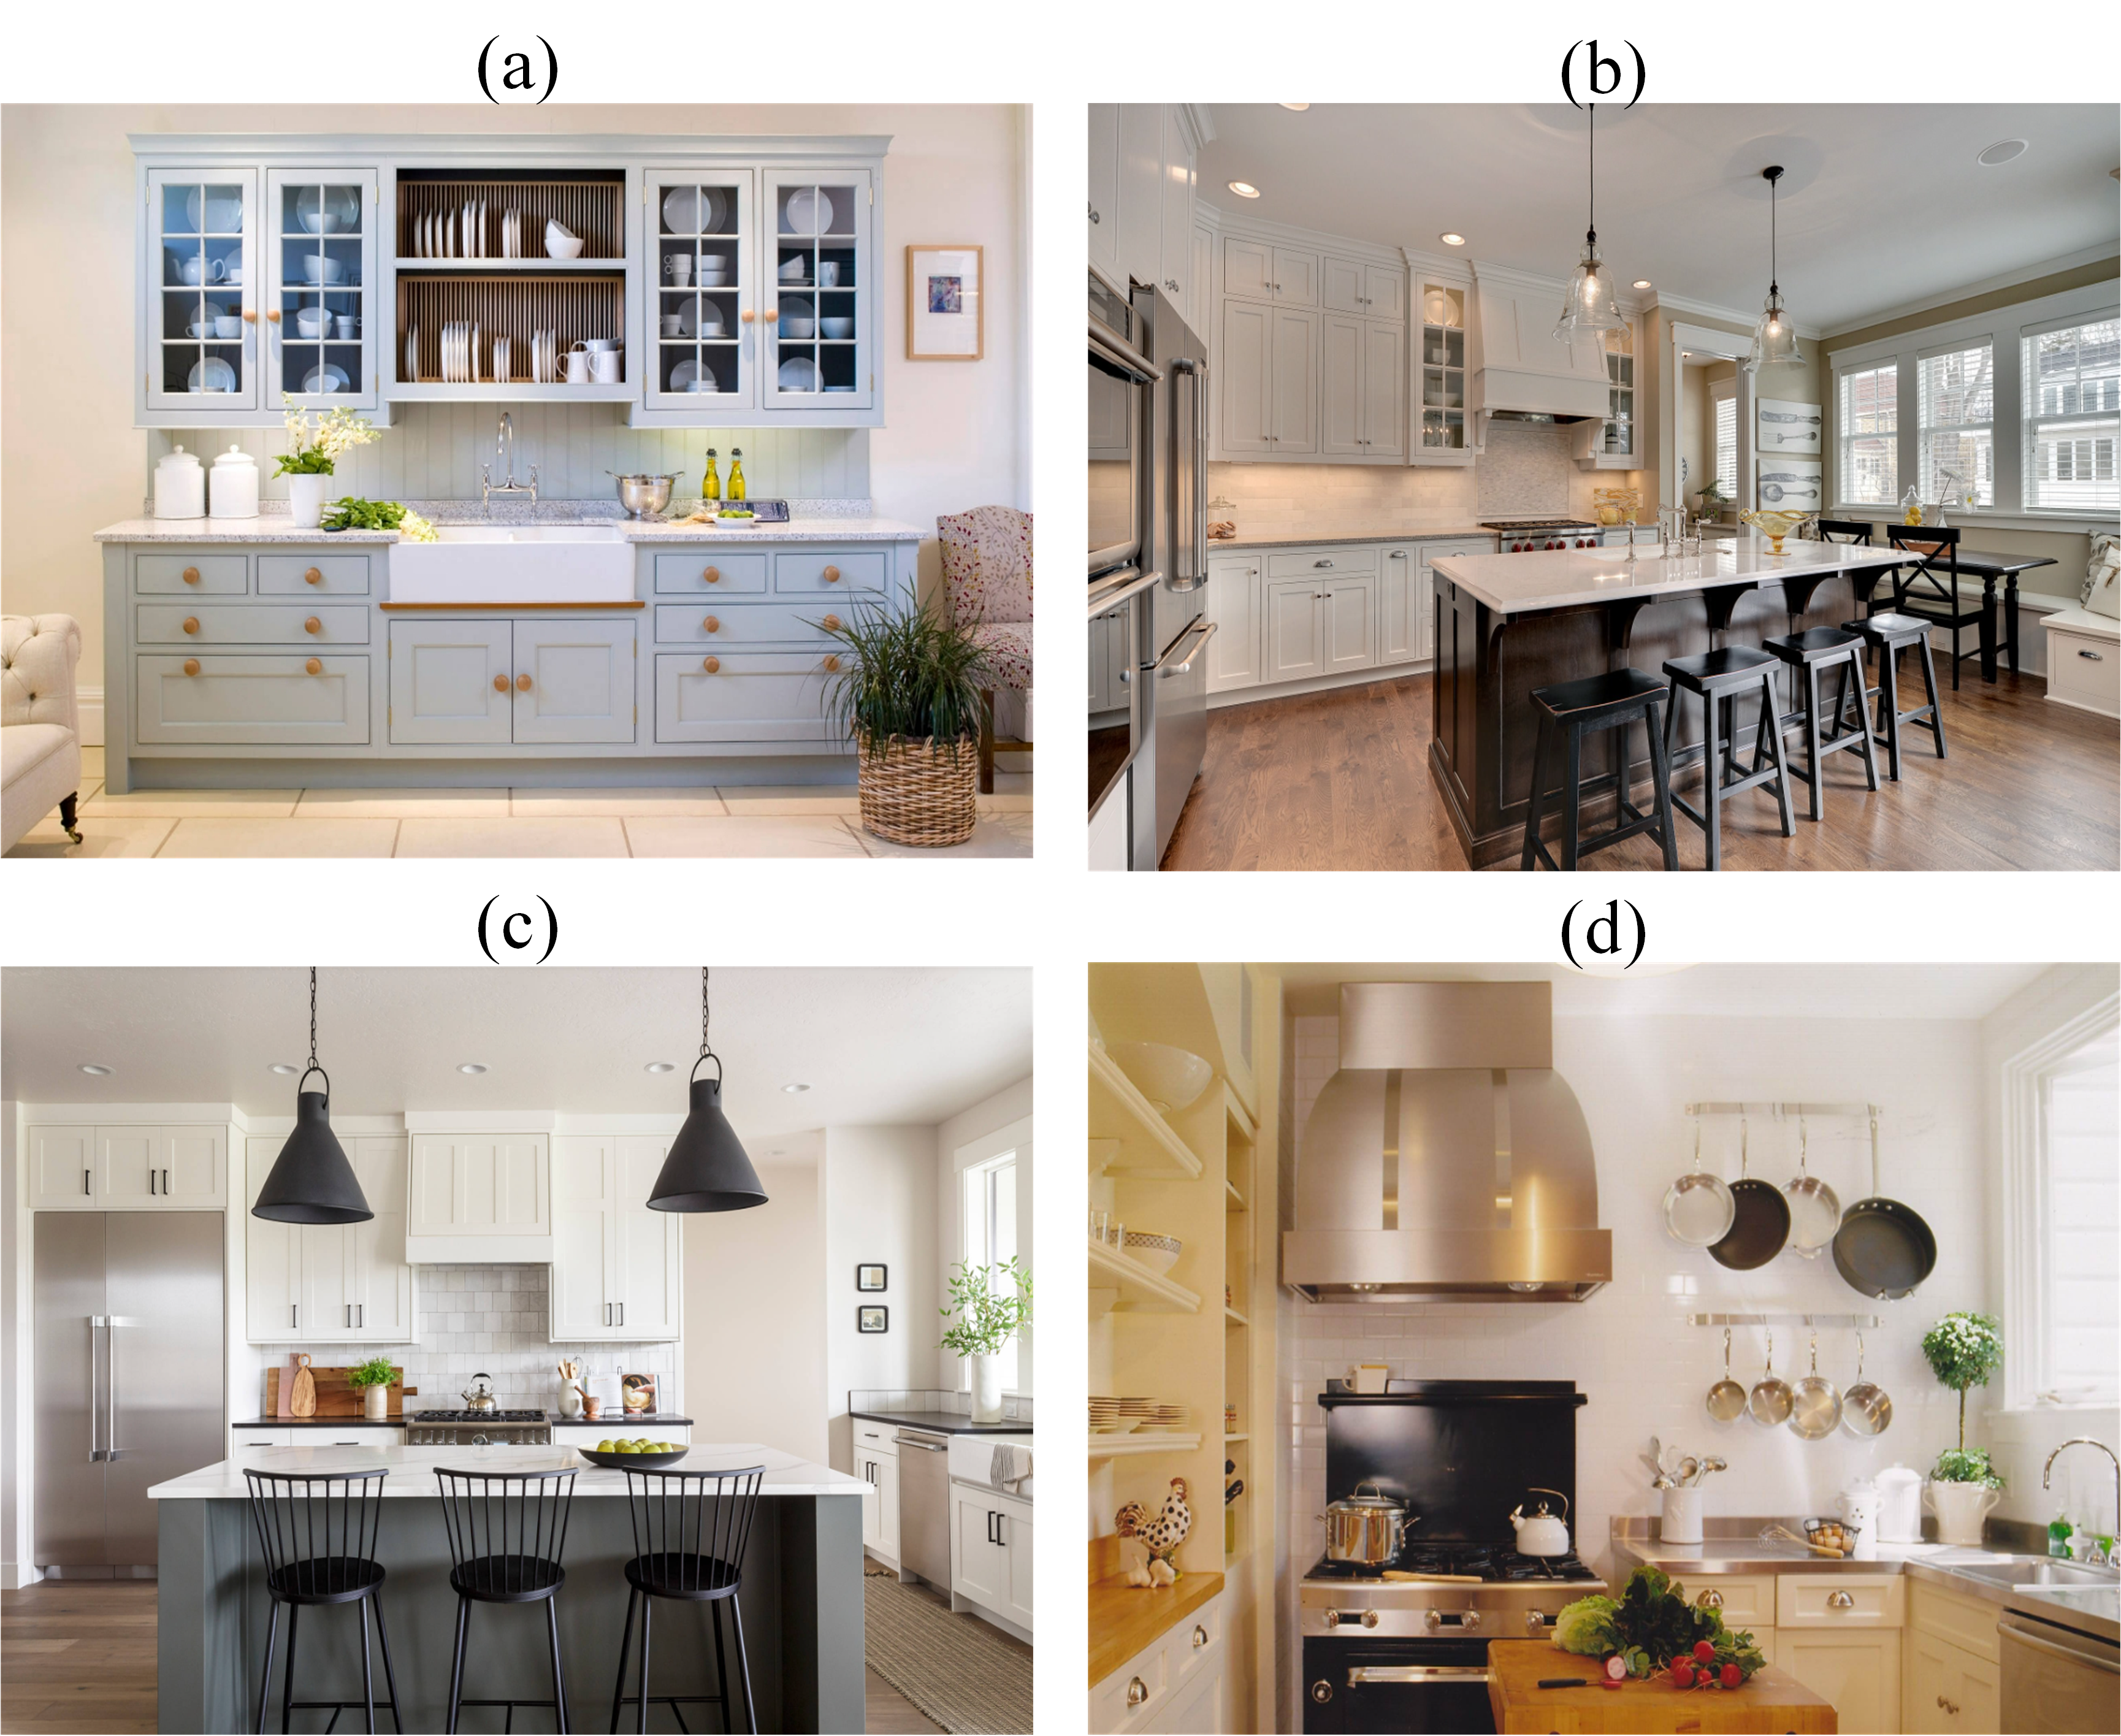
Figure 8. Soft
furnishing design display. a) Original kitchen; b) Design in
this paper; c) Feature extraction combined with manual design; d) Traditional
manual design
In the comparison
of soft decoration design of kitchen space, the three design methods are
optimized on the basis of the original kitchen color, but show different design
styles and effects. The design of this paper uses intelligent algorithms to
accurately extract color and material characteristics. Under the main tone of
light yellow-white, the lighting design enhances the sense of space hierarchy
and optimizes the placement of kitchen utensils to make the overall space more
tidy and orderly. In addition, the design of this paper emphasizes the
coordination of colors, and the matching of various materials is optimized
through the material conflict index to ensure visual harmony and unity. In
contrast, although the feature extraction combined with manual design method
also uses lighting, the black main color of the selected lighting is somewhat
inconsistent with the overall space, making the visual center of gravity more
dispersed and affecting the overall aesthetics. Traditional artificial design
focuses more on practicality, and the tableware and kitchen utensils are placed
compactly, which makes the space utilization rate higher, but lacks in
aesthetics and comfort. Overall, the design in this paper shows great
advantages in color matching, space utilization, material coordination, etc.,
achieving a good balance between functionality and aesthetics, and providing an
optimization solution for the intelligent soft decoration design of kitchen
space.
This paper studies
and constructs an intelligent soft decoration design method based on ConvNeXt,
GMM and PSO, which optimizes the matching scheme by accurately extracting the
color and material characteristics of the space. The research results show that
compared with traditional manual design and feature extraction combined with
manual design, the proposed method shows better performance in multiple key
indicators such as color harmony index, emotional color similarity and material
conflict index, achieving higher color coordination, visual beauty and spatial
adaptability. This paper combines deep learning and swarm intelligence optimization
technology to provide a quantifiable evaluation system for intelligent design.
By introducing a framework that combines data-driven and design aesthetics, it
breaks through the limitations of traditional design that relies on experience
and subjective judgment. This study promotes the development of intelligent
soft decoration design, improves design efficiency, and provides technical
support for personalized space optimization. However, this study still has some
limitations, such as only conducting experiments on specific indoor spaces, not
considering the applicability of more complex environments, and the ability to
adapt to user personalized preferences still needs to be improved. Future
research can further expand the scope of application of this method, combine
augmented reality and virtual reality technology, improve the interactive
experience of design solutions, and explore the application of deep
reinforcement learning in soft furnishing design to achieve more intelligent
and personalized optimization strategies.
This work was supported by the Shaanxi Provincial Social Science Fund Youth Project (No.2026QNJ020):Research on the Spatio-Temporal Diffusion Path and Driving Mechanism of Intangible Cultural Heritage Resources in Shaanxi Province
1. Ping Hu. "Discussion on the evaluation scheme of indoor environment design." Engineering Technology and Management 4.5 (2020): 144-146.
2. Hong Kaixin. "Research on the innovation and development of indoor environment design of teahouse space under the influence of Internet celebrity economy." ART AND DESIGN 2.5 (2023): 107-109.
3. Park, Bo Hyeon, and Kyung Hoon Hyun. "Analysis of pairings of colors and materials of furnishings in interior design with a data-driven framework." Journal of Computational Design and Engineering 9.6 (2022): 2419-2438. 10.1093/jcde/qwac114
4. Hawas, Hafez, and Shaimaa Shaker. "Innovate Designs for Upholstery Fabrics Glow in the Dark, Inspired from Islamic Art." Journal of Design Sciences and Applied Arts 1.1 (2020): 108-115. 10.21608/jdsaa.2020.70456
5. Jingwen Li. "Research on the color design of human-oriented interior space environment." Cultural and Art Innovation 7.4 (2024): 25-27. 10.12677/Design.2023.84279
6. Yu Bo. "Research on the application of color psychology in interior design." Digital Design 10.4 (2021): 51-52.
7. Li Yujie. "Application of decorative ceramic art in interior soft decoration design." Foshan Ceramics 32.11 (2022): 140-142.
8. Cheng Liang, and Zhang Huaying. "Research on soft decoration design in modern architectural interior design." Textile Industry and Technology 50.5 (2021): 87-88.
9. Guo, Shihui, Yubin Shi, Pintong Xiao, Yinan Fu, Juncong Lin, Wei Zeng, et al. "Creative and progressive interior color design with eye-tracked user preference." ACM transactions on computer-human interaction 30.1 (2023): 1-31. 10.1145/3542922
10. Cha, Seung Hyun, Shaojie Zhang, and Tae Wan Kim. "Effects of interior color schemes on emotion, task performance, and heart rate in immersive virtual environments." Journal of Interior Design 45.4 (2020): 51-65. 10.1111/joid.12179
11. Guo, Meng-Hao, Tian-Xing Xu, Jiang-Jiang Liu, Zheng-Ning Liu, Peng-Tao Jiang, Tai-Jiang Mu, et al. "Attention mechanisms in computer vision: A survey." Computational visual media 8.3 (2022): 331-368. 10.1007/s41095-022-0271-y
12. Sardenberg, Victor, Igor Guatelli, and Mirco Becker. "A computational framework for aesthetic preferences in architecture using computer vision and artificial neural networks." International Journal of Architectural Computing 23.1 (2025): 174-192. 10.1177/14780771241279350
13. Wang, Lina, Yaoming Liu, and Zhike Qian. "Image Segmentation Method for an Illumination Highlight Region of Interior Design Effects Based on the Partial Differential Equation." Advances in Mathematical Physics 2021.1 (2021): 3827783-3827783. 10.1155/2021/3827783
14. Wang Bo, Li Xianfeng, and Zhang Dan. "Research on interior design system based on virtual reality technology of image processing." Modern Electronic Technology 43.11 (2020): 68-71.
15. Fan Lingyan. "Research on interior design system based on digital processing technology and image processing technology." Modern Electronic Technology 44.9 (2021): 38-42.
16. Zhang Huiying, Lu Yuxi, Liang Yu, Wang Kai. "Optimal light source layout of indoor visible light channel based on parallel fully connected convolutional neural network model." Acta Optica Sinica 42.13 (2022): 1306001-1306001. 10.3788/AOS202242.1306001
17. Zhuang, Zilong, Ying Liu, Fenglong Ding, Zhengguang Wang. "Online color classification system of solid wood flooring based on characteristic features." Sensors 21.2 (2021): 336-336. 10.3390/s21020336
18. Jia Li. "The application of traditional Chinese colors in interior design." Foshan Ceramics 32.9 (2022): 118-120.
19. Durmus, Dorukalp. "CIELAB color space boundaries under theoretical spectra and 99 test color samples." Color Research & Application 45.5 (2020): 796-802. 10.1002/col.22521
20. Azetsu, Tadahiro, and Noriaki Suetake. "Chroma enhancement in CIELAB color space using a lookup table." Designs 5.2 (2021): 32-32. 10.3390/designs5020032
21. Zhang Chi, Meng Qinghao, and Jing Tao. "Video flame detection algorithm based on improved GMM and multi-feature fusion." Laser & Optoelectronics Progress 58.4 (2021): 0410006-0410006. 10.3788/LOP202158.0410006
22. Zhao Songling, Zhang Lingling, and Gu Bingfei. "Color extraction and analysis of cheongsam in the Republic of China based on clustering algorithm and PCCS system."Journal of Silk 59.11 (2022):64-64.
23. Wang, Yongjun, Tengping Jiang, Min Yu, Shuaibing Tao, Jian Sun, Shan Liu, et al. "Semantic-based building extraction from LiDAR point clouds using contexts and optimization in complex environment." Sensors 20.12 (2020): 3386-3386. 10.3390/s20123386
24. Hwang, Sung-Wook, and Junji Sugiyama. "Computer vision-based wood identification and its expansion and contribution potentials in wood science: A review." Plant Methods 17.1 (2021): 47-47. 10.1186/s13007-021-00746-1
25. Alsmadi, Mutasem K. "Content-based image retrieval using color, shape and texture descriptors and features." Arabian Journal for Science and Engineering 45.4 (2020): 3317-3330. 10.1109/TMM.2008.2001357
26. Zhao Shen. "Color matching system for film and television animation scenes based on feature point extraction." Journal of Jilin University (Information Science Edition) 40.4 (2022): 688-693.
27. Alhijawi, Bushra, and Arafat Awajan. "Genetic algorithms: Theory, genetic operators, solutions, and applications." Evolutionary Intelligence 17.3 (2024): 1245-1256. 10.1007/s12065-023-00822-6
28. Gad, Ahmed Fawzy. "Pygad: An intuitive genetic algorithm python library." Multimedia tools and applications 83.20 (2024): 58029-58042. 10.1007/s11042-023-17167-y
29. Gad, Ahmed G. "Particle swarm optimization algorithm and its applications: a systematic review." Archives of computational methods in engineering 29.5 (2022): 2531-2561. 10.1007/s11831-022-09762-3
30. Feng Qian, Li Qing, Quan Wei, Pei Xuanmo. "A review of multi-objective particle swarm optimization algorithm research." Journal of Engineering Science 43.6 (2021): 745-753. 10.13374/iissn2095-9389
31. Zhang Jianhui, and Gui Yafu. "Research on the application of color theory in color spinning product development." Cotton Textile Technology 48.583 (2020): 53-53. CNKI:SUN:MFJS.0.2020-05-022
32. Xue Hao, Fan Longlong, and Li Ziyin. "Application of virtual reality technology in residential space interior design." Anhui Architecture 28.2 (2021): 92-92.
33. Zhao Ruolin. "Interior design innovation and application based on virtual reality technology."Journal of Kaifeng Vocational College of Culture and Art 40.2 (2020): 239-240.
34. Xie, Yixuan, Ridzuan Bin Hussin, and Azlin Lryani Binti Mohd Noor. "The Design Method of “Semiosis” in Interior Furnishing Design." Art and Design Review 9.3 (2021): 254-262. 10.4236/adr.2021.93020
35. Ali, Adibah, Suhaila Mohd Zain, and Sharifah Nurulhuda Tuan Mohd Yasin. "Utilizing Marker to Integrate Augmented Reality in Furniture Using Unity 3D." International Journal of Advanced Research in Technology and Innovation 4.2 (2022): 99-108. 10.55057/ijarti.2022.4.2.11