Modern climate trends are accompanied by an increase in emergency
situations associated with dangerous natural phenomena, among which avalanches
stand out. Avalanches are common in many countries - in Russia, Kazakhstan,
Tajikistan and others. Their activity is destructive in nature, and therefore
arouses significant interest in forecasting [1-3].
Within the framework of avalanche analysis, both the mechanisms of
avalanche occurrence and the mechanisms of interaction of the snow mass with
infrastructure are studied [4, 5].
An important stage of the study is the visualization of the model -
for this, specialized programs and analytical complexes are used [6].
Visualization of the phenomenon model allows you to effectively
solve the problems of phenomenon segmentation, which can improve the results of
analytical models - for example, the RAMMS model demonstrates satisfactory
results even in conditions of insufficient data [7, 8].
In this case, zoning by hazard degrees played a significant role in
the analysis. Thus, the issue of structural segmentation of an avalanche shows
its relevance in order to improve the quality of forecast models.
Among other models of analysis for the qualitative study of data
with an ordered argument, one can single out the model of almost periodic
analysis based on a generalized shear function. Its application in the problem
of segmentation of a dangerous natural phenomenon using tropical cyclones as an
example has shown high efficiency [9].
Almost-periodic analysis is a mathematical tool for studying
empirical data represented by records of the function y(t) ordered by a uniform
argument. To identify the values of characteristic intervals of uniform data
behavior, called almost-periods, the values of the generalized shift function
(1) are calculated for a set of values of the function y(t):
|

|
(1)
|
where
n is the total number of samples of the function y(t); t are integers
representing the argument values of the function y(t); Δt is a positive integer representing the shift in the argument;
τ is a positive integer representing the near-period values.
Local minima of the resulting function are analyzed for various
values of the Δt argument, and the most
significant and consistent values are identified, representing near-periods for
the set of values under study. The results of processing the generalized shift
functions for all rows and columns of the image are summarized, and the most
common near-period values are identified, characterizing the avalanche
structure under study in the image.
An approach to visualizing the results of almost periodic analysis
applied to graphical data on a snow avalanche is proposed.
In the course of processing images of dangerous natural phenomena
such as avalanches, various methods of analysis can be used, pursuing their own
goals. One of the problems solved in this area is the structural segmentation
of an avalanche, which involves identifying characteristic parts, points, lines
and boundaries of stable behavior areas. To solve such a problem, one can use
quasi-periodic analysis based on the selection of rhythmic characteristics
describing intervals of uniform data behavior.
Almost periodic analysis can be carried out both in relation to the
data of the original image and in the processed area. Thus, a rational solution
seems to be localization of the area of the phenomenon body on the entire
image, and reduction of the data to a straightened form. For this purpose, the
polygonal linearization algorithm can be used, reducing avalanche structures of
arbitrary shape to a rectangular form, in which it becomes possible to carry
out quasi-periodic analysis in relation to horizontal and vertical sections.
The results of the almost periodic analysis were presented in the form of
rhythmic beats defining intervals of uniform behavior of a function with an
ordered argument.
As part of the study of linearized data, the almost periods defined
the structural marking of the system into rectangular sectors.
For the practical implementation of the results, a description of
the algorithm was carried out that forms the reproduction of the structural
marking of the identified boundaries on the studied data.
During the almost periodic analysis of the avalanche structure in
linearized coordinates, the polygons form an approximating network that
describes the geometric specifics of the phenomenon.
Let us consider the main approach used to reproduce the boundaries,
which are segments connecting the opposite sides of the polygon quadrangles, on
the space of the original image based on the coordinates of the polygon
vertices.
For a polygon with vertex coordinates
 ,
,
 ,
,
 and
and
 with a given transverse sampling frequency
 ,
the boundary along the
,
the boundary along the
 -th
cut passes along the segment connecting the points
-th
cut passes along the segment connecting the points
 and
and
 .
.
Thus, for a polygon with the number of transverse divisions 7, the
boundary number 4 is shown by a dotted line in Fig. 1.

Fig.1. Reproduction of a longitudinal boundary in a polygon
Thus, to draw longitudinal boundaries of structural segmentation in
each polygon,
-th
segments are drawn sequentially. Thus, an example of the 8th longitudinal boundary for
dividing the image into 10 strips is shown in Fig. 2.

Fig.2. Reproduction of a longitudinal boundary in a system of
polygons in the space of the image under study
In the case of constructing transverse boundaries, the segment is
constructed in a polygon with a longitudinal sampling frequency
 along the
 -th
section between points with coordinates
-th
section between points with coordinates
 and
and
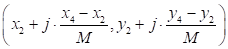 .
Thus, the 2nd boundary for 7 longitudinal sectors inside the polygon is shown by a dotted line in Fig. 3.
.
Thus, the 2nd boundary for 7 longitudinal sectors inside the polygon is shown by a dotted line in Fig. 3.

Fig.3. Reproduction of the transverse boundary in the polygon
To reproduce the
-th
transverse boundary in the structure of a sequence of polygons with
longitudinal sampling frequencies
 ,
it is necessary to determine the polygon number based on the inequality
,
it is necessary to determine the polygon number based on the inequality
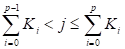 .
.
Then the
 -th
slice is carried out in the
-th
slice is carried out in the
 -th
polygon with the sampling frequency
-th
polygon with the sampling frequency
 .
.
Thus, as an example, the appearance of the 8th transverse boundary
is shown by the dotted line in Fig. 4.

Fig. 4. Reproduction of a longitudinal boundary in a system of polygons in the space of
the image under study
Thus, the principles of constructing longitudinal and transverse
boundaries within polygon systems are described.
Let us consider the features of the algorithm that reproduces
boundaries in a uniform tact mode within the framework of constructing a system
of rhythmic structuring of the studied snow avalanche.
To mark a regular system of longitudinal almost periods of size
 and transverse almost periods
 in a structure of
 linearizing polygons with given transverse sampling frequencies
 and a system of longitudinal samplings
 ,
an algorithm is proposed, the diagram of which is shown in Fig. 5.
,
an algorithm is proposed, the diagram of which is shown in Fig. 5.
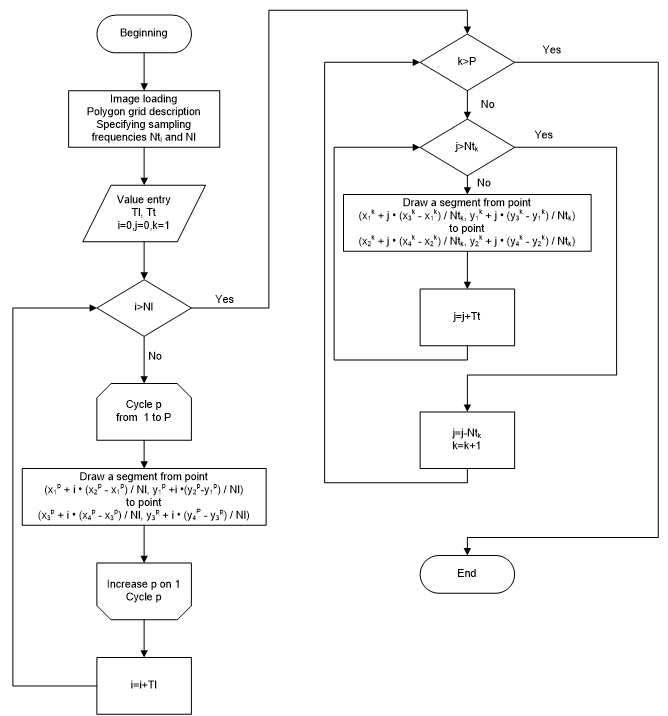
Fig. 5. Graphic description of the algorithm for reproducing the
structural segmentation of the object under study using the initial data:
is the longitudinal sampling frequency of the
 -th
polygon;
is the transverse sampling frequency of the polygon system;
is the value of the transverse almost period;
-th
polygon;
is the transverse sampling frequency of the polygon system;
is the value of the transverse almost period;
 is the value of the longitudinal almost period;
,
,
is the value of the longitudinal almost period;
,
,
 are auxiliary iterator variables;
is the polygon number variable;
is the number of polygons;
are auxiliary iterator variables;
is the polygon number variable;
is the number of polygons;
 ,
,
 are the
-th
(
= 1,2,3,4) coordinates of the
-th
polygon, the relative
position of which is determined according to Fig. 1 and Fig. 3.
are the
-th
(
= 1,2,3,4) coordinates of the
-th
polygon, the relative
position of which is determined according to Fig. 1 and Fig. 3.
To implement the algorithm for this study, a program was developed
in the Jupiter Notebook development environment using Python 3.7. The plot
module of the matplotlib library was used for graphics processing. The
black-and-white image data was represented as a matrix of pixels with values
ranging from 0 to 255, allowing it to be displayed using the contourf module,
which is designed for displaying contour representations of data.
For efficient processing of datasets represented as vectors and
matrices, the NumPy library was used.
The program's implementation in Python ensures cross-platform
compatibility, allowing deployment and use on major public operating systems
(Windows, Linux, macOS).
Within the framework of the developed program, the user is able to
form approximating polygonal representations of the processed image area, set
the frequencies of longitudinal and transverse sampling, and also select the
near periods displayed in the polygon system based on the algorithm presented
in the work.
An example of the algorithm implementation on an avalanche image for
a grid of 3 polygons with a transverse sampling frequency of 300 nodes, and a
longitudinal sampling of 600 nodes in total with a distribution of 200, 250,
and 150 nodes, respectively. The reproduction of a transverse almost period of
87 sampling nodes and a longitudinal almost period of 155 sampling nodes is
shown by dotted lines in Fig. 6.
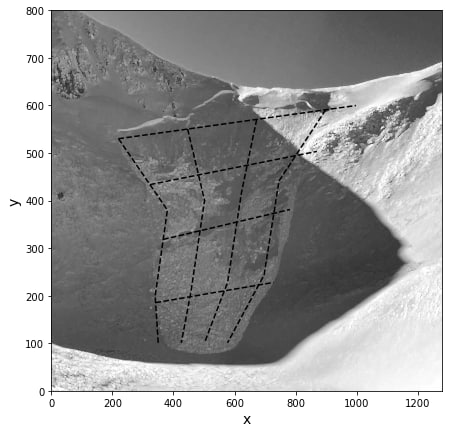
Fig. 6. Structural segmentation of the studied
snow avalanche
It should be noted that Fig. 6 clearly shows how the developed
structural segmentation algorithm separates the boundaries of the laminar and
turbulent snow avalanche regions. The division by longitudinal boundaries into
three segments reproducing avalanche descents from two ridges and the merging
of these flows in the middle was explicitly recorded. Transverse boundaries cut
off the descent start cycle, the interval of the movement bend, and the final
period of avalanche braking.
The obtained results allow us to predict avalanche activity to
ensure sustainable and high-quality development of regional infrastructure and
support decision-making in the design of avalanche protection structures.
An algorithm for reproducing rhythmic structural segmentation of the
boundaries of laminar and turbulent areas of a snow avalanche has been
developed. A mathematical basis for visualizing boundaries in single polygons
is provided, as well as an algorithm that implements a systematic approach to
constructing longitudinal and transverse boundaries in systems of linearizing
polygons.
Graphic examples demonstrate the possibilities of constructing
single longitudinal and transverse boundaries on the initial data, as well as
their almost periodic system of spatial structuring.
The results obtained can be useful in increasing the accuracy of
avalanche activity forecasting models, as well as in designing avalanche
protection structures to minimize damage to the population and infrastructure.
1. Saidov, M. S. State of avalanche mapping in Tajikistan: avalanche-forming factors and a brief review of snow avalanche forecasting methods / M. S. Saidov // Bulletin of the Branch of the Moscow State University named after M.V. Lomonosov in Dushanbe. - 2024. - V. 1, No. 1 (37). - P. 125-133. - EDN GXNWPE.
2. Bykov, N. I. Dendrochronological analysis of snow avalanches in Altai / N. I. Bykov, N. V. Rygalova, A. A. Shigimaga // Fundamental geography in Siberia: stages of development, results and prospects: Proceedings of the Inter-national Scientific Conference, dedicated to the memory of outstanding geog-raphers: the 95th anniversary of the birth of Vladimir Vasilyevich Vorobyov, the 85th anniversary of the birth of Valerian Afanasyevich Snytko, the 75th anniversary of the birth of Alexander Nikolaevich Antipov, Irkutsk, November 27Р30, 2024. Р Irkutsk: V.B. Sochava Institute of Geography, Siberian Branch of the Russian Academy of Sciences, 2024. Р P. 283Р285. Р EDN GCDQTU.
3. Geoinformation research for monitoring snow avalanches in the East Kazakhstan region of the Republic of Kazakhstan / O. A. Petrova, G. K. Dau-mova, N. F. Denisova [et al.] // InterCarto. InterGIS. - 2024. - V. 30, No. 1. - P. 545-555. - DOI 10.35595/2414-9179-2024-1-30-545-555. - EDN FSBVCY.
4. Chernichenko, E. I. Snow avalanches - features of formation / E. I. Cher-nichenko // Rational use of natural resources for sustainable development: Pro-ceedings of the III interregional conference of students of secondary general, secondary vocational and higher education institutions, held with the support of the Krasnoyarsk Regional Science Foundation, Krasnoyarsk, October 16-18, 2024. - Krasnoyarsk: Krasnoyarsk State Agrarian University, 2024. - P. 164-167. - EDN KPKQOH.
5. Kalach, A. V. Model and algorithm for the interaction of a snow ava-lanche with structures / A. V. Kalach, A. S. Soloviev, T. V. Lentiaeva // Tech-nologies of techno-spheric safety. - 2024. - No. 1 (103). - P. 152-163. Р DOI 10.25257/TTS.2024.1.103.152-163. Р EDN ALXLFY.
6. Lentiaeva, TV Software implementation of a three-dimensional model of snow mass dynamics / TV Lentiaeva // Bulletin of the Voronezh Institute of the Federal Penitentiary Service of Russia. Р 2023. Р No. 3. Р Pp. 104-111. Р EDN PWQYLY.
7. On the issue of modeling snow avalanches with insufficient data / AS Turchaninova, SA Sokratov, Yu. G. Seliverstov [et al.] // GeoRisk. Р 2020. Р Vol. 14, No. 1. Р Pp. Р DOI 10.25296/1997-8669-2020-14-1-38-47. Р EDN GCDUTN.
8. Zhukova, E. D. Assessment and consideration of avalanche danger in the development of resorts (on the example of Krasnaya Polyana) / E. D. Zhukova // Engineering surveys in construction: Proceedings of the fourth All-Russian scientific and practical conference of young specialists, Moscow, April 29, 2022. Р Moscow: Geomarketing, 2022. Р P. 134-139. Р EDN PPRSCG.
9. Kalach, A. V. Application of quasi-periodic analysis of cyclone activity dynamics images for developing management decisions to increase the resili-ence of territories in emergency situations / A. V. Kalach, A. A. Paramonov // Theory and practice of increasing the resilience of urbanized territories in emergency situations: Collection of materials of the international round table (within the framework of the XV International Salon of Security Means "Inte-grated Security-2024"), Congress and Exhibition Center "Patriot", Kubinka, Moscow Region, May 30, 2024. - Moscow: All-Russian Research Institute for Civil Defense and Emergencies of the Ministry of Emergency Situations of Russia, 2024. - P. 106-112. - EDN UUIGZ