Atherosclerosis is a primary contributor to
cardiovascular illness and death globally, contributing to conditions like
heart attacks, strokes, and peripheral artery disease. It involves the build-up
of plaque containing lipids in artery walls, causing vessel narrowing, blood
flow issues, and raising the chance of blood clot formation. Despite progress
in medical therapy and revascularization, the incidence of atherosclerotic
cardiovascular diseases continues to rise, underscoring the need for improved
diagnostic and therapeutic strategies [1].
The term "unstable plaque" was
first coined over two decades ago in the context of describing the triggers of
acute coronary syndrome, representing a clinically insignificant but
rupture-prone coronary lesion [2]. The intricate nature of plaque biology,
involving inflammation, endothelial dysfunction, and lipid composition, plays a
role in their diverse characteristics. Recognizing plaques at risk of
rupturing, often distinguished by a thin fibrous cap and substantial lipid
core, is essential for averting cardiovascular incidents [3].
Traditional coronary angiography can only
identify blockages in coronary blood vessels, leading to the need for other
approaches to pinpoint unstable plaques. In the last twenty years, advancements
in intravascular imaging techniques like intravascular ultrasound and optical
coherence tomography have allowed for detailed examination of atherosclerotic
plaques. This analysis can provide insights into plaque morphology that align
with what is observed in post-mortem histological examinations [4].
Recognizing the pivotal role of machine
learning in medical image analysis [5–9], we have endeavored to advance the
field further in this study. By harnessing the power of machine learning, we
aimed to develop a robust tool for the segmentation and quantitative assessment
of coronary OCT-image objects. Our unique dataset, compiled from a cohort of 40
patients, has undergone meticulous annotation by experts and continues to
expand, thereby facilitating further research into plaque vulnerability and
cardiovascular risk assessment.
In our quest for innovative solutions, we
extensively fine-tuned and tested several commonly used neural networks in the
industry. This iterative procedure led us to develop an ensemble method that
not only improves the precision and dependability of segmenting coronary OCT
images but also sets the stage for future progress in this field. By combining
the strengths of multiple neural networks, our approach offers a comprehensive
solution to the challenges posed by the intricate nature of coronary
OCT-images.
To accomplish this task, 40 OCT
volumes were gathered and annotated, comprising 19 volumes from female patients
and 21 from male patients. Each OCT volume is a tri-channel video file with a
frame resolution of 704x704 pixels. The depth of view of each OCT volume ranges
from 215 to 270 frames. To ensure the representativeness of the sample, OCT
volumes were obtained from two devices, one from St. Jude Medical and the other
from LightLab Imaging. The data were collected during diagnostic procedures at
the Research Institute for Complex Issues of Cardiovascular Diseases (Kemerovo)
and the Tyumen Cardiology Research Center (Tyumen).
The study was conducted in
accordance with the principles of the Declaration of Helsinki and was approved
by the local ethics committee of the Research Institute for Complex Issues of
Cardiovascular Diseases (Protocol No. 2022/06, dated June 30, 2022, Kemerovo,
Russia). All participants provided written informed consent prior to inclusion
in the study.
During data annotation, 11,771
images were reviewed, with relevant objects detected in 6,157 images. Data
annotation was performed by four specialists with medical degrees and more than
two years of experience in OCT imaging. The segmentation accuracy criterion was
based on the ability to differentiate lipid cores, which cause signal
attenuation in OCT, from fibrous tissue. In cases of disagreement, the final
decision was made by an expert physician with more than 10 years of OCT
experience, who also served as an independent validator to confirm the
correctness of the annotations. It is worth noting that only 1 class, Lumen,
was annotated on 2349 images. This class has a numerical advantage over the
others because it is present in every image and also has more pronounced
qualitative features. A detailed view of the class distribution can be found in
«Fig. 1». As a consequence, it was decided to exclude these images from the
training sample in order to achieve a more balanced training set. This
annotated dataset was divided into two parts in a ratio of 80% to 20%,
representing the training and test sets respectively. This division was done on
a patient-by-patient basis to provide a more accurate evaluation of the
proposed method. In order to consolidate the obtained quality indicators, it
was decided to perform a cross validation [10] of the models. As a result, 5
non-overlapping samples were constructed according to the scheme «Fig. 2»,
where the division was performed on a patient-by-patient basis to ensure that
data from the same patient did not appear in both training and test sets.

Fig.1. Analysis object allocation
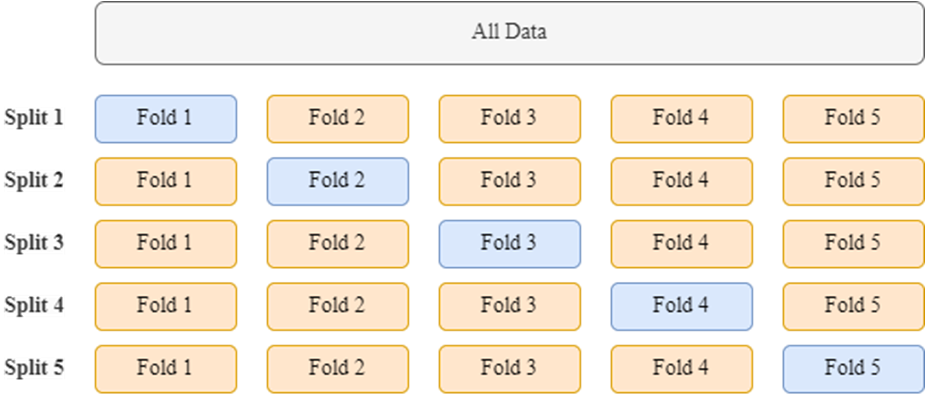
Fig. 2. Data configuration scheme for cross validation
It's also worth noting that each
original image has undergone the following changes:
1. Removing the area of the image
that does not include the analysis area
2. Bringing the obtained image to
the size of 1024*1024 pixels
An example of an input image and
annotation is shown in «Fig. 3». The annotation includes four objects of study:
• Lumen (LM): This parameter of the
vascular lumen is crucial for assessing the degree of stenosis and blood flow,
which is vital for diagnosing the patient's condition. Marked in magenta.
• Fibrous cap (FC): This involves
evaluating the presence and thickness of the fibrous cap, an area of the plaque
with increased connective tissue density. The thickness of the fibrous cap is
associated with plaque stability, making its analysis important for predicting
the risk of rupture. Marked in blue.
• Lipid core (LC): This involves
identifying and characterizing the lipid core within the plaque, an area with a
high content of fat deposits. The lipid core serves as an important marker for
evaluating the level of atherosclerotic activity and the likelihood of plaque
rupture. Marked in green.
• Vasa vasorum (VV): This process
includes recognizing the blood vessels that enter the arterial wall and provide
it with nutrients. The existence and arrangement of vasa vasorum are linked to
inflammation and can act as markers for evaluating the level of plaque
inflammation. Marked in red.
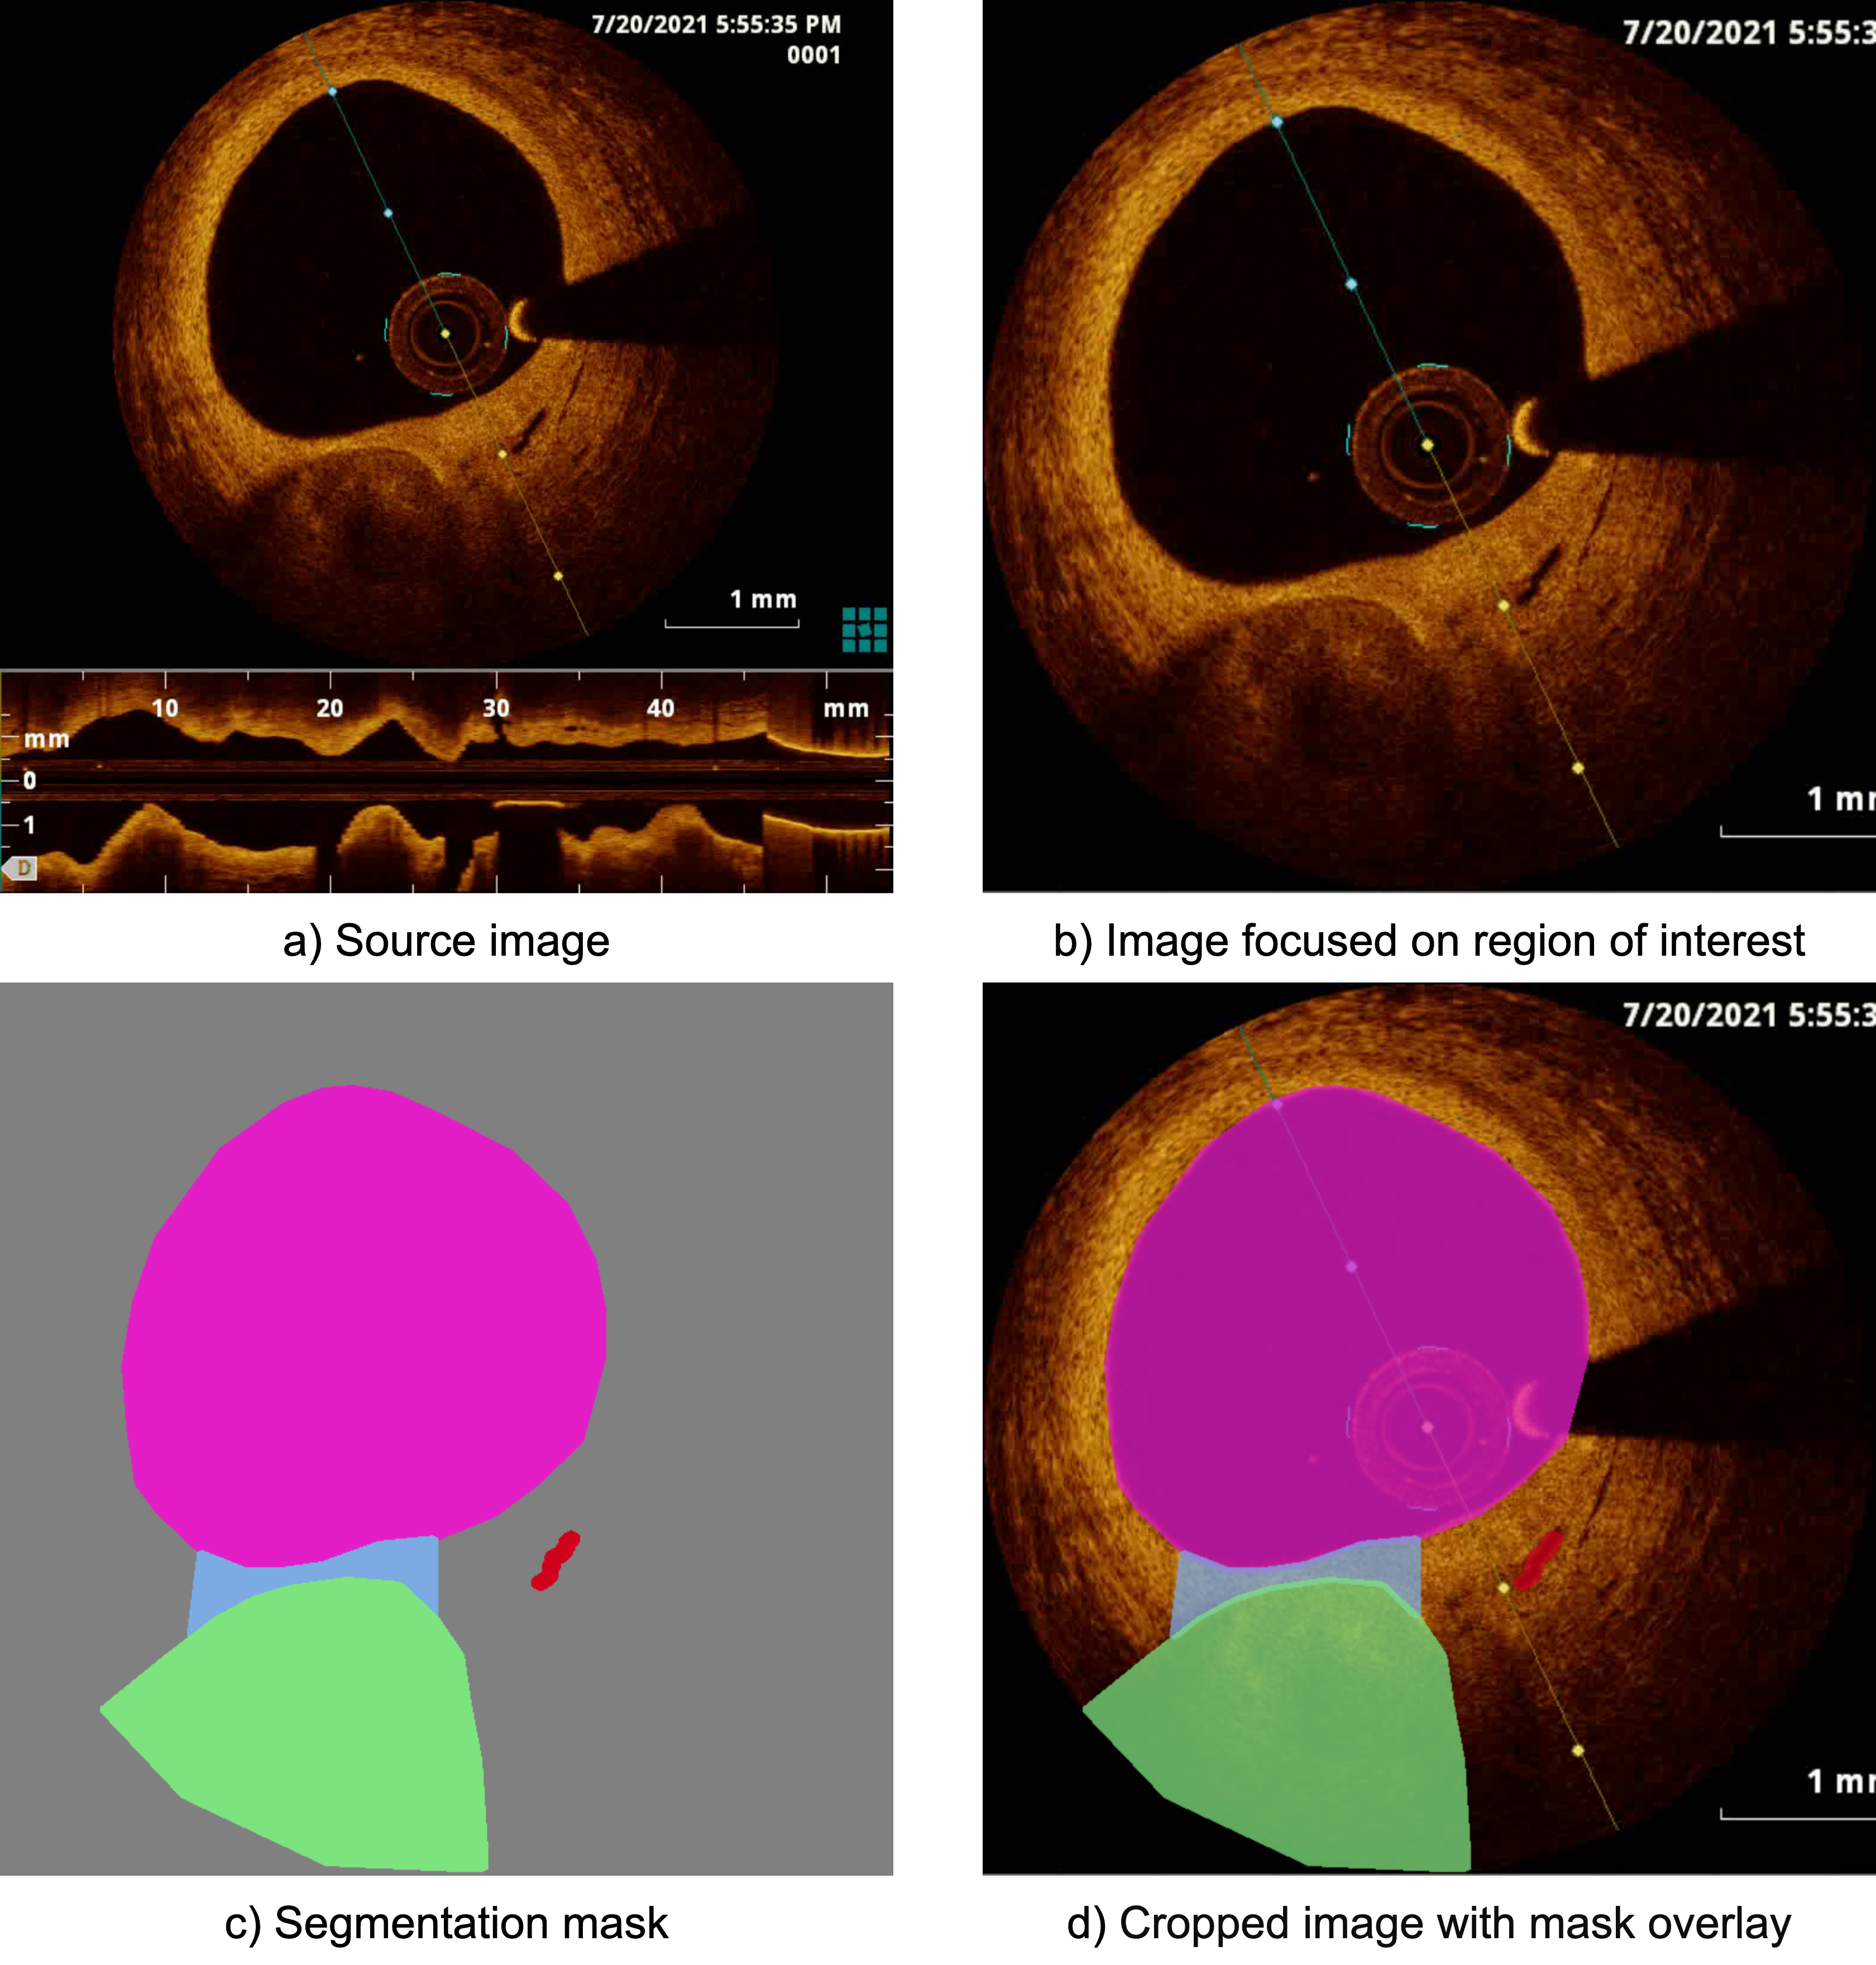
Fig. 3. Example of input data
The segmentation task is an active research
area in computer vision, and researchers continue to develop new methods and
approaches to improve the quality and efficiency of image segmentation. One of
the most popular methods for the image segmentation task is the use of
convolutional neural networks (CNNs). These networks can automatically extract
features from an image and determine the boundaries and contours of objects.
To segment the four classes in optical
coherence tomography (OCT), we trained three popular neural network
architectures: U-Net [11], MA-Net [12] and DeepLabV3+ [13]. Each neural network
was trained for 175 epochs to ensure optimal convergence. To standardize
training conditions, we used the ResNet-50 model as the encoder and a batch
size of 8 images for all networks. Note that we utilized transfer learning to
achieve early convergence [14]. The Adam optimizer with a learning rate of
0.0001 was used for optimization. The training process aimed to maximize
segmentation accuracy, focusing on the Dice Similarity Coefficient. The
DSC-based loss function is calculated as follows:
|

|
(1)
|
where
 and
and
 are the ground truth and predicted values, respectively, and
 is a
constant (set to 10-7 in this study) to ensure numerical stability
and prevent division by zero errors.
is a
constant (set to 10-7 in this study) to ensure numerical stability
and prevent division by zero errors.
We conducted three series of model training:
1. Training on all classes using the entire annotated dataset.
2. Training
on the Lumen, Fibrous cap, and Lipid core classes using only images where two
or more classes are present.
3. Training
for detecting the single class, Vasa vasorum.
Training a separate model to detect the vasa
vasorum class is due to its minimal presence in the sample. The presence of the
class in the number of 194 instances represents too low a value with respect to
the other classes of the analysis and creates an imbalance.
During model training, we utilized a set of
augmentation transformations from the “Albumentations” library [15]. These
augmentations expanded the dataset and served as a regularization technique to
reduce overfitting. In a series of experiments, we have found that all kinds of
geometric changes have a positive effect. Other changes, such as: contrast,
saturation, noise overlap, etc., have a negative effect. If the impact is
strong, they have a negative impact. As a consequence, their strength and
frequency of use take low values.
Training and testing of the network were
conducted using server hardware with a 16-core Intel Xeon Gold 6326 CPU @ 2.90
GHz, 128 GB of RAM, and an Nvidia A100 GPU with 40 GB of video memory. PyTorch
v2.1 and Python v3.12 were used as the main machine learning framework and
language for network development, respectively. It is also worth noting that
the following frameworks were of key importance in training machine learning
models: Torch Segmentation Models, PyTorch Lightning.
A comprehensive analysis covering 175 epochs
allowed us to trace trends in loss and Dice ratio over time for each model «Fig.
4». Overall, our findings revealed a consistent pattern across all models,
showcasing a gradual decrease in loss and a corresponding increase in Dice
coefficient throughout the training process. These trends signify the models’
capacity to learn and enhance their segmentation capabilities as training
progresses. However, it is essential to note the variations in the rate and
stability of convergence observed among the different models.
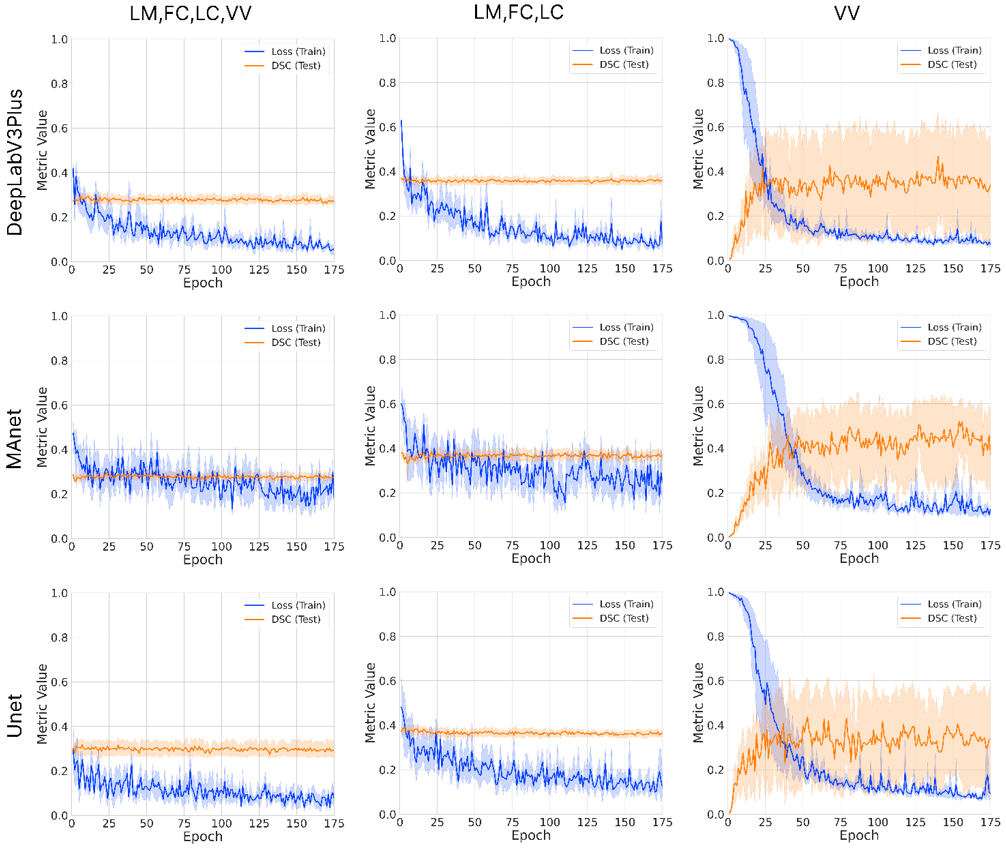
Fig. 4. Comparative analysis of loss and DSC evolution
during training and testing phases over 5-fold cross-validation with 95%
confidence interval.
Having carried out
a detailed analysis of the indicators obtained as a result of training the
artificial neural network models, we confirmed our assumption about the necessity
of excluding single-class images for the purpose of data balancing. As
anticipated, this experiment yielded improved metrics for the Lumen, Fibrous
cap, and Lipid core classes. The highest DSC on the test sample was
0.721-0.749, achieved by DeepLabV3+. The best DSC for the Vasa vasorum class on
the test sample was 0.719-0.745, achieved by the MA-Net architecture. Detailed
learning outcomes are summarized in Table 1.
It is worth noting
that the computational efficiency of the proposed cascade approach remains
acceptable for practical deployment. DeepLabV3+ processes a single frame in 18
ms, MA-Net in 25 ms, and U-Net 21 ms on an Nvidia A100 GPU. Complete processing
of one OCT volume takes approximately 9.86 seconds, with peak memory usage of
9.8 GB for the cascade architecture. These metrics demonstrate that the
proposed method can be integrated into clinical workflows without significant
computational overhead.
Table 1.
Experimental results for training segmentation models. The results are averaged
over splits
|
Model
|
Classes
|
DSC
|
Precision
|
Recall
|
Parameters, M
|
FLOPS, G
|
|
DeepLabV3+
|
LM, FC, LC, VV
|
0.512±0.018
|
0.486±0.022
|
0.630±0.015
|
26.7
|
36.9
|
|
LM, FC, LC
|
0.721±0.028
|
0.683±0.019
|
0.849±0.017
|
|
VV
|
0.676±0.025
|
0.656±0.028
|
0.849±0.012
|
|
MA-Net
|
LM, FC, LC, VV
|
0.497±0.023
|
0.531±0.026
|
0.596±0.021
|
147.4
|
74.8
|
|
LM, FC, LC
|
0.654±0.020
|
0.646±0.024
|
0.736±0.019
|
|
VV
|
0.745±0.016
|
0.612±0.031
|
0.794±0.020
|
|
U-Net
|
LM, FC, LC, VV
|
0.471±0.016
|
0.703±0.020
|
0.800±0.018
|
32.5
|
42.8
|
|
LM, FC, LC
|
0.700±0.019
|
0.735±0.017
|
0.871±0.014
|
|
VV
|
0.726±0.021
|
0.701±0.023
|
0.841±0.016
|
To assess the
statistical significance of the performance differences between the cascade
approach and the standard multi-class segmentation, we performed a Wilcoxon signed-rank
test on the DSC values obtained across the five cross-validation folds. The
cascade approach (mean DSC = 0.747 ± 0.013) demonstrated a statistically
significant improvement over the single DeepLabV3+ multi-class model (mean DSC
= 0.512 ± 0.018), with a p-value < 0.001. This confirms that the observed
performance gain is not due to random variation and represents a substantial
improvement in segmentation quality, with an absolute difference of 0.235
(45.9% relative improvement).
To evaluate the robustness of the proposed
cascade approach across different imaging sources, we analyzed the segmentation
performance separately for each acquisition center and device type. Table 2
presents the DSC scores obtained on test samples from each source. The cascade
approach demonstrated consistent performance across both centers and devices,
with mean DSC values of 0.741 ± 0.019 for St. Jude Medical devices (Kemerovo)
and 0.753 ± 0.016 for LightLab Imaging devices (Tyumen).
Table 2.
Performance of cascade approach by imaging source
|
Device
|
DSC
|
95%
CI
|
Precision
|
Recall
|
|
St. Jude Medical
|
0.741
|
±0.019
|
0.653±0.024
|
0.815±0.021
|
|
LightLab Imaging
|
0.753
|
±0.016
|
0.647±0.021
|
0.823±0.017
|
To visually
evaluate the generalization ability of the semantic segmentation models, we
compare their predictions in «Fig. 5». The results depicted in the figure
illustrate the outcomes of applying two different methods to analyze three
patients from the test set. These images serve as benchmarks for accurately
representing the objects under analysis. These particular examples were
selected as representative cases because they contain all analyzed classes,
including lipid cores of varying thickness, fibrous caps, and vasa vasorum,
allowing for comprehensive evaluation of segmentation quality for each class. The
data all experiments presented suggests that utilizing a cascade approach is
superior for analyzing coronary OCT images. The masks obtained from this
analysis are thorough and do not have any visible gaps, offering a more
detailed depiction of the objects being studied.

Fig. 5. Comparison of two
approaches in the analysis of OCT images from three patients. Column (a)
contains the input images, while column (b) presents the expert annotations.
Column (c) shows the results of semantic segmentation using the classical
approach, which predicts all four analyzed classes with a single DeepLabV3+
model that achieved the highest score. Column (d) displays the results of the
cascade approach, using DeepLabV3+ for the Lumen, Fibrous cap, and Lipid core
classes, and MA-Net for the Vasa vasorum class.
While our study demonstrates the effectiveness of the cascade
approach for OCT image segmentation, several limitations should be
acknowledged. Although our dataset includes scans from two different centers
and two device manufacturers (St. Jude Medical and LightLab Imaging), providing
a certain degree of technical variability, we did not perform a full external
validation with strict leave-one-center-out or leave-one-device-out analysis.
The analysis presented in Table 2 shows consistent performance across both
sources, suggesting good generalization. Future studies should include
prospective validation on data from additional centers and newer OCT devices to
fully establish the clinical applicability and robustness of the proposed
method. It is also worth noting that, while computational efficiency is
acceptable for clinical deployment, further optimization could improve
real-time processing capabilities for intraoperative use.
Our
study demonstrated the feasibility of applying machine learning to the analysis
of medical images, specifically coronary OCT images. The conducted
cross-validation analysis of neural network models for semantic segmentation
confirmed the effectiveness of the chosen architectures in detecting
significant, rupture-prone coronary lesions. An important outcome was the use
of a cascade approach to data analysis due to the identified imbalance in class
distribution. Based on the conducted analysis, the combination of DeepLabV3+
and MA-Net models stands out as the most promising solution, achieving a final
DSC score of 0.747, which is 0.235 higher than the score obtained using the
standard multi-class semantic segmentation model. The obtained data and
developed analysis methodologies can be utilized to create more efficient
diagnostic and monitoring systems for atherosclerosis, thereby improving the
accuracy and reliability of medical research and practical applications in
cardiology.
«The study was funded by a grant from the Russian Science Foundation № 23-75-10009, https://rscf.ru/project/23-75-10009/».
1. F. Zibaeenejad, S.S. Mohammadi, M. Sayadi, F. Safari, M.J. Zibaeenezhad, Ten-year atherosclerosis cardiovascular disease (ASCVD) risk score and its components among an Iranian population: a cohort-based cross-sectional study, BMC Cardiovasc Disord 22 (2022) 162. https://doi.org/10.1186/s12872-022-02601-0.
2. Muller JE, Tofler GH, Stone PH. Circadian variation and triggers of onset of acute cardiovascular disease. Circulation 1989;79:733–43.
3. J.F. Bentzon, F. Otsuka, R. Virmani, E. Falk, Mechanisms of Plaque Formation and Rupture, Circ Res 114 (2014) 1852–1866. https://doi.org/10.1161/CIRCRESAHA.114.302721.
4. Alsheikh-Ali AA. The Vulnerable Atherosclerotic Plaque: Scope of the Literature. Ann Intern Med 2010;153:387. https://doi.org/10.7326/0003-4819-153-6-201009210-00272.
5. Danilov V V., Klyshnikov KYu, Gerget OM, Skirnevsky IP, Kutikhin AG, Shilov AA, et al. Aortography Keypoint Tracking for Transcatheter Aortic Valve Implantation Based on Multi-Task Learning. Front Cardiovasc Med 2021;8:697737. https://doi.org/10.3389/fcvm.2021.697737.
6. Shi F, Wang J, Shi J, Wu Z, Wang Q, Tang Z, et al. Review of Artificial Intelligence Techniques in Imaging Data Acquisition, Segmentation, and Diagnosis for COVID-19. IEEE Rev Biomed Eng 2021;14:4–15. https://doi.org/10.1109/RBME.2020.2987975.
7. Qaiser T, Tsang Y-W, Taniyama D, Sakamoto N, Nakane K, Epstein D, et al. Fast and accurate tumor segmentation of histology images using persistent homology and deep convolutional features. Med Image Anal 2019;55:1–14. https://doi.org/10.1016/j.media.2019.03.014.
8. Laptev VV, Danilov VV, Ovcharenko EA, Klyshnikov KY, Arnt AA, Kolesnikov AY, Bessonov IS, Litviniuk NV, Kochergin NA. Segmentation of Structural Components of Atherosclerotic Plaques on OCT Images Using Deep Machine Learning. Kardiologiia. 2025 Oct 23;65(9):45-55. Russian, English. https://doi: 10.18087/cardio.2025.9.n2932. PMID: 41129250
9. Laptev VV, Kochergin NA. Application of Modern Object Tracking Technologies to the Task of Aortography Key Point Detection in Transcatheter Aortic Valve Implantation. Scientific Visualization 2024;16:106–15. https://doi.org/10.26583/sv.16.2.09.
10. Berrar D. et al. Cross-validation. – 2019.
11. Ronneberger O, Fischer P, Brox T. U-Net: Convolutional Networks for Biomedical Image Segmentation. Medical Image Computing and Computer-Assisted Intervention – MICCAI 2015. MICCAI 2015. Lecture Notes in Computer Science, Springer; 2015, p. 234–41. https://doi.org/10.1007/978-3-319-24574-4_28.
12. Fan T, Wang G, Li Y, Wang H. MA-Net: A Multi-Scale Attention Network for Liver and Tumor Segmentation. IEEE Access 2020;8:179656–65. https://doi.org/10.1109/ACCESS.2020.3025372.
13. Chen L-C, Zhu Y, Papandreou G, Schroff F, Adam H. Encoder-Decoder with Atrous Separable Convolution for Semantic Image Segmentation. Lecture Notes in Computer Science (including subseries Lecture Notes in Artificial Intelligence and Lecture Notes in Bioinformatics), vol. 11211 LNCS, Springer Verlag; 2018, p. 833–51. https://doi.org/10.1007/978-3-030-01234-2_49.
14. Weiss K, Khoshgoftaar TM, Wang D. A survey of transfer learning. J Big Data 2016;3:9. https://doi.org/10.1186/s40537-016-0043-6.
15. Buslaev A, Iglovikov VI, Khvedchenya E, Parinov A, Druzhinin M, Kalinin AA. Albumentations: Fast and Flexible Image Augmentations. Information 2020;11:125. https://doi.org/10.3390/info11020125.