Information design has become
substantial to process the unprocessed stack of data and information unbridled
by Information and Communication Technology (ICT). That is why the modern
education system should develop skills and knowledge in students to use
information more efficiently and effectively. ICT should provide a more active
role to explore, comprehend and interpret the use of information rather than
just acquiring the knowledge. In line with this, one of the methods to improve
the ability of students to understand and interpret information is through
infographics [1].
Infographic is an
abbreviation for 'Information Graphics' that is aimed to disseminate data in a
way that connects the reader to the information. The interactive infographic
has become an important tool in demonstrating or presenting complex data in the
simplest form. It is mainly a combination of elements of data visualization and
has become an easy way of disseminating data throughout the world. It helps to
demonstrate large data to a heterogenous audience. It constructs a pictorial
view of the data. Due to the large aesthetical contribution to the data
visualization, the researchers seem to be interested in studying this
particular relationship [2]. The objective of infographics is to develop the
ability of students to see connections and events between them in new and
different ways and to uncover other invisible patterns [3].
Nowadays, infographics have
become one of the trends in context with learning approaches to the
visualization of knowledge by showing its visual form [4]. Infographics include
several forms of interactive media, such as; charts, images, sketches, and
text. In line with this, a study by Kordaki and Gousiou reflected the idea
through digital card games that it is highly popular in various regions [5].
The games serve as a combination of audio and visual images providing relevant
instructions that are highly impactful for students acquiring primary
education. The technical perspectives are now a realm of users, who configure
systems, rather than the realm of software engineers [6]. Similarly, Wuang et
al [7]. further illustrated that graphical learning is highly effective in
various training programs due to the increased effectiveness of knowledge that
is transferred through visual images. This; however, reduced the possibility of
missing information, since knowledge is transferred through concept-based maps
[8]. Another study was carried out by Hernández-Sellés et al [9].
highlighted that student feel less interactive and often get frustrated due to
unattractive teaching patterns. One approach for enhancing student performance
and motivation is to adapt teaching ways for fulfilling the varied learning
style preferences of undergraduates. Learning style preferences are the
approach in which learners perceive, process, store, and recall efficiently and
effectively attempt to learn. Eye tracking is the most efficient way of
learning large content. The whole procedure is less time-consuming. Human
memory prefers more realistic content than abstract content. Integration of
text and pictorial sources with the help of their similarities is optimum for
effective learning [10].
Despite the literature defining the advantages of the aesthetics
related to the infographic, it is still widely unknown how aesthetic impressions
are formulated, and how can these impressions be made appealing [2]. Apart from
it, little is known regarding the advantages associated with the design
portfolios of infographics [7]. Infographics are influencing almost every
aspect of life, from journalism to education, all the fields of life are being
subjected to the rapid growth of information graphics [11]. In addition,
concept maps are largely used as a valuable form of infographics to provide a
clear picture of the information. The concept maps help the participant to
understand the test and to elaborate on the results. Moreover, there is less
literature present as to how to take advantage of these design portfolios [7].
Despite all the prevailing literature about the use of new technologies in the
field of education, very little research has been carried out on the design and
implementation of infographics.
There is a need to analyze eye-movement measures (patterns of
viewing and map/text fixation, and participants’ performance on verbal and visual
tests) that facilitate the
examination of the
multimedia theory and cognitive processing to assert the map’s dominant
effectiveness toward learning. The interest of the present study is on
subjects' fixation on Minard’s map and the corresponding text in terms of count
and duration within a multimedia framework by considering human responses on
the
Visual Verbal Learning Style Rating (VVLSR)
to
understand the undercurrents of visual literacy.
Fixation time is determined by
an individual's viewing habits, which also determines how difficult it is to
interpret the context. However, in most cases of visual performance longer
durations indicated a high level of understanding of users.
The present study aims to evaluate computer interactions and the
usability of infographics by analyzing individual performance through viewing
patterns. A cohort of literature present on the following topic will be
evaluated to gain insight into the following topic. As discussed earlier, an
infographic is emerging as a strong tool for disseminating information among a
large group of people for better understanding. Moreover, the graphical touch
enables the reader to remember the information for a long time. The study
signifies the identification of eye movement in terms of observing patterns of
visualizing the map and text, the enhanced interest of the learner, and the
subject's participation in verbal and visual aspects. It explains the pattern
of how the participants sought to examine Minard’s map along with the text. In
this study, verbal and visual has been conducted on 62 participants. A video
was demonstrated to each participant based on that video a multiple-choice test
was given to each participant and concept maps were used to help the
participant for a better understanding of the test and to achieve an explained
result. The research questions addressed in this study are as follows;
Q1.
Do participants who classify themselves as verbal or visual
learners differ in terms of relative patterns of fixation on the map versus the
text?
Infographics can be described as a tool for the spread of
information through several platforms, such as; broadcasting or social media [12].
Several studies indicate that a combination of pictures and text encourages
learning and deepens comprehension and problem-solving procedures. For
instance, a combination of pictures and text help in achieving effective
learning consequences rather than alone [13-14]. On the contrary, learning
outcomes cannot be simply improved by just combining pictures and text. The
efficiency of this combination is majorly reliant on attributes such as the
visualization form, the number of referential connections, and the type of
learning task between pictures and text, as well as the personal attributes of
the learner [15]. Therefore, learning accomplishments vary in terms of
individual differences including spatial ability, cognitive style, and previous
knowledge. Verbal for verbal or auditory representations and visual for visual
or pictorial representations are the channels used for multimedia learning
individual’s process information [16].
The structure of working memory is further reflected through
verbal and visual processing. The abilities of visual and verbal constituents
of working memory are confined, varying majorly based on individual differences
including intelligence, and are majorly associated with cognitive load linked
by an individual [17]. Some studies have indicated that cognitive style and
working memory capacity are majorly associated. The effect on the learning
process might be because of the visualizer-verbalizer cognitive style.
Visualizers accomplish effectively when learning from pictures and text and
gain assistance from pictorial information whereas verbalizers depend
additionally on text. Furthermore, text-picture combinations are advantageous
to visualizers, while circumstances offer merely textual information resulting
in better outcomes for verbalizers [18]. These outcomes can stimulate the
assumptions proposed and also recommend that visualizers might be effective to
implement information represented in both platforms demonstrated in the
cognitive theory of multimedia learning [18].
This study used eye tracking technology and visual/verbal learning
style to support the results we used heat maps. clusters and scan plots.
Tobii X120 were used to gather the data and Tobii
Studio was used for the collection of data. This software facilitated the
researcher's recording of tests, the visualization of eye-tracking data, the
creation and management of AOI, and the calculation of eye-tracking metrics.
Automated visualization of the data has been examined in the form of scan paths
and heat maps or clusters.
A total of 62 female undergraduate participants were selected for
the study. The native language of the participants was Arabic; therefore, the
information was given in Arabic to the subjects. No compensation was given to
the subjects as a reward for participating in the study. The selection of
female students was based on cultural restrictions imposed within the country
and; thus, was allowed to survey female undergraduate students only.
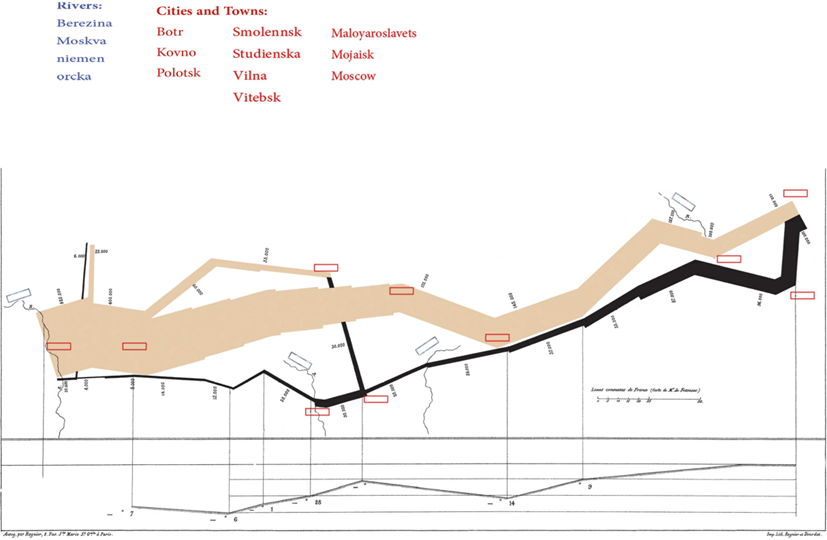
A video based on fourteen slides regarding Napoleon's march to
Moscow was shown to the participants in Arabic translations. The text consisted
of the main historical events that took place at that time, especially, the
name of cities, the number of men, the name of rivers, dates, and temperatures.
A modified text was given on a portion of every slide of Minard’s map of
Napoleon's march to Moscow. The first slide was welcome, the second slide
demonstrated some background information and the remaining 11 slides displayed
similar portions of the text beneath Minard’s map. The slides were converted to
JPEG format.
After viewing all the slides, the participants passed a verbal
test. The test was aimed to investigate the recall of information in the text
portion of the materials. 20 multiple-choice questions were involved in the
verbal test. To check the consistency of the test internal reliability method
is used. The internal reliability assesses the reliability of the stigma mechanism
scales and stigma source subscales [19]. The internal reliability of the verbal
test was 0.42.
A total of 19 items were included in the visual test to recall
participants’ information regarding four rivers and 10 cities on the map. The
test also aimed to investigate the ability of the participants to effectively
select the correct graph. Moreover, they were asked to choose the best shape
corresponding to several geographical elements. The internal reliability of the
visual test was 0.53.
The Participants classified their visual or verbal skills with the
Verbal-Visual Learning Style Rating. The style rating includes 1 question with
7, Likert-scale, options. The 7 options were: moderately more verbal than
visual, strongly more verbal than visual, equally verbal and visual, slightly
more verbal than visual, moderately more visual than verbal, slightly more
visual than verbal, and strongly more visual than verbal.
Tobii X120 Eye Tracker was used to determine and count the eye
movements of the participants. Tobii Studio software was used to analyze and
collect the data gathered from X120 Eye Trackers. Two usability labs were used
to carry out the study, one lab consisted of the eye tracker and the other lab
consisted of the verbal and visual performance tests. Demographic information
was obtained from the participants and informed consent was also signed by the
participants. The participants were made to sit at a fixed distance between
themselves and the monitor, on separate chairs. The distance was approximately
70 cm and eye calibration were also carried out. The participants were
restricted to make any movements. Eye-tracking calibration was established and
saved before individual participants’ exposure to instruction with the software
configuration tool. Measurements for the monitor and eye tracker were entered
concerning the surface. After completing 11 slides, the participants were moved
to the second room where the verbal and visual tests were carried out.
Further, data analysis was carried out with Statistical Package of
Social Sciences version 23.0 (SPSS), and descriptive statistical analysis using
standard deviation, mean averages, etc. were carried out to test the effect of
eye trackers on the verbal-visual learning of participants. Pearson’s r was
used to determine the direction and strength of the relationship between the
fixation and performance test.
The participants were divided into 4 categories; pre-dominant
verbal learning, pre-dominant visual learning, only visual and only verbal. All
participants were tested on both verbal-visual learning conditions. Most of the
participants were placed in a visual group based on their answers. The verbal
group consisted of participants who rated themselves as moderately or slightly
verbal. Lastly, the most visual group consisted of participants who rated
themselves as strongly visual. The test scores by learning style group are
demonstrated in Tab. 1, predicting the descriptive analysis.
Tab. 1.
Descriptive Statistics for Verbal Performance Test Scores and
Verbal-Visual Learning Style Rating Survey
|
Style Group
|
N
|
Mean
|
Standard Deviation
|
|
Pre-Dominant Verbal Learning
|
11
|
8.18
|
2.09
|
|
Only Visual
|
27
|
9.26
|
2.89
|
|
Pre-Dominant Visual Learning
Only Verbal
|
24
0
|
8.36
0
|
2.70
0
|
|
Total
|
62
|
8.73
|
2.69
|
The visual performance test scores of the participants by learning
style group have been suggested in Tab. 2, predicting the descriptive
statistics. Pre-dominant verbal learning scored 4.91
±2.30, visually scored 6.63
±2.83 and pre-dominant visual learning scored 4.38 ±4.64 with a total of 5.45
±2.53.
Tab. 2.
Descriptive Statistics for Visual Performance Test Scores and
Verbal-Visual Learning Style Rating Survey
|
VVLSR
|
N
|
Mean
|
Standard Deviation
|
|
Pre-Dominant Verbal learning
|
11
|
4.91
|
2.30
|
|
Only Visual
|
27
|
6.63
|
2.83
|
|
Per-Dominant Visual Learning
Only Verbal
|
24
0
|
4.38
0
|
1.64
0
|
|
Total
|
62
|
5.45
|
2.53
|
To compare the performance scores on the verbal test of
participants among the three groups, one-way ANOVA was conducted. The value of
alpha was set at 0.05 to meet the assumptions for both ANOVA tests. For both
verbal tests, the homogeneity of variance assumption was confirmed with
a p<-value
of 0.420. For visual ANOVA, the
p<-value was found to be 0.745 through
Levene’s test.
Each participant was individually tested; therefore, the
independence of the sample was a reasonable assumption. On the other hand, a
positive but insignificant impact of learning style was found concerning the
verbal test F (2.59) = 0.957 (p<-value = 0.390). Moreover, the
differences between the three groups were also tested through one-way ANOVA
which also addressed the visual scores. Thus, results suggested a significant
impact of learning style on the visual test F (2.59) = 6.26 (p<-value =
0.003). Due to the significance of the results, the Tukey hoc test was also
computed. The results suggested that the performance of the group in the visual
test was better compared to its counterparts (p<-value = 0.003). However,
none of the other pairings was found to be statistically significant.
A Bonferroni adjustment was made to maintain an overall alpha of
0.05 for the eight tests. Each test was conducted with an alpha of 0.006. Tab.
3 shows the strongest relationship between text duration and verbal score (r =
0.543). In general, the verbal score had slightly stronger correlations than
the visual for all the fixation measurements.
Tab. 3.
Correlations Between Fixation Measures and Verbal/Visual
Performance Scores
|
|
n
|
Performance
|
|
|
Map
Fixations
|
62
|
0.480*
|
0.347*
|
|
Map
Duration
|
62
|
0.454*
|
0.414*
|
|
Text
Fixations
|
62
|
0.543*
|
0.422*
|
|
Text
Fixation
|
62
|
.389*
|
.358*
|
Note.
* Correlation is significant at the adjusted .006 level
(2-tailed)
The preference of participants regarding the style of learning was
asked. The results showed that 51 participants favoured the visual learning
style, 6 preferred the verbal-visual learning style, and 5 preferred the verbal
learning style. The heat maps of five visual participants were compared to five
verbal participants to achieve some degree of parity. The total number of heat
maps was 51; thus, the selection of heat maps was carried out by choosing one
out of each 10 maps. Moreover, a combination of five visual and five verbal
heat maps was prepared respectively. Furthermore, the viewing patterns and
differences in the data sets were examined. Different colours were set in the
heat maps to demonstrate the information regarding the number of fixations and
the time a participant spent in an area of the image. The Color red illustrated
the highest number of fixations and green least number of fixations. Fig. 1
shows the heat maps which involve the combination of 11 slides for the
participants who rated their learning ability as verbal. On the other hand, Fig.
2 shows the combination of 11 slides of the participants who rated their
learning ability as visual.
There were variances in the viewing trends between the visual
learning style and verbal learning style participants. For verbal style
learners, the heat maps describe their use of the map on the first slide,
followed by a reduction in the use of the remaining slides. The use of maps was
shown by the visual-style learners in all 11 slides. The variation between the
two groups was very clear in slide 5. The use of maps was shown by both groups
on slide 11. On the contrary, the heat maps showed much greater use of the map
in slide 11. Greater use of the text was revealed in both visual and verbal
groups in all slides.
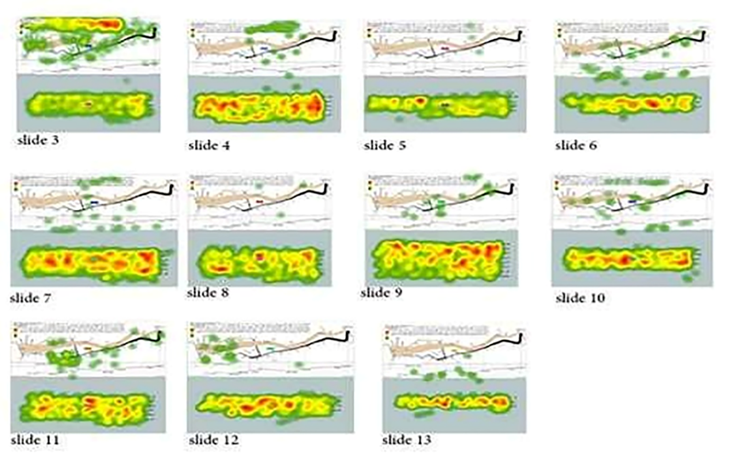
Fig. 1.
Heat maps to
represent the learning ability of the verbal learner
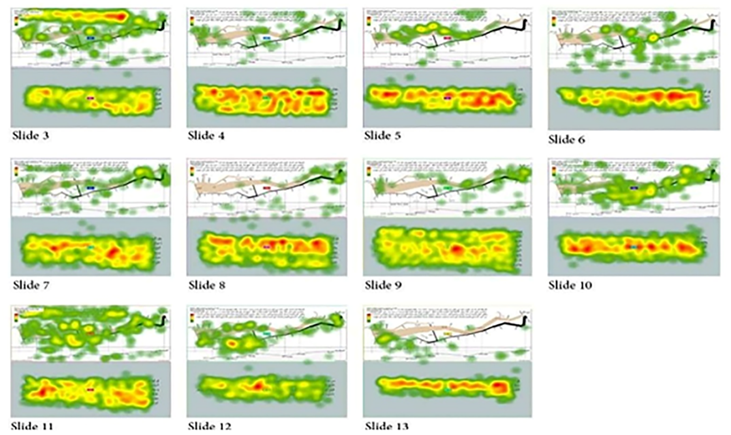
Fig. 2.
Heat maps of
participants who rate their learning ability as a visual learner
From Tobii Studio, visual heat
maps offered a promising visual representation of the variations between the
test scores of participants on the visual and verbal tests. All participants,
as per the heat maps explain that they read the text, irrespective of scoring
lower or higher on the visual or verbal tests. On the contrary, the use of the
map was demonstrated majorly with more intense heat on the map areas indicating
that the subjects used the map more in linkage with the text, and; thus, scored
high on both the visual and verbal tests. Thereby, the visual elements of the
map assisted the understanding the lesson. The heat maps indicated assertion to
demonstrate verbal and visual representations. The cognitive rationale was
provided to explain this outcome by determining that the learner creates
meaning by choosing, implementing, and organizing visual and verbal
representations in multimedia instruction.
Participants self-reported learning preferences were used to
identify significant differences in performance on the verbal and visual tasks.
The individual’s ratings of their visual abilities varied significantly. On the
other hand, there was no statistically significant difference. The continued
use of the map was another difference between the heat maps for reported visual
and verbal learners over the 11 slides within the multimedia instruction. The
heat map of verbal learners indicates merely a strong fixation on slide 3 in Minard’s
map. Fixation in both groups resulted in a similarly hot heat map on slide 11.
It was assumed that they were likely connected to the patterns associated with
the Berezina River in both the text and the map. Therefore, they all spent
greater time reading and comprehending the event. Nonetheless, the heat map
shows additional fixation for visual learners. The number of fixations on a
specific display aspect must emphasize the significance of that element.
Thereby, it is valuable to compare and contrast slide 11 with different heat
maps, scan paths, and clusters for the two learning style groups.
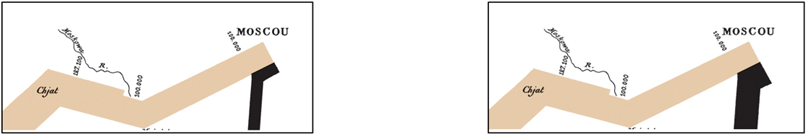
Visual heat maps from Tobii Studio provided a striking visual
representation of the differences between participants’ performance test scores
on the verbal and visual tests that were taken upon completion of the
instruction. Fig. 3 and 4 are heat maps that show participants’ scores on the
verbal and visual tests. Fig. 3 displays the low scores for the verbal test on
the left and the high scores on the right. Similarly, in Fig. 4, the low scores
are on the left, and the high score on the right for the visual test. Their
viewing behavior from slide 11 differed for the verbal-visual style learning
group (Fig. 5 and 6). The text utilized by both groups was almost the same. The
participants who scored low and high in both verbal and visual tests these
qualitative displays show the differences.
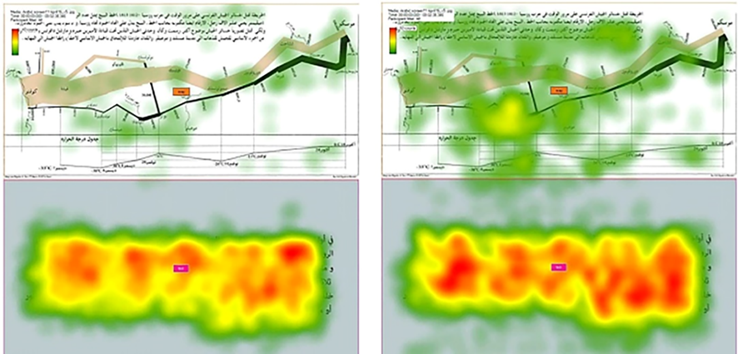
Fig. 3.
Lower scores (left) and higher scores (right) on the verbal test

Fig. 4.
Lower scores (left) and higher scores (right) on the visual test
The heat maps demonstrate that all participants read the text,
regardless of scoring high or low on the verbal and visual tests. However, the
more intense “heat” on the map areas, demonstrating greater use of the map,
clearly shows that the participants who used the map more in conjunction with
the text scored high on both the verbal and visual tests. Thus, when the visual
element (Minard’s graph) of the multimedia instruction was used, it aided
participants' understanding of the lesson (Napoleon's March on Moscow). The
heat maps reveal Mayer's assertion on integrating visual and verbal
representations. Mayer provided the cognitive rationale for explaining this
result; he determined that the learner constructs meaning by selecting, organizing,
and integrating verbal and visual representations in multimedia instruction.
Participants who rated their learning style as verbal did not look
at the map concerning the events related to the text underneath. The map has
almost no red spots and some random green dots that show less use of the map.
Participants who rated their learning style as visual seemed to follow the
events on the map while they were reading the story. The smaller corresponding
red and yellow colours on the map show how they looked at the area on the map
throughout their reading of the text. The reported visual learners examine the
map and text in such a corresponding way, it is possible to see almost one red
area on the map for every reference of it in the text.
The learning style was used to
discern by self-reported participants, more deeply, the verbal and visual tests
on performance scores concerning significant differences. The visual
performance test scores have significance differences that rated themselves as
Only Visual (n = 27) and Pre-Dominant Visual Learning (n=24). While the
statistical difference was not significant, the most visual group also
performed more poorly than the Pre-Dominant Verbal Learning (n=11) groups.
The heat maps that reported verbal and visual learners are another
difference over slide 11 the use of the continued by the assumed visual
learners throughout the instruction from multimedia. The heat maps of verbal
learners show strong fixation on the map of Minard’s on slide 3, the materials
of the first slide. The heat map on slide 11 resulted in a similar “Hot” by
both groups' fixation. The events related to the Berezina River in both the map
and the text were similarly attractive to them. Thus, they spent more time
reading and understanding the event. Still, visual learners show a more intense
fixation on the heat map. Therefore, it is important to compare and contrast
slide 11 with distinct heat maps, clusters, and scan paths for the two learning
style groups.
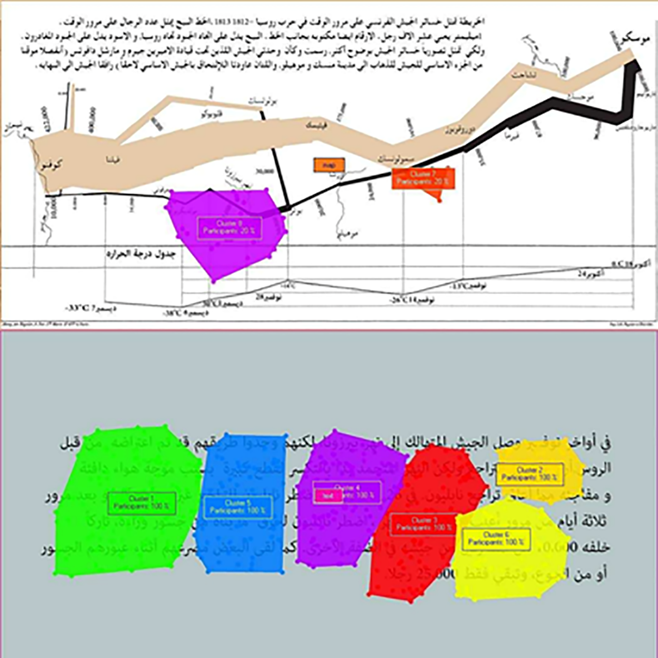
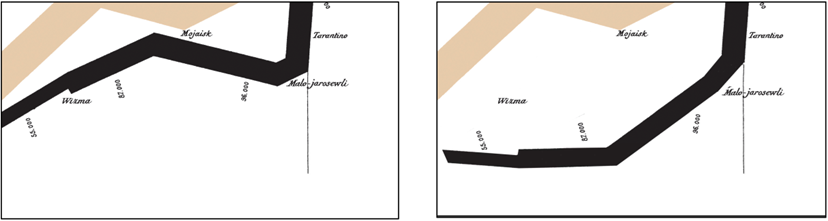
Fig. 5.
Verbal learners cluster for Slide 11
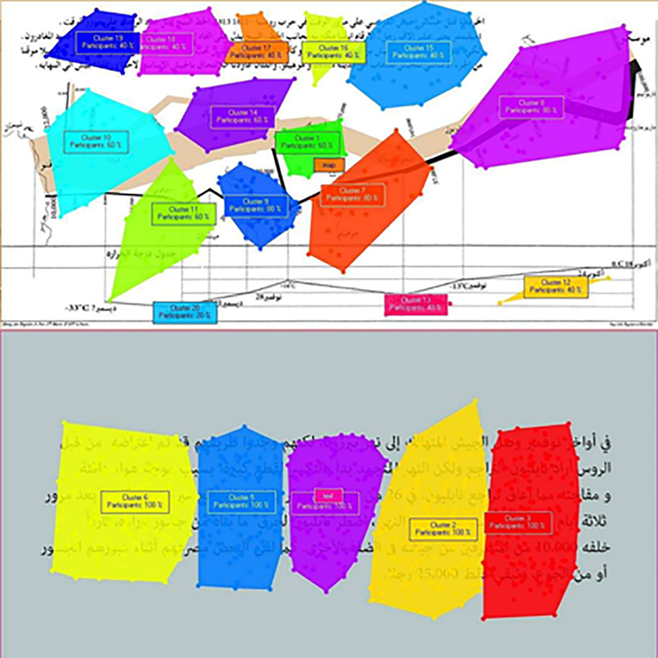
Fig. 6.
Visual learners cluster for Slide 11
Based on the scan paths (Fig. 7, 8), The scan paths clearly show
which element of the slide is noticed and in what order, the relative length
she viewed the various element of the screen that attracted her eye and
effectively revealing the order that the participants viewed. Some participants
still make multiple visits to the map to support their understanding.
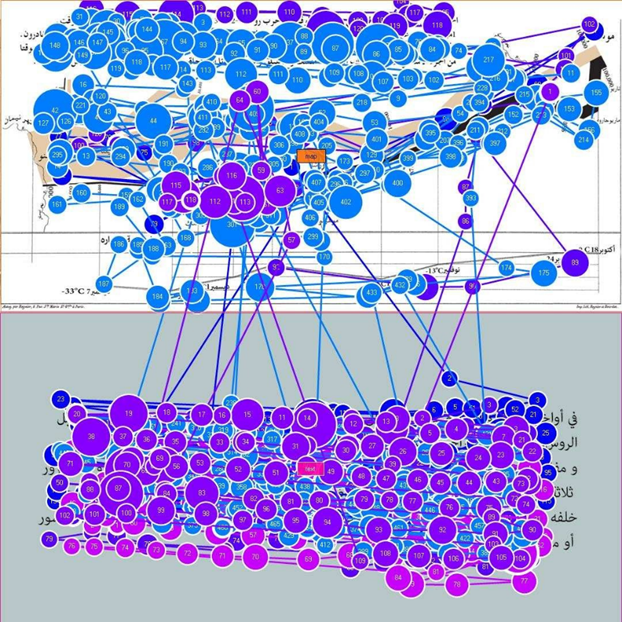
Fig. 7.
Verbal
learner scan path for slide 11.
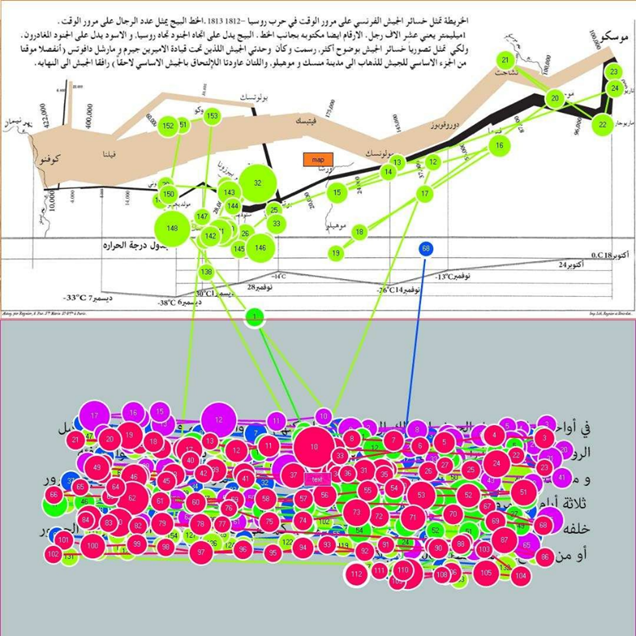
Fig. 8.
Visual
learner scan path for slide 11
The study found that visual
content is more engaging compared to listening or another form of content.
These findings have been consistent with the findings of previous studies. For
instance, Lazard and Atkinson reported that visual content holds significance;
thus, visual content is important for persuasive message processing [20].
Moreover, an infographic can be considered an important tool for carrying out
information related to environmental issues. Therefore, the study provided significant
results which can be used effectively by practitioners to utilize the
opportunities associated with visual content and infographic.
The findings are also in line with a study conducted by Bhandari [21],
stating that visual interpretation in mobile phone devices assists in reducing
task completion, and also it improves the efficiency of performance tasks. In
addition to this a study conducted by Baglama et al. [22] also reported results
that were consistent with the findings of the current study.
The current study results also demonstrated the importance of
using infographics in the field of education. The results showed that
infographics can effectively increase the efficiency and effectiveness of the
learning process. Moreover, the use of infographics can significantly overcome
the issues related to mathematical learning. The above finding is in line with
the findings of Murray et al. [23] as they reported the effectiveness of the
infographic. The results showed that the use of infographics enhances the
understanding of students and highlight the importance of infographics as it
can be noticed that more participants were preferring visualization over
verbalization. This also presented key points that must be noted before the
creation of an infographic. The study conducted by Naparin and Saad also
depicted that infographic can be effectively used in classrooms with a good
design aspect [24]. Moreover, the research predicted that the information
presented on the topic of infographics in the literature review can be
effectively utilized to understand the implementation of infographics in
education. It also concluded that the results can also be utilized for the
formulation of the infographic as instructional media. However, the infographic
was found to improve the effectiveness of lectures through the visual
representation of the video which in turn enhanced the understandability of
students. It also concludes that the adaption of infographics in the academic
environment should be considered.
Participants used the map in
less time than they used the text. Additionally, visualization tools all of
eye-tracking, including clusters, heat maps, and scan paths noted the use of
participant on the map. The scan paths cartoon strip-like series presents
participants’ dependence on the map for concepts of the text and vexing
vocabulary Fig. 9.
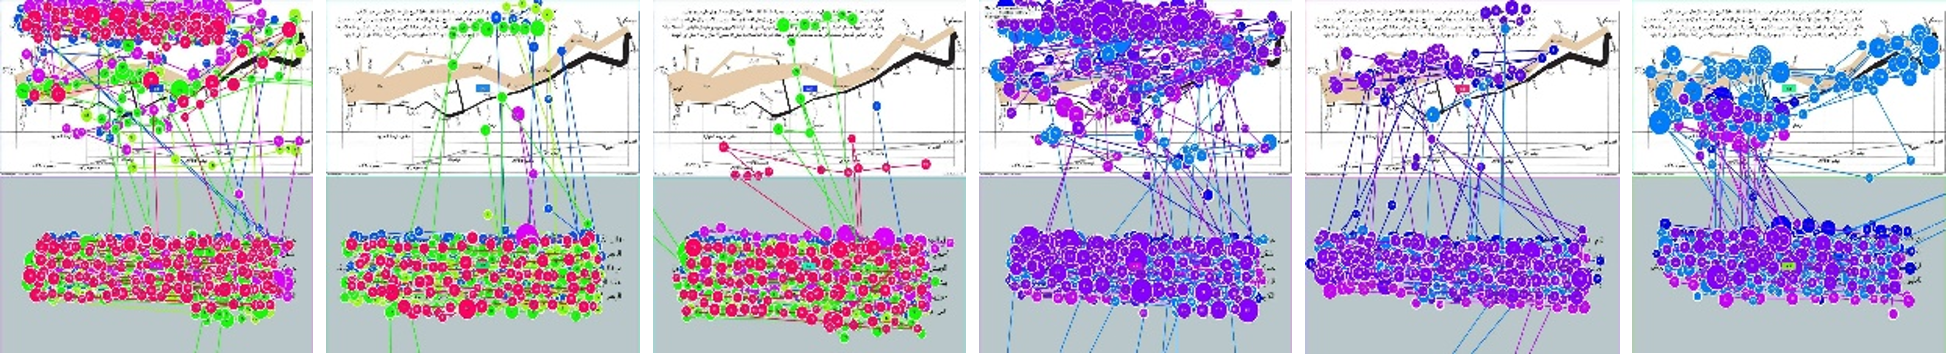
Fig. 9.
Sampling of scan plots demonstrating participants’ dependence
upon the map.
The sampling of scan plots
reveals participants several visit to the map throughout their reading of the
text to support their understanding. They refer to tended to the map,
frequently, when faced with challenging text or particularly unfamiliar.
Therefore, they not only depend upon the map as an aid in comprehending the
text there is good evidence, but the duration, shorter and fewer fixation count
also suggest that they prepared the visual information, more precisely.
According to Goldberg higher fixation count does not correlate in abroad sense,
with learner’s efficiency in viewing/searching, positively [25]. But
alternating eye fixations of participant on the map and the text declare the
tendency to combine the information in a multimedia learning environment when
the graphic(s) are detailed, not decorative Liu & Chuang [26].
Therefore, Tufte was correct
in identifying Minard’s map as exemplary as a complicated graphic narrative
that’s the evidence and that it was a good selection for incorporation into the
multimedia instruction for this study. The scan path visualization shows clear
signs of which elements of the slide were spotted and in what order,
effectively revealing the relative length she viewed various elements of the
screen that attracted her eye and the order in that participants viewed. The
longer fixation duration is the larger circle. The map indicates the rivers of
Studenska and Berezina likely new terms and unfamiliar vocabulary for
participants have the two largest circles. This participant, as well as common
participants, to identify the location of the rivers looked on the map upon
encountering the names in the text, by that making awaited use of the map. The
lines were revealed and noticed the direction of her connection and fixations
in her search for connections to the material in understanding. The scan path
shows the order and direction of her eyes and corresponding cognition, the
cognitive processing behaviors that learners experience when faced with new
knowledge were consistent with other previously mentioned. The concept of
integration is also reinforced by the scan path, the visual to comprehend
complex narrative or information with which they are not already acquainted are
a cognitive function of the learners’ dependence. The participant’s integration
was demonstrated by slide 11. The text to the map upon encountering the initial
mention of the city of “Studentska.” The scan path shows consistent
visitations.
The fundamental differences
are shown by the heat maps in viewing patterns. The colors of heat vary in
severity from the hottest red to orange, yellow, and coolest green. The longer
viewing time has a hot color; the less viewing time has a cool color.
Participants who rated their style of learning as verbal and the events related
in the text underneath did not look to the map in relation. The map has some
green dots showing less use of the map and has no red spots. The events on the
map, while they were reading the story, are the participants who rated their
learning style as visual. The map shows how they looked at the area on the map
throughout their reading of the text the smaller corresponding red and yellow
colors. These phenomena have one explanation that is “Fixation that is
connected in a small area indicates focused and efficient searching” Cowen,
Ball, & Delin [27]. The map and text examine by the reported visual
learners in such a corresponding way, one red area on the map for every
reference of it in the text is possible to see. Rayner states that movements of
the eye occur when “information at the center of vision has been processed, and
a new fixation location has been chosen” [28].
Self-reported learning style
participants were used to discern, more deeply, the verbal and visual test's
performance scores concerning significant differences in relation. The visual
performance test score is the only significant difference that occurred between
the participants that rated themselves as moderate and slightly more visual (n
=27) and strongly more visual (n = 24). While the statistical difference also
performs more poorly than the more equally verbal visual and verbal all levels
(n = 11) group. The findings are unusual, to researchers one may defer, such as
Kollöffel, Massa & Mayer, who concluded that preferences and learning
styles did not relate to equating learning to lower or higher performance.
[29,30].
The heat maps for reported
visual learners and reported verbal learners over the 11-slide continued use of
the map by the supposed visual learners throughout the multimedia instruction
is another difference between them. Fixation on Minard’s map in slide 3 shows a
strong verbal learner heat map, the materials of the first slide. The “hot”
heat map on Slide 11 both groups resulted similarly. The events related to the
Berezina River in both the map and the text seem that they were similarly
attractive. Thus, they all spent more time reading and understanding the event.
Still, visual learners show a more intense fixation on the heat map. Jacob and
Karn specified that “the number of fixations on a particular display element
(of interest to the design team) should reflect the importance of that element”
[31]. Therefore, it is important to compare and contrast slide 11 with distinct
clusters, scan paths, and heatmaps.
The slide 11 viewing behavior
differed by verbal a visual learning style group. The text area seemed almost
the same for both groups. But, in the understanding of the text, there was a
big difference in their use of maps. The visual group make as much use of the
map as the verbal group did. The visual group spent more time relating other
events with what was described in the text, as evidenced by the relatively
hotter spots on their heat map. It seemed the visual learners made a more
concentrated effort to connect the instruction from previous slides with this
newer information.
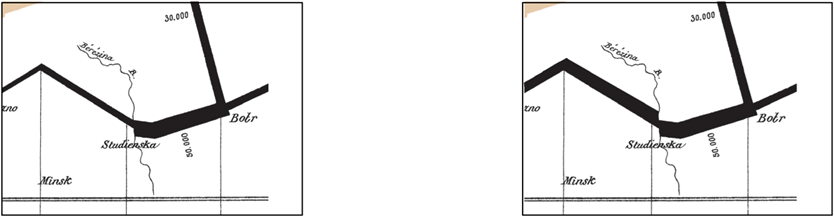
The slide 11 clusters (Fig. 5, 6) show very distinct areas of
participants for fixation of either visual or verbal learning styles. The Tobii
Studio software clustering is another type of visualization. The distance
between the two points is calculated by the software in the records and then
assigned to the same cluster. “The clustering algorithm tries to find spatial
patterns in the distribution of the gaze data” Tobii.com [32]. Same as the heat
maps, the text was read by the all-participants clusters presents that. Thus,
the participants with a verbal learning style did not use the map more than the
visual learning style. When the event was mentioned in the text only 20% of the
participants in the verbal learning style group looked at the related on the
map (Fig. 5). But when the related event was mentioned in the text only 80% of
the participants in the visual learning style group looked at the area on the
map (Fig. 6). These results present the participants who express the preference
for learning with the visual look to the map to understand the text
consistently [32].
The cluster shows all the
participants read the text, similar to the heat maps. Yet, the participants
with the verbal learning style did not use the map more than the visual
learner’s style. When the event was mentioned in the text only 20% of the
participants in the verbal learning style group looked at the related on the
map. But when the related event was mentioned in the text only 80% of the
participants in the visual learning style group looked at the relation on the
map. These results present the participants who express the preference for
learning with the visual look to the map to understand the text consistently.
Some participants still make
multiple visits to the map to support their understanding based on the scan
paths. Kalyuga, Chandler, and Sweller indicated that when learning from text
and diagrams, it is good to have the available for the learners to reduce
unnecessary search and graphics both physically [33]. An efficient search
reduces cognitive load and supports working memory, “disparate information
requires working memory resources that consequently are unavailable for schema
acquisition, inhibiting learning” Kalyuga et al [33].
The research has some
limitations such as the study participants only included females, along with
restriction of age and education; therefore, the results cannot be generalized
for a definite population.
The research
only used video with slides, which fails to
claim that the research is on computer interactions.
The study results do not contain verbal participants due to the
small sample size.
The findings of this study can be implied at various phases.
Firstly, the results of this paper can be implied in educational institutions
where they can use it as a useful teaching strategy. Besides this, various
advertising agencies can also benefit from this paper as infographics are
widely considered in the given field. Similarly, the results of this paper are
useful in designing effective multimedia presentations for both teachers and
students, as poster presentations are highly common among students and thus
provide maximum student engagement. Visual and verbal measurements in the given
paper are useful for instructors to identify students' needs during the
learning process.
Other than this, the present study can also be implied to various
technical and scientific information to deliver the content appropriately. For
future researchers, it is recommended to involve different formats such as;
(PDFs, videos etc.) to understand the change in behaviour and understanding
patterns of individuals.
Besides this, there is a need to investigate the topic in
different settings such as educational institutions, and marketing agencies,
along with its popular usage on social media. As infographics are now used in
various fields, this provides an open ground for the researcher to investigate
the topic to provide additional information. Working in this regard may be
carried out using a large sample to increase the reliability of the research.
The above-given suggestions are important to decode the viewing patterns of
different individuals under different settings while analyzing their impact on
user performance.
The study has evaluated computer interactions and infographic
usability. The study included both visual, verbal and viewing patterns
performance tests to understand the usability of the infographic. Thus, the
results of the study concluded that visual content and infographic were found
to significantly influence the usability and understanding of students.
Therefore, it can be concluded that infographics have a large impact on
enhancing the understanding of users. Moreover,
infographics
have implications in all the respective fields, including medicine, education,
and newspaper etc. To this end, the use of an infographic is justified and
can be used as an effective method, especially in the field of education to
increase the understanding of students.
[1]
Ibrahem U.M.
and Alamro A.R. Effects of Infographics on Developing Computer Knowledge,
Skills and Achievement Motivation among Hail University Students /
International Journal of Instruction. 2021. No 1. P. 907-26.
[2]
Borkin M.A., Bylinskii Z., Kim
N.W., Bainbridge C.M., Yeh C.S., Borkin D., Pfister H. and Oliva A. Beyond
memorability: Visualization recognition and recall / IEEE Trans Vis Comput
Graph. 2015. V. 22. P. 519-528.
[3]
Surketi G.N.
and Sitawati A.A. Mastering speaking skill through project-based learning with
infographics: perceptions and challenges.
[4]
Ozdamli F.
and Ozdal H. Developing an instructional design for the design of infographics
and the evaluation of infographic usage in teaching based on teacher and
student opinions / EURASIA. 2018. V. 14. P. 1197-1219.
[5]
Kordaki M. and Gousiou A.
Digital card games in education: A ten-year systematic review / Comput
Educ. 2017. V. 109. P. 122-161.
[6]
Hertzum M. and Simonsen J.
Configuring information systems and work practices for each other: What competencies
are needed locally / Int J Hum Comput Stud. 2019. V. 122. P. 242-255.
[7]
Wuang Y.P. Chiu Y.H. Chen Y.J.
Chen C.P. Wang C.C. Huang C.L. and Ho W.H. Game-Based Auxiliary Training System
for improving visual perceptual dysfunction in Children with developmental
disabilities: A proposed design and Evaluation / Comput Educ. 2018. V. 124.
P. 27-36.
[8]
Saleh B., Dontcheva M.,
Hertzmann A. and Liu Z. Learning style similarity for searching
infographics. arXiv preprint arXiv:1505.01214 2015.
[9]
Hernández-Sellés
N., Muñoz-Carril P.C. and González-Sanmamed M. Computer-supported
collaborative learning: An analysis of the relationship between interaction,
emotional support and online collaborative tools / Comput Educ. 2019. V. 138.
P. 1-12.
[10]
Barral O., Lallé S., Iranpour
A. and Conati C. Effect of adaptive guidance and visualization literacy on gaze
attentive behaviours and sequential patterns on magazine-style narrative
visualizations / ACM Transactions on Interactive Intelligent Systems. 2021. V. 11.
P. 1-46.
[11]
Sykes E.R. Reasoning about
ideal interruptible moments: A soft computing implementation of an interruption
classifier in free-form task environments / Int J Hum Comput Stud. 2018.
[12]
Marabella A. Communication
theories: An infographics development project (Doctoral dissertation,
Southern Utah University. Department of Communication. 2014.
[13]
de Koning B.B., Rop G. and
Paas F. Effects of spatial distance on the effectiveness of mental and physical
integration strategies in learning from split-attention examples. Comput
Hum Behav. 2020. V. 110. P. 106379.
[14]
Guo D., Zhang S., Wright K.L.
and McTigue E.M. Do you get the picture? A meta-analysis of the effect of
graphics on reading comprehension / AERA Open. 2020. V. 6. 2332858420901696.
[15]
Dori Y.J., Avargil S., Kohen Z.
and Saar L. Context-based learning and metacognitive prompts for enhancing
scientific text comprehension / Int J Sci Educ. 2018. V. 40. P. 1198-1220.
[16]
Seufert T. The interplay
between self-regulation in learning and cognitive load / Educ Res Rev. 2018.
V. 24. P. 116-129.
[17]
Glazewski K.D. and Ertmer P.A.
Fostering complex problem solving for diverse learners: engaging an ethos of
intentionality toward equitable access / Educ Technol Res Dev. 2020.
V. 68. P. 679-702
[18]
Stevenson M., Hedberg J.,
Highfield K. and Diao M. Visualizing solutions: Apps as cognitive
stepping-stones in the learning process / Electron J e-Learn. 2015. V. 13.
P. 366-379.
[19]
Smith L.R., Mittal M.L.,
Wagner K., Copenhaver M.M. Cunningham C.O. and Earnshaw V.A. Factor structure,
internal reliability and construct validity of the Methadone Maintenance
Treatment Stigma Mechanisms Scale (MMT‐SMS) / Addiction. 2020. V. 115.
P. 354-367.
[20]
Lazard A. and Atkinson L.
Putting environmental infographics centre stage: The role of visuals at the
elaboration likelihood model’s critical point of
persuasion. Sci Commun. 2015. V. 37. P. 6-33.
[21]
Bhandari U. Investigating
Visual Design for Increasing Pre-Use Evaluation and Post-Use Performance in
Mobile Applications (Doctoral dissertation, National University of
Singapore (Singapore). 2018.
[22]
Baglama B., Yucesoy Y.,
Uzunboylu H. and Özcan D. Can infographics facilitate the learning of
individuals with mathematical learning difficulties / Int J Cogn Res Sci
Eng Educ. 2017. V. 5. P. 119-128.
[23]
Murray I.R., Murray A.D.,
Wordie S.J., Oliver C.W., Murray A.W. and Simpson A.H.R.W. Maximising the
impact of your work using Infographics. 2017.
[24]
Naparin H. and Saad A.B.
Infographics in education: Review on infographics design / IJMA. 2017. V. 9. P.
5.
[25]
Goldberg J.H. Eye
movement-based interface evaluation: What can and cannot be assessed /
Proceedings of the Human Factors and Ergonomics Society Annual Meeting. 2000.
V. 44. No 37. P. 625-628. doi:10.1177/154193120004403721
[26]
Liu H.C. and Chuang H.H. An
examination of cognitive processing of multimedia information based on viewers'
eye movements / Interactive Learning Environments. 2011. V. 19. No 5. P.
503-517. doi:10.1080/10494820903520123
[27]
Cowen L., Ball L.S. and Delin
J. An Eye Movement Analysis of Web Page Usability. In Faulkner X. Finlay J., and
Détienne F. (Eds.), People and Computers XVI - Memorable Yet Invisible.
2002. (pp. 317-335). Springer London.
[28]
Rayner K. Eye movements and
attention in reading, scene perception, and visual search / The Quarterly
Journal of Experimental Psychology. 2009. V. 62. No 8. P. 1457-1506.
doi:10.1080/17470210902816461
[29]
Kollöffel B. Exploring
the relation between visualizer-verbalizer cognitive styles and performance
with visual or verbal learning material / Computers & Education. 2012. V. 58.
P. 2. P. 697-706. doi:10.1016/j.compedu.2011.09.016
[30]
Massa L.J. and Mayer R.E. Testing
the ATI hypothesis: Should multimedia instruction accommodate
verbalizer-visualizer cognitive style / Learning and Individual Differences.
2006. V. 16. No 4. P. 321-335. doi:10.1016/j.lindif.2006.10.001
[31]
Jacob R.J.K. and Karn K.S. Eye
tracking in human--Computer interaction and usability research: Ready to
deliver the promises. In Hyönä J., Radach R. and Deubel H. (Eds.),
The mind's eye: Cognitive and applied aspects of eye movement research. 2003.
(pp. 573-605). Boston. MA: North-Holland.
[32]
Tobii.com. User manual - Tobii
Studio, Version 3.2. 2012. Retrieved from
http://www.tobii.com/en/eye-tracking-research/global/support-and-
downloads/?product=787
[33]
Kalyuga S., Chandler P. and
Sweller J. Managing split-attention and redundancy in multimedia instruction /
Applied Cognitive Psychology. 1999. V. 13. No 4. P. 351-371. doi:10.1002/(SICI)1099-0720(199908)13:4<351::AID-ACP589>3.0.CO;2-6
VERBAL TEST
1.
Napoleon Bonaparte was the
leader of which
country?
a.
England
b.
France
c.
Poland
d.
Russia
2.
Who was the Tsar (leader) of
Russia?
a.
Federov
b.
Napoleon
c.
Alexander
d.
Nicholas
3.
What was the first river
crossed
by
Napoleon’s
army?
a.
The Nieman
River
b.
The Rhine
River
c.
The Berezina
River
d.
The Loire
River
4.
What was the approximate size
of Napoleon’s army at the beginning of the invasion?
a. 52,000 Men
b. 122,000
Men
c. 422,000
Men
d. 1,000,000 Men
5.
In what month did Napoleon’s
invasion of Russia
begin?
a.
June
b.
July
c.
August
d.
September
6.
According to the materials,
what was the first city captured
by
Napoleon?
a.
Maloyaroslavets
b.
Moscow
c.
Vitebsk
d.
Vilna
7.
Who was
Kutuzov?
a.
The Head of the Russian
Army
b.
One of Napoleon’s
Marshals
c.
The Mayor of
Moscow
d.
The English
Ambassador
8.
How did the Russians prevent
Napoleon from getting
supplies?
a.
By blocking the supply lines
to
France.
b.
By refusing to accept French
currency.
c.
By burning crops and
towns.
d.
By destroying the English
supply
ships.
9.
According to the materials,
why did Napoleon split his
army?
a.
To prevent Russian units from
joining
together.
b.
To look for food and
supplies.
c.
To make it easier to cross the
various
rivers.
d.
To hide the size of his
army.
10.
What direction is Vitebsk from
Vilna?
a.
North
b.
Northeast
c.
East
d.
Southeast
11.
The largest battle of the
invasion occurred near what
town?
a.
Vilna
b.
Smolensk
c.
Mozhaysk
d.
Moscow
12.
At the largest battle of the
invasion, what was the size of the French army compared to the size of the Russian
army?
a.
About
half
b.
About the same
size
c.
About
double
d.
About
triple
13.
In what city did the French
army plan to spend the
winter?
a.
Paris
b.
Moscow
c.
Smolensk
d.
Vilna
14.
Why did Napoleon’s army leave
Moscow?
a.
As a condition of a truce with
the
Russians
b.
Because of the arrival of the
English
reinforcements
c.
Constant attacks from the
Russian Army and
people
d.
A lack of food and
supplies.
15.
When Napoleon’s army left
Moscow what size was it (compared to the
original
invading
force)?
a. 1/2
b. 1/3
c. 1/4
d. 1/5
16.
What did the Russian army’s
arrival at Maloyaroslavets force the French to
do?
a.
Return to
Moscow
b.
Retreat along their original
invasion
route
c.
Take a longer route south back
to
France
d.
Abandon their cannons and
supply
wagons
17.
On the way to Studentska, why
did Napoleon’s force double in
size?
a.
Stragglers that didn’t make it
to Moscow rejoined the
force.
b.
Reinforcements from France met
Napoleon.
c.
Russians wishing to leave the
country joined his
army.
d.
The Italian Guard arrived from
the south.
18.
Difficulties in crossing the
Berezina River reduced Napoleon’s army
by
how much?
a. 1/2
b. 1/3
c. 1/4
d. 1/5
19.
At the end of the campaign,
approximately how many survivors were left in Napoleon’s
army?
a.
4,000 Men
b.
b. 10,000
Men
c.
c. 50,000
Men
d.
d. 100,000 Men
20.
Where was Napoleon’s army on
the coldest
day?
a.
Moscow
b.
Molodechno
c.
Studienska
d.
Malyaroslavets
VISUAL TESTS