The importance
of drug incompatibility cannot be overstated in the context of modern medicine.
In a world where numerous drugs are available for the treatment of various
diseases, it is important to pay special attention to the results of their
interaction. The results of the incompetent use of medicines can have long-term
and very serious health consequences. Often, such situations arise due to the
incompatibility of certain drugs.
Drug
incompatibilities can have serious consequences for patients, including poor
health, unwanted side effects, and even life-threatening situations. It is
important to note that incompatibility between drugs can occur due to various
factors, which include: chemical interactions, pharmacological effects and
adverse reactions [1]. Drug interactions are complex and varied, sophysicians,
pharmacists, and other healthcare professionals need to be aware of possible
incompatibilities in order to make informed drug therapy decisions.
In this
context, the development and visualization of a graph model of medicines taking
into account incompatibility is of great importance. The presentation of such
information in graphs provides a visual representation of the relationships and
interactions between drugs and classes, which can help professionals in the
field to better understand the potential risks associated with the combined use
of drugs.
At the moment,
a large number of studies have been carried out and there is a wide range of accumulated
knowledge related to the medications used and their side effects when various
drugs are used together [2,3]. This avoids repeat medical studies, which allows
the use of already existing datasets.
Thus, the aim
of the research is to develop a software prototype that allows taking into
account the incompatibility of several drugs and possible adverse reactions,
which will ultimately help to present the results in a visual format convenient
for human perception. It is also worth considering the possibility of using the
results obtained in the future as part of a more complex system, which implies
the presence of an API (Application Programming Interface) and receiving a
response in machine form.
To date, there
are various tools and approaches that help in solving the problem of
visualizing a graph model of medicines and their classes, taking into account
incompatibility. They
include:
•
Graph databases: Specialized databases such as Neo4j [4] that
store and manage information about medicines, their classes and relationships.
Such structures allow you to operate with great query capabilities and
algorithms for analyzing and visualizing graphs.
•
Visualization tools: Various graph visualization tools that can be
applied to the model of medicines and their classes. These include software
products Gephi [5], Cytoscape [6] and NetworkX [7], which provide flexible
tools for visualization and analysis of graph structures.
•
Bioinformatics and data integration: There are various resources
and databases in this area containing information on chemical compounds,
pharmacological properties and drug interactions, such as ClinVar [8].
Integrating this data with graph models and visualizing allows you to gain a
deep understanding of interactions between medicines.
•
Machine learning and data analysis: The use of machine learning
and data analysis methods allows you to identify hidden patterns and patterns
in the data of medicines, as well as solve the problem of division into
classes, which helps in building more accurate and informative graph
visualization models [9].
In general,
thanks to the development of information technology and research efforts in the
field of medicine and pharmacology, at the moment there is a set of tools and
approaches that contribute to the effective visualization of a graph model of
medicines and their classes, taking into account incompatibility. However, all
of them are a text model with the ability to check for compatibility only a few
specific drugs, without a visual component and without the ability to see a
list of all negative reactions for one drug.
To test the
algorithms of the software prototype and solve the problem of visualizing the
graph model of medical drugs and their classes a database in the PostgreSQL
format [10] obtained from the DrugCentral website [11] was chosen. This choice
was driven by several factors that make this database attractive for this task.
DrugCentral is a comprehensive drug database including information on chemical
structures, pharmacological properties, pharmacokinetics, side effects, drug
interactions and more. It brings together data from various sources, including
scientific articles, clinical trials and official drug registries. Such a
variety of data provides a rich context for the analysis and visualization of a
graph model of medicines. One of the advantages of DrugCentral is its relevance
and constant updating of data. The database is regularly updated with new
scientific research and developments in the field of pharmacology. This allows
taking into account the latest achievements and changes in the field of medicine,
which is especially important when analyzing the incompatibility of medicines.
In addition, it is possible to use an open copy of the database, which allows
you to directly configure a remote connection in order to have access to
up-to-date data in real time. This ensures that the analysis and visualization
of the graph model is based on up-to-date and reliable data, which is an
important factor in achieving accurate and relevant results. Using a remote
database also provides convenience and flexibility when working with data,
allowing you to quickly receive updates and make changes to the analyzed graph
model.
In the context
of the research, the most interesting is a bunch of five tables, which serves
as the basis for visualizing the graph model. These tables contain data about
drugs, their classes, and side effects between them. The choice of these tables
is determined by the goals and objectives of the study. These tables provide
the necessary and sufficient information to build a graph model (Fig. 1).
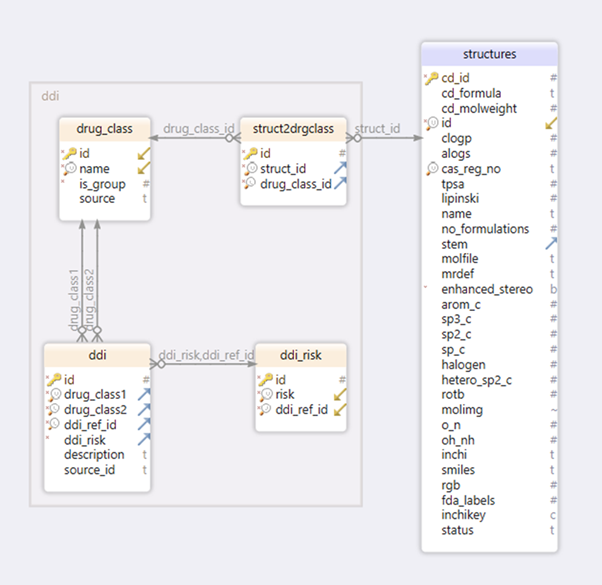
Figure 1. Tables and their
relationships that serve as the basis for the visualization of the graph model
It is
important to note that the drug-drug interactions described in the selected
pairing of tables represent an aggregation of data from two main sources:
drugdb [12] and lexicomp [13]. Drugdb is a database that contains information
about various aspects of medicines, including their composition,
pharmacological properties, and interactions. Lexicomp, on the other hand, is
an authoritative source of information about medicines, providing data on drug
interactions, possible side effects and recommendations for their use.
For the
convenience of data visualization and analysis, it was decided to use the CSV
format. To obtain the necessary data and their subsequent visualization into a
format, SQL queries were developed. Using these queries, the necessary tables
and relationships between them were selected in order to obtain information on
interactions between medicines, taking into account incompatibilities. An
example of the developed SQL queries is shown in fig. 2.
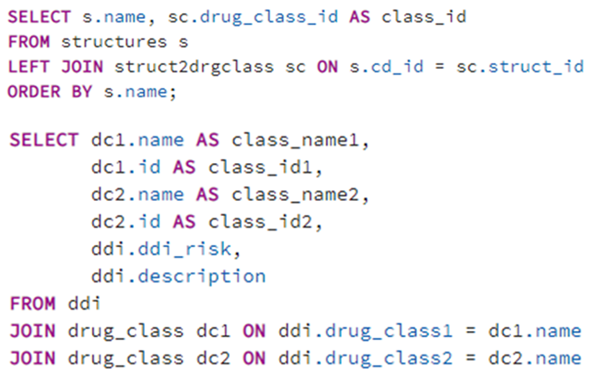
Figure. 2. An example of the developed
SQL queries for obtaining data
The results of
SQL queries are saved to two files in CSV format. The first file contains a
list of drug names and consists of 5692 lines. This file provides information
about specific medicines that were included in the analysis and visualization
of the graph model.
The second
file contains the results of interactions between drugs and consists of 7621
lines. This file is a set of pairs of interactions, where each line corresponds
to a set of two classes of drugs and the effect of their interaction.
It should be taken
into account that the software product being developed is primarily planned to
be used for operation by medical staff. In this connection, for ease of
perception, it is necessary to present data in an intuitive form.
To solve the
described problem in the software, it was decided to develop algorithms that
allow implementing and visualizing a graph model based on the available data,
with the ability to change the target medicines for which this model is being
built.
Rendering a
complete graph does not require any parameters. In html format, an interactive
graph is displayed, built on the basis of all the data received from the
database (Fig. 3.).
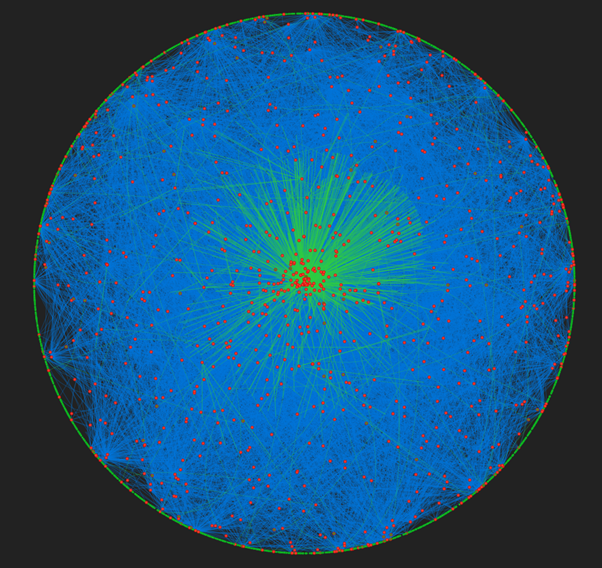
Figure 3. Interactive graph built on
the basis of all data
Red nodes
represent drug classes. These classes are interconnected by blue edges,
indicating the incompatibility of the two classes with each other, and each node
has its own signature with a comment about a possible side effect. Green nodes
represent medicines that are associated with classes by green edges.
This
visualization allows you to understand the scope of the study area and gain an
overview of the relationships and interactions between all drugs in the system,
which helps to understand the structure and complexity of the drug network.
Also, thanks to this visualization, it is possible to highlight the central
elements, which include key drugs or classes of drugs that play an important
role in the health care system. This can help in decision making and identify
potential areas for improvement and optimization.
In addition,
for ease of presentation, the graph is interactive and allows you to change the
location of the graph nodes in real time, moving them around the workspace. For
this, the Barnes-Hut physical model is used, which implements a hierarchical
tree to determine the forces of interaction between different nodes [14].
The advantage
of this approach is its time efficiency, even with a large number of vertices.
This is achieved by reducing the number of pairwise interacting vertices,
taking into account the distance between them. The force
 of
the action of the vertex
of
the action of the vertex
 on the vertex
 can be calculated through their
coordinates (formula 1)
can be calculated through their
coordinates (formula 1)
|

|
(1)
|
To calculate
the direction of such a force, the parallelogram rule is used, and the size of
such a force is calculated using the distance formula (formula 2)
|

|
(2)
|
In addition,
the vertices are rigid bodies, and a torque can act on them. Thus, it is
necessary to calculate the resultant force. Taking into account the direction
(formula 3). Force calculations are simplified by the fact that the vertices
are perfect circles.
|

|
(3)
|
However, this
graph is too large and inconvenient for a more detailed study of specific
relationships and the search for specific drugs. For this, it was decided to
implement the presentation in the form of an html page with the ability to
select one single drug for study (Fig. 4).
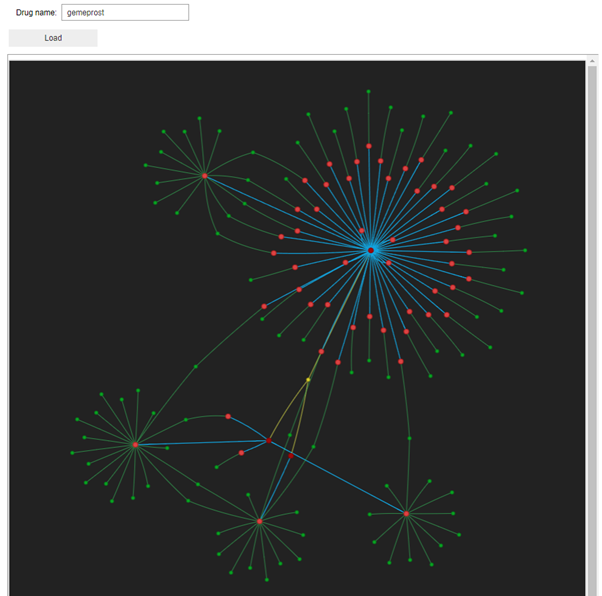
Figure 4. An example of an html page
with a single drug to study
After entering
the name of the drug to be considered, a new graph is built. The yellow node
denotes the drug in question. It is connected by yellow edges to the dark red
classes it belongs to. These classes are connected by blue edges with classes
with which negative effects are observed when interacting. Thus, this graph
allows you to visually consider the medicinal products and classes of drugs
with which the investigational medicinal product should not be mixed.
So, in the below
image, the drug “gemeprost” is being examined. It can be seen that it belongs,
among other things, to the classes “CYP3A4 Substrates” and “CYP2D6 Substrates”.
For the “CYP3A4 Substrates” class, there is a negative interaction with the
“fusidic acid” class, described as “may increase the serum concentration of
CYP3A4 Substrates” (Fig. 5).

Figure 5. An example of an html page
demonstrating the negative interaction between classes
Therefore, “gemeprost” cannot be combined with drugs of the “fusidic
acid” class and directly with homatropine. In addition, some drugs may have
incompatibilities across multiple classes, such as “gemeprost” incompatibility
with “carbocloral” and “rabeprazole”.
In addition,
it is possible to visualize two drugs and the presence or absence of
incompatibility links between them, this can be done using another html file
consisting of two input fields (Fig. 6).

Rice. 6. An example of an html page
demonstrating the visualization of two preparations
Based on this
example, it can be seen that the drugs “maltose” and “phenosulfazole” are
incompatible, since the drug class “Monoamine Oxidase Inhibitors” is
incompatible with the classes “Alpha/Beta Agonists” and “Indirectly Acting
Sympathomimetic Amines”. In addition, this visualization shows possible side
effects, such as hypertensive crisis, on the combined use of study drugs.
In addition to
human-friendly visualization, consideration must be given to the possibility of
using the software tool as a component of a larger program. To do this, a
number of API functions were implemented in Python 3.10, which simplify
interaction with the software product.
One of these
functions worth noting is the function for translating data from html to json
format. As an input parameter, the name of the drug is passed to its input,
after which a tree of all classes corresponding to the drug is built, while
each contains incompatible classes with a description of the side effect and a
list of the corresponding drugs (Fig. 7).

Figure 7. An example of the API
function for converting data from html to json format
For example,
the drug “iodoform” belongs to the “sevelamer” class, which is incompatible
with three classes, including “ciprofloxacin”, to which the drug “bufexamac”
belongs. So "iodoform" and "bufexamac" are incompatible.
In addition,
it is worth noting the function that allows you to check for the presence of
adverse reactions between two drugs and form a final list based on them. For
example, you can check the compatibility of "maltose" and
"phenosulfazole". Thus, during the operation of the implemented algorithm,
a list of two side effects of joint use will be displayed, which will describe
both the classes of drugs that cause these effects and the degree of risk (Fig.
8).

Figure 8. An example of the API
function for checking for adverse reactions between two drugs
This article
describes the software implementation of visualization tools for the graph
model of medical drugs and their classes, taking into account incompatibility.
A review of the subject area and existing solutions was carried out. The main
problems associated with the incompatibility of drugs, as well as the
importance and relevance of this topic in the medical field are presented.
To solve the
problem, a software prototype that allows visualizing the subject area and
relationships between drugs and their classes was developed. The database of
medicines was taken as a basis, obtained from DrugCentral, formed on the basis
of drugdb and lexicomp data. This provided a variety of data, including
information on drug interactions. Using SQL queries, the results were saved in
CSV format, which made it possible to use them for visualization in a
convenient format.
Within the
framework of the developed software tool, three main types of visualization
were implemented: a complete graph of relationships between drugs, a graph of
incompatible drugs for a selected drug, and a graph of compatibility of two
drugs. Each of these types of visualization provides valuable information and
helps in understanding the relationships and dependencies between medicines.
The developed
software tool is very useful for medical personnel, researchers and other
interested parties who want to explore and analyze the relationship between
medicines. Visualization of the graph model contributes to more accurate
decision-making and improves safety in the application of drug therapy.
However, it
should be taken into account that this model is a complex knowledge base, the
main task of which is to support the medical decision-making of specialists in
the field. Further development of the software tool may include expanding
functionality, improving the interface, and further using a wider range of data
to more fully and accurately reflect the complex relationships in the medical
field. However, the main goal is to apply the implemented algorithms within a
more complex decision support system using artificial intelligence methods.
The study was supported by
the Russian Science Foundation grant No 23-75-30012,
https://rscf.ru/en/project/23-75-30012/
1.
Begum, S., Reddy, Y., Divya, B., Komali, P., Sushmitha, K., & Ruksar,
S. (2018). PHARMACEUTICAL INCOMPATIBILITES: A REVIEW // Asian Journal of
Pharmaceutical Research and Development. doi: 10.22270/ajprd.v6i6.448.
2.
Marsilio N.R., Silva Dd., Bueno D. (2016). Drug incompatibilities
in the adult intensive care unit of a university hospital // Rev Bras Ter
Intensiva. doi: 10.5935/0103-507X.20160029.
3.
Sriram S., Aishwarya S., Moithu A., Sebastian A., Kumar A. (2020).
Intravenous Drug Incompatibilities in the Intensive Care Unit of a Tertiary
Care Hospital in India: Are they Preventable? // J Res Pharm Pract. doi:
10.4103/jrpp.JRPP_20_11.
4.
Neo4j: [web-resource]. URL: https://neo4j.com/ (date of
application: 23.05.2023)
5.
Gephi: [web-resource]. URL: https://gephi.org/ (date of
application: 23.05.2023)
6.
Cytoscape: [web-resource]. URL: https://cytoscape.org/ (date of
application: 23.05.2023)
7.
NetworkX: [web-resource]. URL: https://networkx.org/ (date of
application: 23.05.2023)
8.
ClinVar: [web-resource]. URL: https://www.ncbi.nlm.nih.gov/clinvar/
(date of application: 23.05.2023)
9.
Leopoldino R.W., Costa H.T., Costa T.X. (2018). Potential drug
incompatibilities in the neonatal intensive care unit: a network analysis
approach // BMC Pharmacol Toxicol. doi: 10.1186/s40360-018-0265-7.
10.
PostgreSQL: [web-resource]. URL: https://www.postgresql.org/ (date
of application: 23.05.2023)
11.
Sorin A., Thomas B.W., Ramona C., Liliana H., Ana B., Alina B.,
Cristian G.B., Jayme H., Jeffrey K., Jeremy J.Y., Tudor I.O. (2023).
DrugCentral 2023 extends human clinical data and integrates veterinary drugs //
Nucleic Acids Research. doi: 10.1093/nar/gkac1085
12.
DrugBank: [web-resource]. URL: https://go.drugbank.com/ (date of
application: 23.05.2023)
13.
Lexicomp: [web-resource]. URL: https://www.wolterskluwer.com/en/solutions/lexicomp
(date of application: 23.05.2023)
14.
van der Maaten L. (2013). Barnes-hut-SNE // Pattern Recognition
and Bioinformatics Group, Delft University of Technology doi:
10.48550/arXiv.1301.3342
