The article deals with Takens embedding for
2D and 3D visualization of 1D time series data. Topological data analysis (TDA)
is a field of science in which the topological properties of data are analyzed.
In recent years, interest has increased in the use of TDA methods [1, 2, 3] and
application in various fields of knowledge. TDA assumes that the data is in a
form that can make a difference. Early contributions to the field of TDA were
made by Edelsbrunner H. and Harer J. L. [1]. Zomorodian A. and Carlsson G. used
the basis for the development of the TDA methodology: Persistent Homology [2,
3, 4]. The goal of TDA is to define informative topological properties and use
them as descriptors.
The key mathematical tool in topological
data analysis is the persistent homology (PH) method [1, 4], which is used to
extract topological information from data. Consider a way to form PH from data
points in Euclidean space. The goal is to derive the topology from the final
data. Consider
 -balls
(of radius
)
for topology reconstruction. It is expected that the
-ball
model can represent the main topological structures. If
is
small, then the union of all
-balls consists of non-intersecting
-balls.
If the radii
are too large, then the union becomes one spatial component.
Persistent homology considers all values
at the same time and provides an
expression for topological properties.
-balls
(of radius
)
for topology reconstruction. It is expected that the
-ball
model can represent the main topological structures. If
is
small, then the union of all
-balls consists of non-intersecting
-balls.
If the radii
are too large, then the union becomes one spatial component.
Persistent homology considers all values
at the same time and provides an
expression for topological properties.
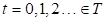
The TDA method can be used to extract
knowledge from time series [5, 6, 7]. The states of dynamical systems change in
time; in this case, time series are formed. The state of the system
 at
a point in time
at
a point in time
 is a description of the system, and the evolution of the system in the
state space is determined by the transition function
is a description of the system, and the evolution of the system in the
state space is determined by the transition function
 .
Attractors determine the set of system states, to the points of which the
trajectory is directed.
.
Attractors determine the set of system states, to the points of which the
trajectory is directed.
 -dimensional
manifold is a topological space
-dimensional
manifold is a topological space
 ,
for which each point
,
for which each point
 has a neighborhood homeomorphic to the Euclidean
space
has a neighborhood homeomorphic to the Euclidean
space
 .
A smooth map
.
A smooth map
 ,
where
,
where
 and
and
 are smooth manifolds, is an embedding of
in
if
is
diffeomorphism from
to a smooth submanifold of
;
then
is an embedding space with embedding
dimension
are smooth manifolds, is an embedding of
in
if
is
diffeomorphism from
to a smooth submanifold of
;
then
is an embedding space with embedding
dimension
 .
Takens embedding of coordinates [8] allows to transform a time series
in a space of higher dimension, so that the topology of the original manifold
that generates the values of the time series is preserved. The Takens method
finds a function
that maps the manifold
into the manifold
:
.
Takens embedding of coordinates [8] allows to transform a time series
in a space of higher dimension, so that the topology of the original manifold
that generates the values of the time series is preserved. The Takens method
finds a function
that maps the manifold
into the manifold
:
 ,
where
is
the dimension of the embedding.
,
where
is
the dimension of the embedding.
Takens embedding allows you to transform
time series data into meaningful point clouds to calculate persistent homology
[8, 9, 10, 11]. In addition, the use of the sliding window method allows
segmenting long time series into fragments, which makes topological features
comparable within and between data sets.
The Takens-embedded TDA method is widely
used in chemistry and biological systems [12], signal theory [13], in the study
of dynamic systems [14], etc. The use of the TDA method for comparing images
[15, 16] makes it possible to classify and identify images (or signals of a
different physical nature).
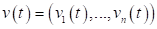
In this paper, we consider the use of TDA
together with the Takens embedding to analyze the output information of a
dynamical system - a rigid body.
Examples of rigid bodies are objects such
as aircraft that contain control systems (eg, attitude control systems). The
instrumental composition of control systems consists of sensitive elements and
executive bodies. To measure the three components of the angular velocity
vector of a rigid body, sensitive elements are usually used - angular velocity
sensors (or a block of angular velocity sensors that generates information
about the projections of the angular velocity vector of a rigid body on the
axes of the main moments of inertia of a rigid body).
3D images of curves constructed from three
components of the angular velocity vector of a rigid body for various values of
the main moments of inertia are constructed. 3D images of the curves built on
the basis of the Takens embedding for the components of the angular velocity
 of
a rigid body for various values of the main moments of inertia are constructed.
Using the TDA method together with the Takens embedding to compare images (or
signals of other physical nature) allows you to classify and identify
information from sensors.
of
a rigid body for various values of the main moments of inertia are constructed.
Using the TDA method together with the Takens embedding to compare images (or
signals of other physical nature) allows you to classify and identify
information from sensors.
Geometry represented by data in metric
space is not always up to date; sometimes more basic properties are of
interest, such as the number of components, holes, or voids. Algebraic topology
[17] fixes these properties by associating the vector spaces with them. The
field coefficient homology assigns to a vector space
 the
space
the
space
 for
each
for
each
 such
that
such
that
 is
the number of connected components in
,
is
the number of connected components in
,
 is the number of holes in
,
is the number of holes in
,
 is
the number of voids in
and
is
the number of voids in
and
 – the
– the
 -th
homology group in
describes
-dimensional
holes in
.
-th
homology group in
describes
-dimensional
holes in
.
A simplex is the
-dimensional
analogue of a triangle or tetrahedron. A
-simplex
is an
-dimensional
polyhedron created by the convex hull of its
 vertex. Let
 be
-simplex.
A vertex
is
each of the
points used to define
,
and a face
is the convex hull of any subset of
vertices
.
A simplicial complex is a topological space realized as the union of
any set of simplices
be
-simplex.
A vertex
is
each of the
points used to define
,
and a face
is the convex hull of any subset of
vertices
.
A simplicial complex is a topological space realized as the union of
any set of simplices
 with the following two properties: (1) any face of
the
simplex also lies in
;
(2) the intersection of any two simplices
is
also a simplex.
with the following two properties: (1) any face of
the
simplex also lies in
;
(2) the intersection of any two simplices
is
also a simplex.
The persistent homology method studies the
qualitative aspects of the data by calculating their topological
characteristics. It is robust to perturbations, is independent of the size and
coordinates of the embedding, and can provide a representation of the
qualitative characteristics of the data. The input data is a point cloud in
metric space; for example
 ,
in Euclidean space
,
in Euclidean space
 .
To compare the topological space,
simplicial complexes are constructed.
.
To compare the topological space,
simplicial complexes are constructed.
After the calculation of simplicial
complexes, features dominate in the space consisting of vertices, edges and
polyhedra of higher dimensions. Then, using homology, characteristics such as
components, holes, voids, and other higher-dimensional equivalent
characteristics can be measured. The permanence of these functions is
represented on persistent diagrams or persistent barcodes.
Persistent homology captures how long
topological features persist. The ranks of persistent homologous groups are
presented in the persistence diagrams. This is multiset of points in
 and
is defined as [1]; persistent homology can be visualized by a persistence
diagram (PD)
and
is defined as [1]; persistent homology can be visualized by a persistence
diagram (PD)
 .
Each point
.
Each point
 ,
which is called a persistent homology generator,
represents a topological property that represents a topological property that
appears at
,
which is called a persistent homology generator,
represents a topological property that represents a topological property that
appears at
 and disappears at
 in the
-ball
model. A topological property with
high persistence
in the
-ball
model. A topological property with
high persistence
 can be considered as a reliable structure, while a
topological property with low persistence can be considered as noise.
Persistent diagrams encode topological and geometric information about data
points.
can be considered as a reliable structure, while a
topological property with low persistence can be considered as noise.
Persistent diagrams encode topological and geometric information about data
points.
Maximum persistence is defined as:

where
 is the persistence diagram for the
 -th
homology.
-th
homology.
Dynamic systems are built from the state
space. The system is considered dynamic because states can change over time.
Dynamic systems can be either deterministic or stochastic. The dynamic system
is described in the state space
,
space of time
 and
is determined by the transition function
and
is determined by the transition function
 .
The state
.
The state
 is defined through the state
using
the transition function
is defined through the state
using
the transition function
 :
:
 ,
,
where
 .
.
Dynamic systems are used to model systems
whose states change over time. The state
at a point in time
is
a description of the system, and the evolution of the system in the state space
is determined by the transition function
.
Attractors determine the set of system
states, to the points of which the trajectory is directed. The time series is
determined by the observed states of the dynamical system.
-dimensional
manifold is a topological space
,
for which each point
has
a neighborhood homeomorphic to the Euclidean space
.
A smooth mapping
,
where
and
are smooth manifolds, is an embedding
to
,
if
is a diffeomorphism from
to
a smooth submanifold (embedding space).
Takens embedding of coordinates allows you
to reconstruct a time series in a higher dimensional space, so that the
topology of the original manifold that generates the values of the time series
is preserved. Takens suggested that
 -dimensional
manifold containing an
attractor
-dimensional
manifold containing an
attractor
 can be embedded in
 [8]. The Takens method finds a function
that
maps
,
where is the nesting dimension
,
which can be
.
[8]. The Takens method finds a function
that
maps
,
where is the nesting dimension
,
which can be
.
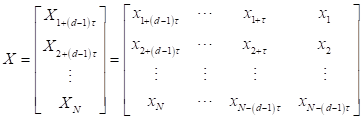
Thus, the Takens embedding makes it
possible to obtain a continuous transformation of the original manifold
to
 ,
where
is the embedding dimension and
is
the trajectory matrix. Let
,
where
is the embedding dimension and
is
the trajectory matrix. Let
 be a time series and
be a trajectory matrix:
be a time series and
be a trajectory matrix:
|
|
(1)
|
where each point in space is represented by a string.
A more formal definition is given in [10].
Suppose that
 for some
 ,
where
,
where
 is a curve on the manifold
 .
Suppose that
.
Suppose that
 visits every part of
,
which means that
is dense in
with respect to its topology. Then there
exists
visits every part of
,
which means that
is dense in
with respect to its topology. Then there
exists
 ,
where
,
where
 denotes real numbers such that the corresponding vectors
 are
on a manifold topologically equivalent to
.
are
on a manifold topologically equivalent to
.
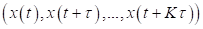
Example 1. Takens embedding example.
Denote by
 the reconstructed one-dimensional time
series, where
is the time,
the reconstructed one-dimensional time
series, where
is the time,
 is the delay time, and
 is the dimension of the reconstruction.
Let our one-dimensional time series be
is the dimension of the reconstruction.
Let our one-dimensional time series be
 .
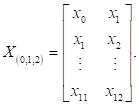
Using (1) for a one-dimensional
reconstruction with
.
Using (1) for a one-dimensional
reconstruction with
 ,
we obtain a time series
,
we obtain a time series
The definition of the Takens embedding
dimension is based on the false nearest neighbors method [9]. The embedding
property is that when the embedding dimension
is too small, distant points in the
original phase space are close points in the reconstructed phase space. These
points are called false neighbors. When calculating the false nearest neighbor
for each point
 ,
we look for the nearest neighbor
,
we look for the nearest neighbor
 in
-dimensional
space. After that, the ratio
in
-dimensional
space. After that, the ratio
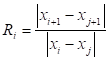 is
calculated. If the ratio
is
calculated. If the ratio
 exceeds the specified threshold
 ,
then the point is marked as a false neighbor. If the attachment size is high
enough, the ratio
is zero. One way to calculate
is
to embed the lag time series
,
then the point is marked as a false neighbor. If the attachment size is high
enough, the ratio
is zero. One way to calculate
is
to embed the lag time series
 with delay
in a range of different embedding
dimensions
.
You need to find all nearest neighbors and calculate the percentage
of neighbors left after expanding the extra dimensions.
with delay
in a range of different embedding
dimensions
.
You need to find all nearest neighbors and calculate the percentage
of neighbors left after expanding the extra dimensions.
When evaluating the time delay
,
two criteria are important: 1) the time delay
must be large enough so that the
information about the value of
at time
 differs from the information already known
from observing the value of
at time
;
2) the time delay
should
not be large enough so that the system does not forget about its initial state
[11].
differs from the information already known
from observing the value of
at time
;
2) the time delay
should
not be large enough so that the system does not forget about its initial state
[11].
To compare images, let's determine the
distances between these images: the greater the difference between the images,
the greater the distance between them; the distance between identical images is
zero. Euclidean transformations of images should not change the distance
between them.
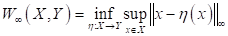
To determine the distance between images
(or objects of other physical nature), a persistent landscape is used - a
piecewise linear function, which is a generalization of a persistent diagram
[18]. The persistent landscape rotates the persistence diagram so that the
diagonal becomes the new axis
.
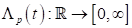
The
-th
order of persistence landscape produces
a piecewise linear function of the
-th
largest point value in the persistence
diagram after rotation. For the pair
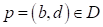 ,
where
,
where
 are the persistence diagrams, the
piecewise linear functions
are the persistence diagrams, the
piecewise linear functions
 are equal to:
|
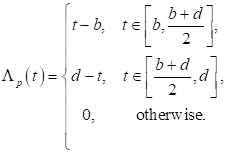
|
(2)
|
Then the persistent landscape (PL) function
is defined as:
|
 : :
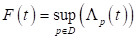 . .
|
(3)
|
Let's form the core of PL functions:
|
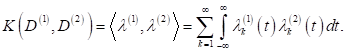
|
(4)
|
For the PL functions, we form the
 -norm
[18] :
-norm
[18] :
|
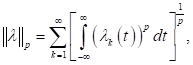
|
(5)
|
where
 .
.
Distances between PL functions can be
determined using the
-norm:
|
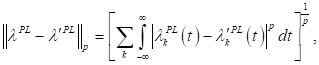
|
(6)
|
where
.
Let
and
 be two persistence diagrams. A persistent
diagram consists of a finite number of points above the diagonal. To this
finite set we add an infinite number of points on the diagonal. Consider
bijections
be two persistence diagrams. A persistent
diagram consists of a finite number of points above the diagonal. To this
finite set we add an infinite number of points on the diagonal. Consider
bijections
 and write sup (least upper bound) of the distances between the
corresponding points for each. By measuring the distance between the points
and write sup (least upper bound) of the distances between the
corresponding points for each. By measuring the distance between the points
 and
and
 with
the norm:
with
the norm:
|
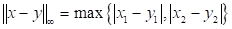 , ,
|
(7)
|
and taking inf (the largest upper bound) over all
bijections, we get the Bottleneck distance between the diagrams (1) :
|
|
(8)
|
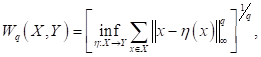
Wasserstein distance
 -powers
between
and
:
-powers
between
and
:
|
|
(9)
|
where
 .
.
Example 2.
An example of free motion of a rigid body.
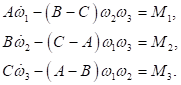
Components of the angular velocity vector
will be taken equal to zero:
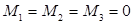 .
.
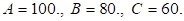
a) Consider the case of a rigid body with
the principal components of the inertia tensor:
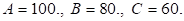
Initial values of the components of the
angular velocity vector of a rigid body:
 .
.
Step of integration of the system of
differential equations:

Barcodes of 3D images of the evolution of
the components of the angular velocity vector of a rigid body.
Barcodes of dimension 0: 14[0.0, 0.05);
[0.0, 0.1); [0.0, infinity).
Barcodes of dimension 1: [0.1, 0.5).
Figure 1. Components of the angular velocity vector of
a rigid body for the case of principal moments of inertia
 :
:
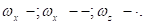
Figure 2. 3D image of the evolution of the components
of the angular velocity vector of a rigid body for the case of principal
moments of inertia

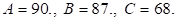
b) Consider the case of a rigid body with
the principal components of the inertia tensor:
Initial values of the components of the
angular velocity vector of the TT:
 .
.
Step of integration of the system of
differential equations:
Barcodes of 3D images of the evolution of
the components of the angular velocity vector of a rigid body.
Barcodes of dimension 0: 10[0.0, 0.05); .
Barcodes of dimension 1: [0.05, 0.45).
On Fig. 1 shows the graphs of the
components of the angular velocity vector of a rigid body for the case of the
principal moments of inertia
On Fig. 2 shows a 3D image of the evolution
of the components of the angular velocity vector of a rigid body for the case
of the principal moments of inertia

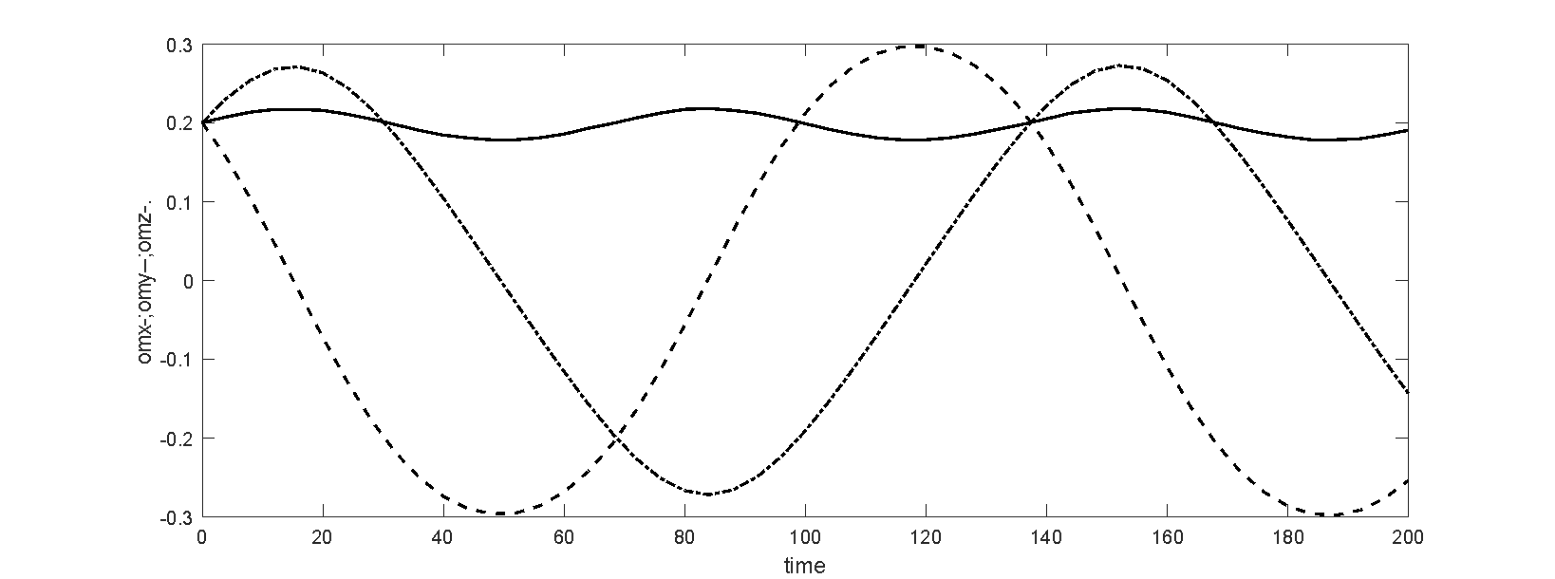
Figure 3. Components of the angular velocity vector of
a rigid body for the case of principal moments of inertia
 :
:
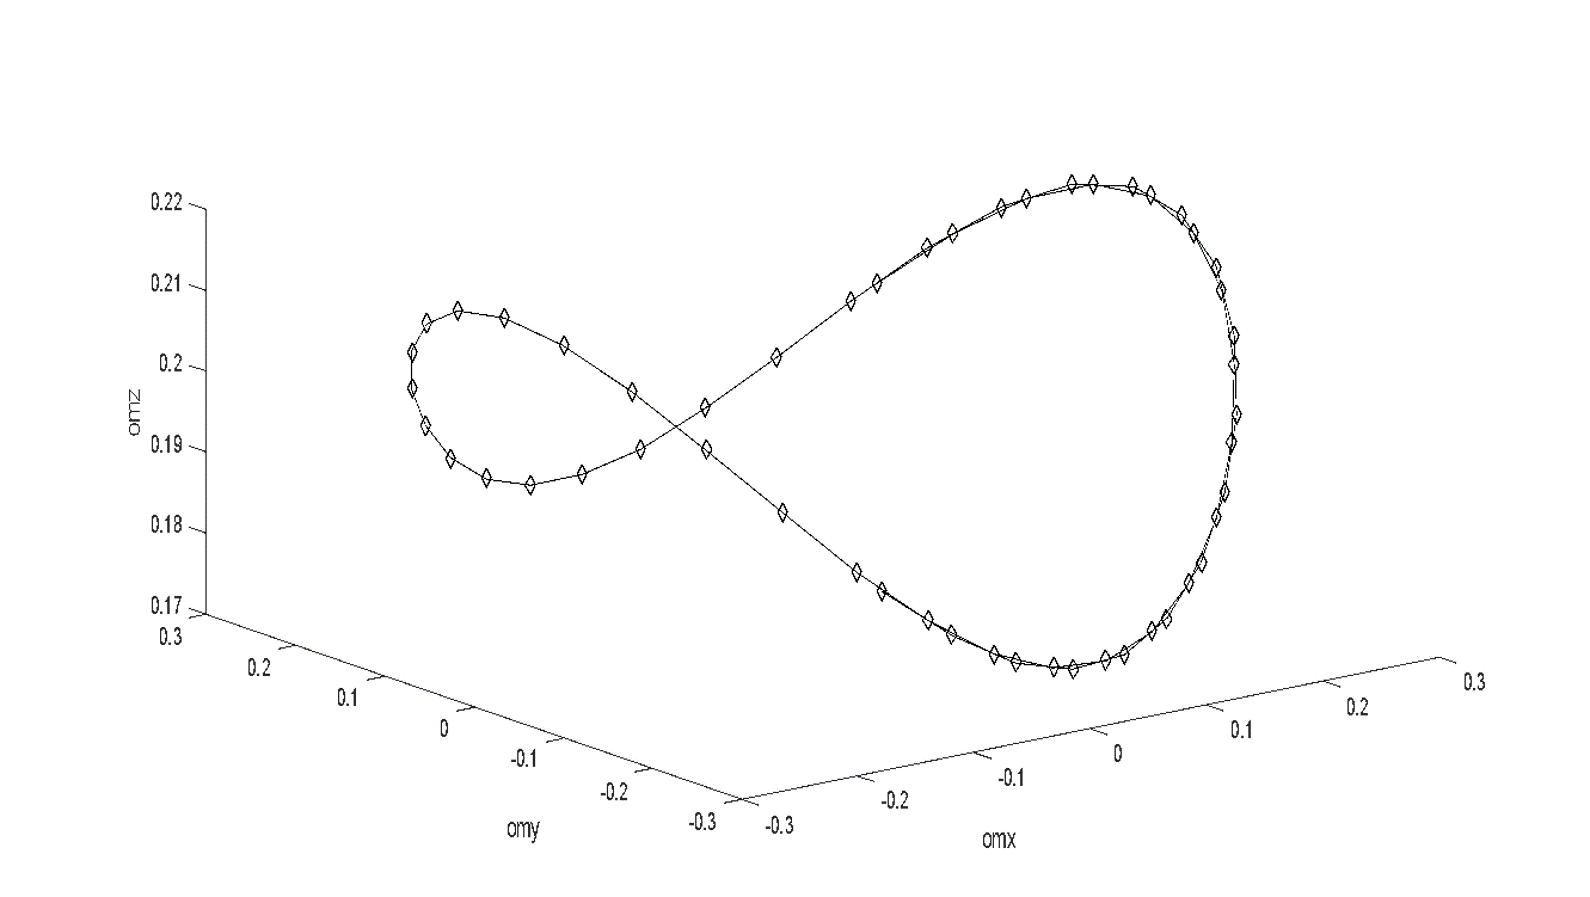
Figure 4. 3D image of the evolution of the components of
the angular velocity vector of a rigid body for the case of principal moments
of inertia
Barcodes of 3D images of the evolution of
the components of the angular velocity vector of a rigid body.
Barcodes of dimension 0: 10[0.0, 0.05); .
Barcodes of dimension 1: [0.05, 0.45).
On Fig. 3 shows the graphs of the components
of the angular velocity vector of a rigid body for the case of the main moments
of inertia

On Fig. 4 shows a 3D image of the evolution
of the components of the angular velocity vector of a rigid body for the case
of principal moments of inertia

Bottleneck distance between 3D
images (barcodes of dimension 1):

Example 3:
Takens embedding for
 3D
3D
 .
.
a) Consider the case of a rigid body with
the principal components of the inertia tensor:
Barcodes of dimension 1:
 .
.
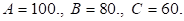
On Figure 5 shows a visualization of the 3D
image of Takens embedding of the angular velocity component for the case of
principal moments of inertia:

Figure 5. 3D image of the embedding of the Takens
component
for the case of principal moments of inertia
b) Consider the case of a rigid body with
the principal components of the inertia tensor:
Barcodes of dimension 1:
 .
.
On Figure 6 shows a visualization of the 3D
image of Takens embedding of the angular velocity component for the case of
principal moments of inertia:


Figure 6. 3D image of the embedding of the Takens
component
 for the case of principal moments of inertia
Bottleneck distance between images
(barcodes):

The paper considers the Takens
embedding for two- and three-dimensional visualization of one-dimensional time
series data.
The use of topological data
analysis together with the Takens embedding to analyze the output information
of a dynamic system - a rigid body is considered. 3D images of curves
constructed from three components of the angular velocity vector of a rigid
body for various values of the main moments of inertia are constructed.
Three-dimensional images of the curves constructed on the basis of the Takens
embedding for the component of the angular velocity of a rigid body for various
values of the main moments of inertia are constructed.
Using the TDA method in conjunction
with the Takens embedding for image comparison allows you to classify and
identify images (or signals of a different physical nature).
The proposed TDA method,
together with the Takens embedding, can be used for pattern recognition, data
analysis in object control systems (for example, in an aircraft attitude
control system).
The advantage of the TDA
method lies in the invariance with respect to the Euclidean transformations of
the components of the output information of devices and in the increase in the
amount of analyzed information (in relation to traditional topological methods)
due to the use of information about barcodes.
The research was funded in
accordance with the state task of the IM SB RAS, project FWNF-2022-0016, and the
Russian Science Foundation, grant no. 22-21-00035.
1. Edelsbrunner H., Harer J. L.
Computational topology: an introduction. – American Mathematical Society, 2022.
2. Zomorodian A., Carlsson G. Computing persistent homology
//Proceedings of the twentieth annual symposium on Computational geometry. –
2004. – pp. 347-356.
3. Carlsson G. Topology and data //Bulletin of the American
Mathematical Society. – 2009. – Vol. 46. – №. 2. – pp. 255-308.
4. Wasserman L. Topological Data Analysis //arXiv e-prints. –
2016. – arXiv: 1609.08227.
5. Bourakna A. E. Y., Chung M. K., Ombao H. Topological Data
Analysis for Multivariate Time Series Data //arXiv preprint arXiv:2204.13799. –
2022.
6. Pereira C. M. M., de Mello R. F. Persistent homology for
time series and spatial data clustering //Expert Systems with Applications. –
2015. – Vol. 42. – №. 15-16. – pp. 6026-6038.
7. Gidea M., Katz Y. Topological Data Analysis of Financial
Time Series: Landscapes of Crashes
//arXiv preprint arXiv:1703.04385. –
2017..
8.
Taken F. Dynamical systems and turbulence //Warwick, 1980. – 1981. – pp. 366-381.
9.
Kennel M. B., Brown R., Abarbanel H. D. I. Determining embedding dimension for
phase-space reconstruction using a geometrical construction //Physical review
A. – 1992. – Vol. 45. – №. 6. – pp. 3403-3411.
10.
Torku T. T. Takens Theorem with Singular Spectrum Analysis Applied to Noisy
Time Series: Diss. – East Tennessee State University, 2016.
11.
Kodba S., Perc M., Marhl M. Detecting chaos from a time series //European
journal of physics. – 2004. – Vol. 26. – №. 1. – pp. 205.
12.
Offroy M., Duponchel L. Topological data analysis: A promising big data
exploration tool in biology, analytical chemistry and physical chemistry
//Analytica chimica acta. – 2016. – Vol. 910. – pp. 1-11.
13.
Perea J. A., Harer J. Sliding windows and
persistence: An application of topological methods to signal analysis
//Foundations of Computational Mathematics. – 2015. – Vol. 15. – №. 3. – pp. 799-838.
14.
Maletić S., Zhao Y., Rajković M.
Persistent topological features of dynamical systems //Chaos: An
Interdisciplinary Journal of Nonlinear Science. – 2016. – Vol. 26. – №. 5. –
pp. 053105.
15. Chukanov
S.N. Comparison of object images by methods of computational topology. //
Informatics and automation. –
2019. –
Vol. 18. –
№.
5. –
pp. 1043-1065.
16.
Leikhter S.V., Chukanov S.N. Comparison of images based on their diffeomorphic
transformation. // Computer Optics. –
2018. –
Vol. 42. –
№
1. –
pp. 96-104.
17.
Hatcher A. Algebraic topology. – Cambridge UP. – 2005.
18.
Bubenik P. The persistence landscape and some of its properties // Topological
Data Analysis. – Springer, Cham, 2020. – pp. 97-117.
