The first historical stamps of data
visualization reach back to before 17th
century. Its “golden age”
dates to the second half of 19th
century [1]. However, it is the
21st
that may be called
the renaissance of data visualization.
Human preference to acquire
information with visual means [2] in tandem with the time efficiency of
conveying information with charts [3] results in massive production of data
visualization applied in various fields, including business analysis, Big Data,
psychology, journalism, and production process [4,5]. Mass-produced charts,
graphs, diagrams, schemes and infographics flood the market and the viewers
[6].
The influx of data visualizations is
possible thanks to the vast plethora of specialized tools. Although novel
software makes visualization easier, they do not ensure the quality of their
creations. Moreover, no modern tools are designed to evaluate the quality of
the data visualization. We are still limited to guidelines presented in
checklists, lists of questions or suggestions that often fail to fulfill their
task [7].
To fill this void, we
propose organized, systematic data visualization guidelines based on
state-of-the-art practices, VisQualdex.
Our methodology allows everyone, from
non-specialists to data science experts, to assess the quality of data
visualization and pinpoint existing problems. Compared to current methods for
data visualization evaluation, VisQualdex leads to a more exhaustive and
complete evaluation, due to utilizing a systematic, precise and scientifically
supported criteria. Moreover, the VisQualdex is also available as the companion
web application, VisQual, and thus can be easily incorporated in many design
workflows.
The focus of VisQualdex is to evaluate
the quality of broadly understood static “data visualizations”. The definitions
in the literature vary from the “image that is representative of the raw data”
[8] to “the set of methods for graphically displaying information in a way that
is understandable and straightforward” [9]. Despite the relative vagueness of
these definitions, they capture the essential aim of the data visualization,
which is to communicate information in a graphical form. The “static” keyword
indicated that this guideline refers to visualization that could be simply
printed out without losing its key features, i.e. interactive dashboard or real
3D visualization are out of the scope.
In all types of communication, there
are many possibilities of conveying the same message. Therefore, the data
visualization itself covers drastically different entities, ranging from the
simple chart (Figure 1) to more complex visualizations (Figure 2). It provides
an additional layer of complication to the data visualization assessment, as
the rules must be general enough to apply to all types of data visualization.
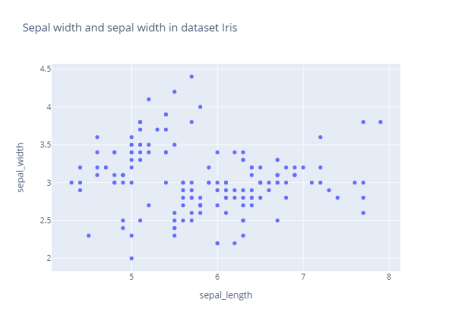
Figure 1: An example
of a “classical” data visualization
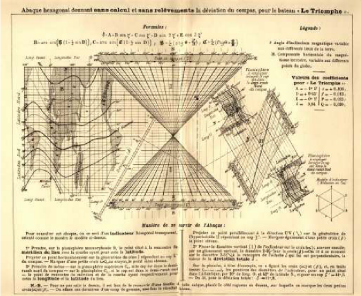
Figure 2: An example
of a “non-classical” data visualization (adapted from Charles Lallemand’s “tour
de force” nomogram from a work on hexagonal charts [10]
Despite the vagueness of definitions,
the way we describe data visualizations is subject to numerous improvements
over time [1].
These small steps
result in more structured descriptions of visualizations, exemplified by the
grammar of graphics. These theoretical achievements have contributed to the
development of practical tools such as Matplotlib, Seaborn, Plotly and others
[11–14].
In a glaring difference, the
evaluation of data visualization is still as unsystematic as it used to be in
the past. The first debate on that topic dated back to 1857 and resulted in
several advises [15]. The theoretical understanding of the correctness of data
visualization has grown over time with new or revised good practices [8],
but very few propose practical and applicable evaluation
methods.
The lack of a systematic approach
stems from the popularity of checklists as one of the most commonly adapted
evaluation systems. Here, a checklist is a list of potential mistakes,
sometimes divided in thematic sections. The first checklists (or guidelines)
date back to 1915 [16], but the community of data visualization practitioners
is still producing newer counterparts [17].
Checklists have two main practical
advantages: simplicity and shortness. Simplicity means that the majority of the
state-of-the-art checklists can be easily operated by any viewer with a basic
understanding of the most trivial data visualization concepts, like chart, axis
or scale. Moreover, most visualization checklists are brief (e.g., about 20
questions [17, 18]).
This short
length, along with the simplicity, translates to a relatively good assessment
pace.
However, checklists are characterized
by the disorder happening on two different conceptual levels: the lack of
organization and varying levels of universality.
In the majority of studied examples,
checklists do not possess any grouping or hierarchy of the guidelines. Although
some checklists demonstrate some degree of guideline categorization, they often
do not reflect the state-of-art data visualization descriptions and may have a
practical rationale.
The varying level of universality
happens when general guidelines (e.g., keep the graph two-dimensional) occur
along with more specific pieces of advice (e.g., ’use bar charts to visualize
achievement of an objective’). It limits the scope of the checklist to a
particular set of data visualizations. This problem is even more pronounced if
the checklist contains a scale based on the number of questions answered
correctly or fulfilled guidelines. In this situation, non-general guidelines
falsely lower the actual score of a visualization.
Moreover, usage of checklists forces
following the state-of-the-art methodology and logic of check lists [19], which
state that (some points are skipped):
• “The list should be complete (no
significant omissions).” and “The checkpoints should refer to criteria and not
mere indicators.”
According to this research, the second
rule is most often broken as none of the state-of-the-art checklists have
“complete”/“full” coverage of the evaluation criteria. As most of both
state-of-the-art data visualization checklists aim at an “engineering”
approach, they tend to have very strict, concise and precise points. However,
this causes them to sometimes be superficial, oversimplified and focus on
indicators instead of criteria. For example, a rule “No more than 3 colors”
[18] is focusing purely on indicators, but disallows great 4-color
visualizations from passing the benchmark. Additionally, a rule “Did you start
the Y-axis at 0?” (answer yes/no) [20] allows only charts which do not cut the
axis in a justifiable way (e.g. shoe sizes for adults, Earth temperatures with
Kelvin units, etc.).
•
“The criteria should be commensurable.”
This criterion is not applicable to
data visualization checklists, because some mistakes are more significant than
others. There exist visualizations which can follow all criteria except one and
still be condemning wrong.
• “The list should be concise (to assist its mnemonic function).”
In contrast to engineering processes
or medical applications [21],
data
visualization does not always follow strict regularities as it is a mix of
applied arts and fine arts which cannot be separated [22,23].
Therefore, applying checklist format
to data visualization evaluation may lead to problems which are neither the
problem of the checklist methodology, neither the data visualization
evaluation. The problem lies in forcefully fusing the two ideas together.
All problems described above, together
with the brevity, result in the non-exhaustiveness of check lists. Right now,
there are no checklists that would approach the evaluation of data
visualization in a systematized way. Therefore, we have designed VisQualdex to
at least partially alleviate these issues and produce an evaluation methodology
applicable to the broad spectrum of data visualizations.
The development of VisQualdex follows
the VISupply framework for design of data visualization guidelines [24].
It
covers four main steps:
•
Evidence collection
Collection and diligent analysis of research works about data
visualization.
•
Integration
Curation of existing data visualization guidelines, good
practices, suggestions and similar.
•
Contextualization
& Generalization
Merging
concepts from different works and forming clusters, a.k.a. “categories” (see
section 2.1).
•
Guideline Definition
Formalization of VisQualdex, i.e.
stating the “question” format, supplementing missing areas and verifying
VisQualdex in practice, utilizing and extending nomenclatural notions [25].
Moreover, an original concept
introduced in VisQualdex consists of the four main traits of a correct data
visualization. These four pillars of VisQualdex are:
1. Real data instead of guesstimates.
2. Clarity and readability instead of incomprehensibility and
ambiguity.
3. Simplicity and summarization instead of complexity and raw
data.
4. Guidance and objectivity instead of manipulation and
subjectivity.
Finally, the codex has been
peer-reviewed by 4 independent reviewers. The reviewers were experts and
specialists in the following fields (parenthesis contain the reviewer’s higher
domain): data visualization (computer science), data science (computer science),
graphics and design (fine arts) and information technology (computer science).
The reviewers all submitted their critique to all the questions and overall
codex design. The feedback was gathered in 1–3 iterations, depending on the
reviewer. All the comments and suggestions caused various criteria (VisQualdex
questions) to be introduced, redefined or abandoned due to lack of quality
evidence.
It is important to note that in some
initial stages of development, the tool was supposed to be based on user testing
and feedback in a “wisdom of the crowds” methodology. However, the user’s
feedback was very fragmented and not unanimous. Moreover, it was highly biased
to the user experience. Therefore, the expert approach was chosen to strengthen
the final criteria, maximize the good practices and minimize the bias of random
user evaluation.
The important part of VisQualdex is
the categorization of guidelines. The baselines are the formalized descriptions
of Grammar of Graphics (GoG) [26] and Layered Grammar of Graphics (LGoG) [27].
Although both of these approaches constitute an in-depth description of data
visualization, they are used primarily for either building or decomposing the
visualization object. As this is a different goal from the evaluation of data
visualizations, GoG and LGoG are only reference points. Therefore, VisQualdex
utilizes a redesigned categorization of guidelines. Furthermore, proposed
categories are complete (i.e. there is no “others” category) and disjoint (i.e.
each of the questions belongs exactly to one category).
Subjective
The objective of this category is to
incorporate any purely subjective aspects of the visualization. Although all
categories concern issues that may be answered differently depending on the
viewer, this one focuses on things exclusively related to the opinion of the
on-looker.
Theme
This category contains all visual
features and artistic choices not directly depending on data, like colors (not
related to the color scale), fonts, spacing, and any additional graphics that
are not strictly part of the chart.
Coordinates
This category is responsible for the
coordinate system and units. Its purpose is to check if all coordinates systems
(or their alternatives), units and axes are correctly prepared, provided and
presented. It also examines if the relation between shear data and all the aspects
above is consistent.
Geometry
This category includes all information
about the shapes used for data presentations (e.g., the shape itself and its
dimensions). It concerns the shape of the whole figure as well as all used
figures and any other geometrical aspects.
Guides
This category handles any text content
that appears on the visualization. It focuses only on the content, not the
display of e.g., title, legend, axes labels, additional comments, labels etc.
It verifies the most importantly the content of the text but also its clarity,
objectivity and overall necessity.
Perception
This category focuses on the general
perception of the data. It is also responsible for detecting all misuses
leading to the incorrect understanding of the data, e.g., bar charts with bars
starting at an arbitrary point to make the difference between bar length more
pronounced.
Data
This category is responsible for
evaluating issues related only to data and all the possible issues such as data
source/validity, missing data, and appropriateness of data explanations (e.g.,
used metrics).
Each category contains questions which
represent unitary criteria based on the pillars described in the beginning of
section 2. The most important features of them are:
• All questions are “yes or no” and
trigger (negative answer) only if something is incorrect.
• Questions do not
overlap or include each other.
• All questions address as general
issues as possible while focusing on one particular type of mistake. It means
that each question can be applied to any visualization regardless of factors
such as form, type, content. However, some categories are incompatible with
some visualizations by definition, e.g., a simple bar chart without any
faceting cannot be evaluated in terms of faceting.
• It is possible for one general bad practice to trigger many
questions.
• Depending on the context, a single
negative answer may have a tiny or gigantic impact on the visualization
understanding. It means that it is impossible to judge the quality of a
visualization solely by the fraction of positively answered questions.
• Literature sources support most
questions (the complete citations list available in the supplementary
materials).
VisQualdex contains a total of 60
criteria in the form of a question which address/detect different mistakes. We
present their general content in the form of the word cloud (Figure 3). The
full list of questions is available in the supplementary materials. Here, we
present and analyze a few exemplary questions.
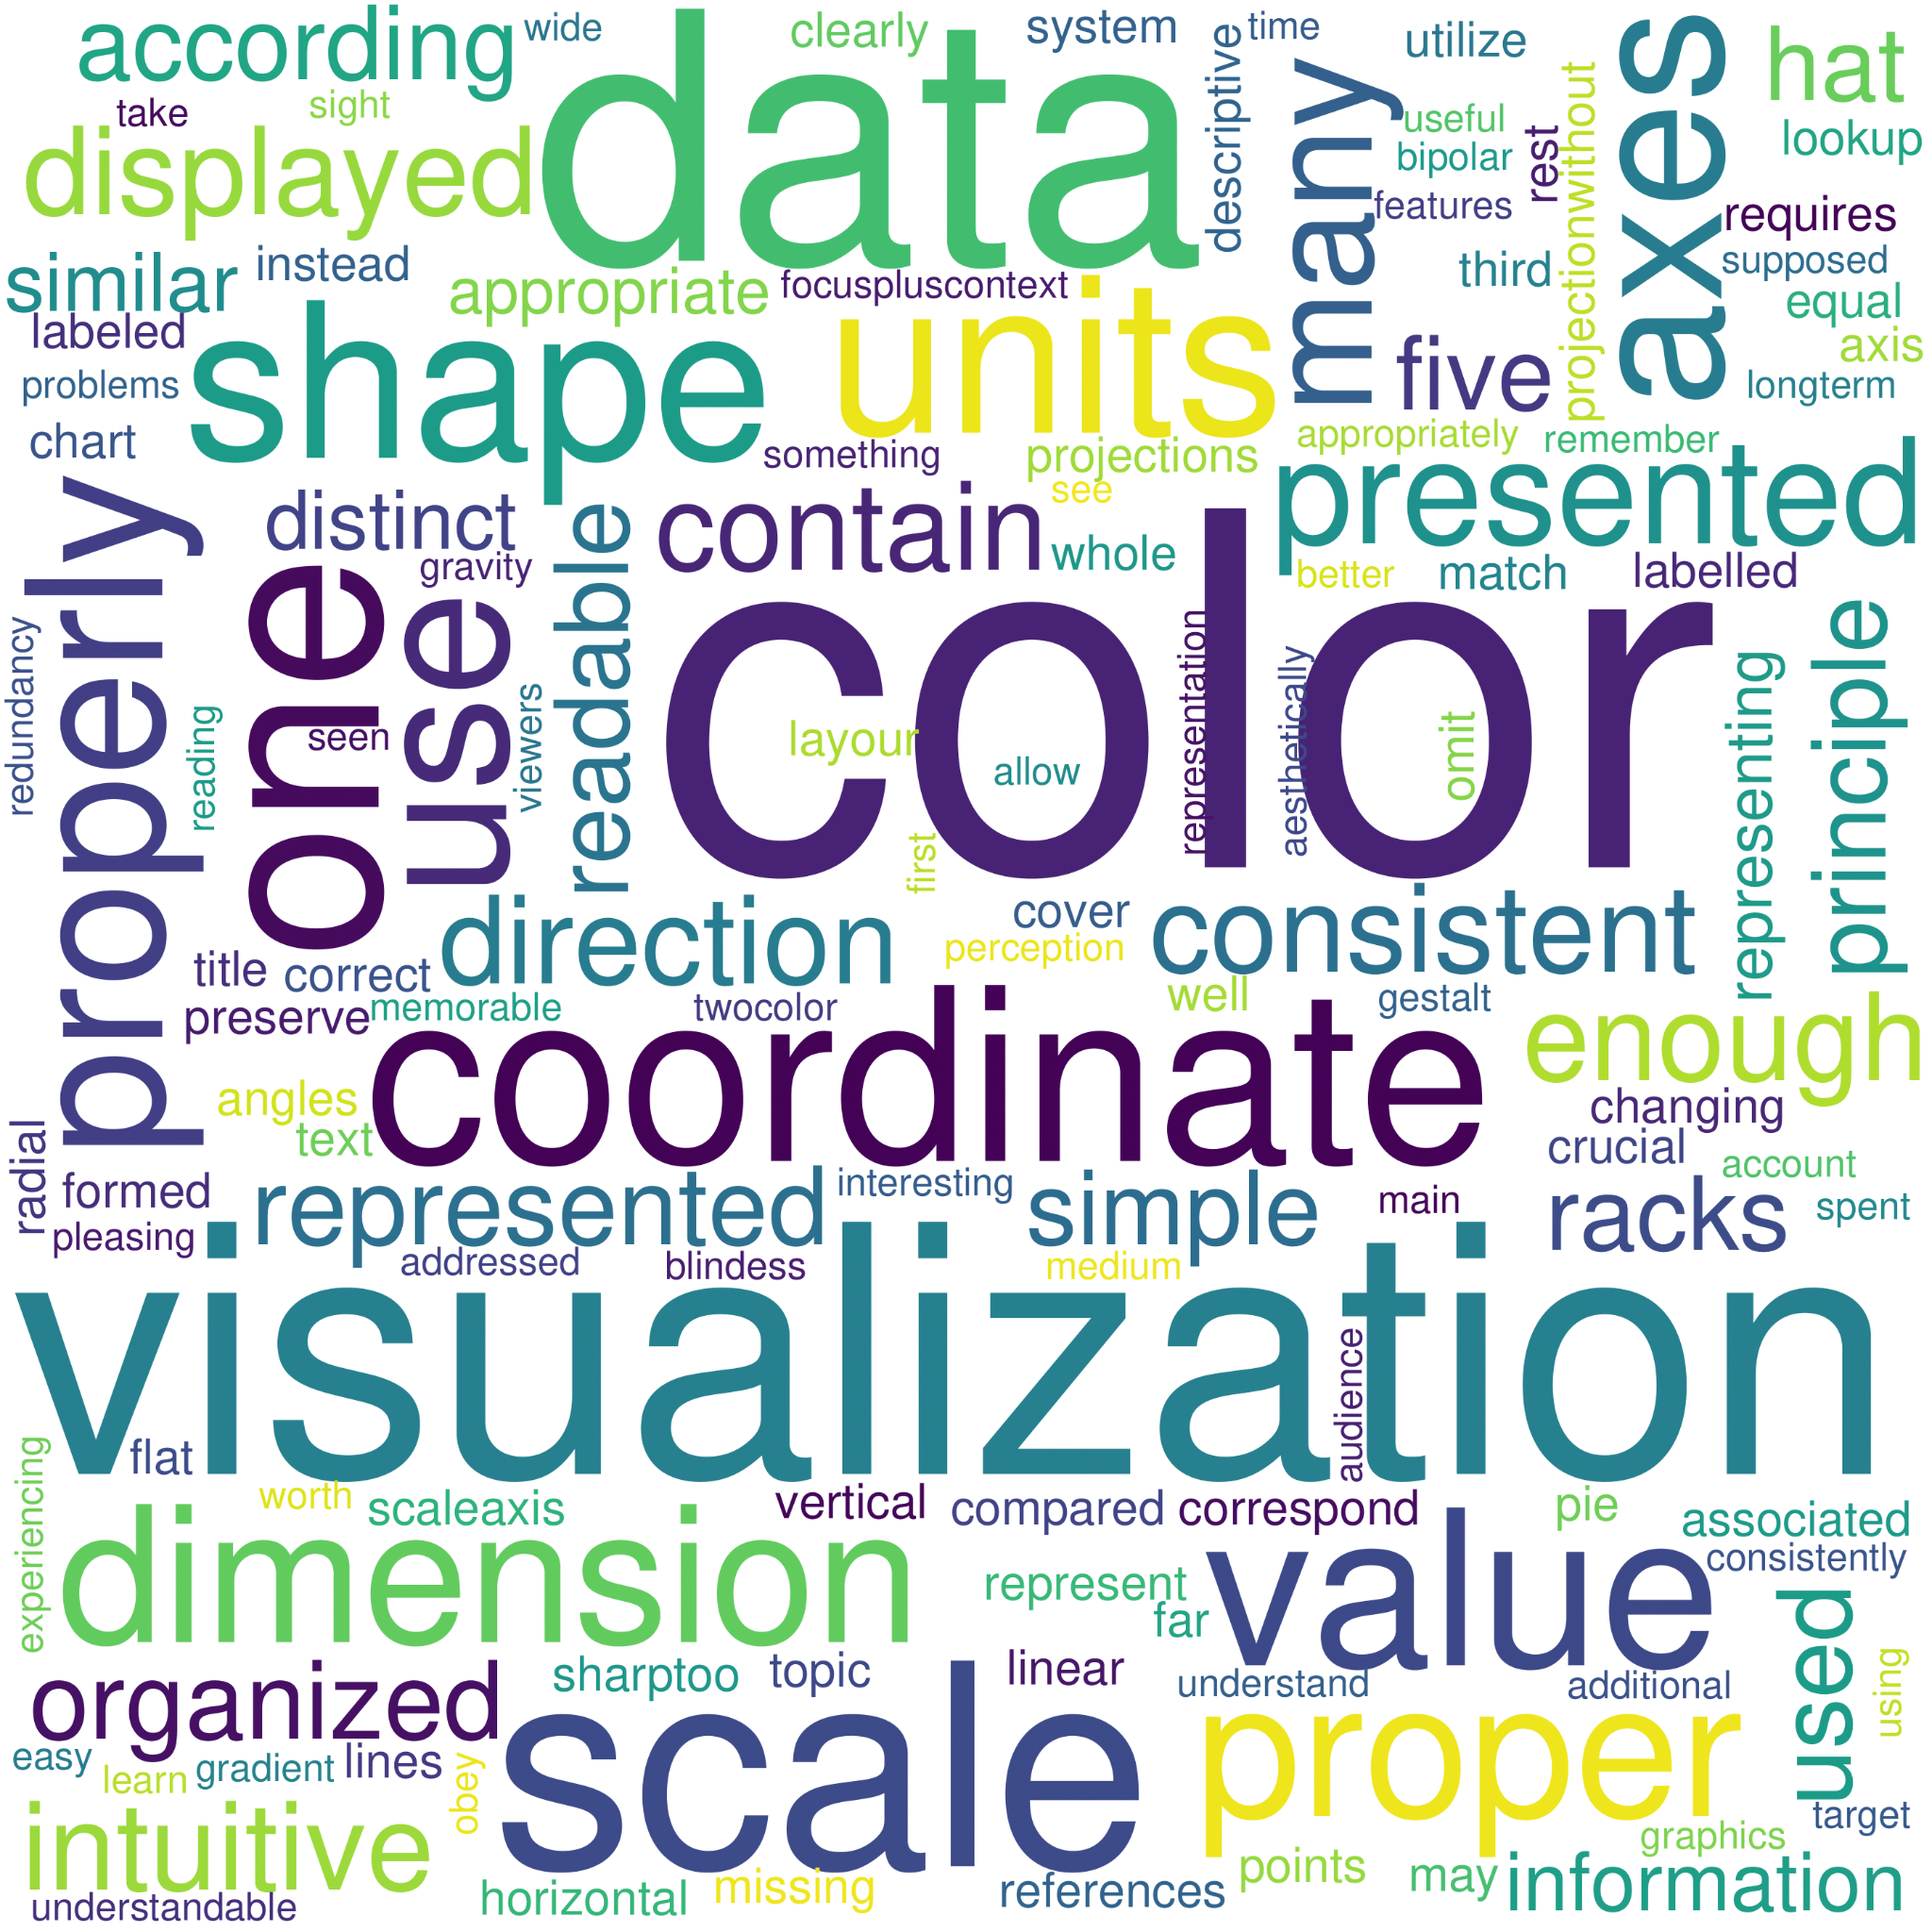
Figure 3: Wordcloud displaying most popular words used in
questions (without stopwords)
Q: "Is there not too many colors
representing the data?" In the case of gradient color scale, the
distribution of the colors should be regular. The figure 4 shows a proper
distribution of colors on a gradient scale. Even though this rule does not
touch upon the topic of the choice of colors, it is worth mentioning that other
studies [28] suggest refraining from “rainbow scale” and advise simpler/fewer
color combinations instead.
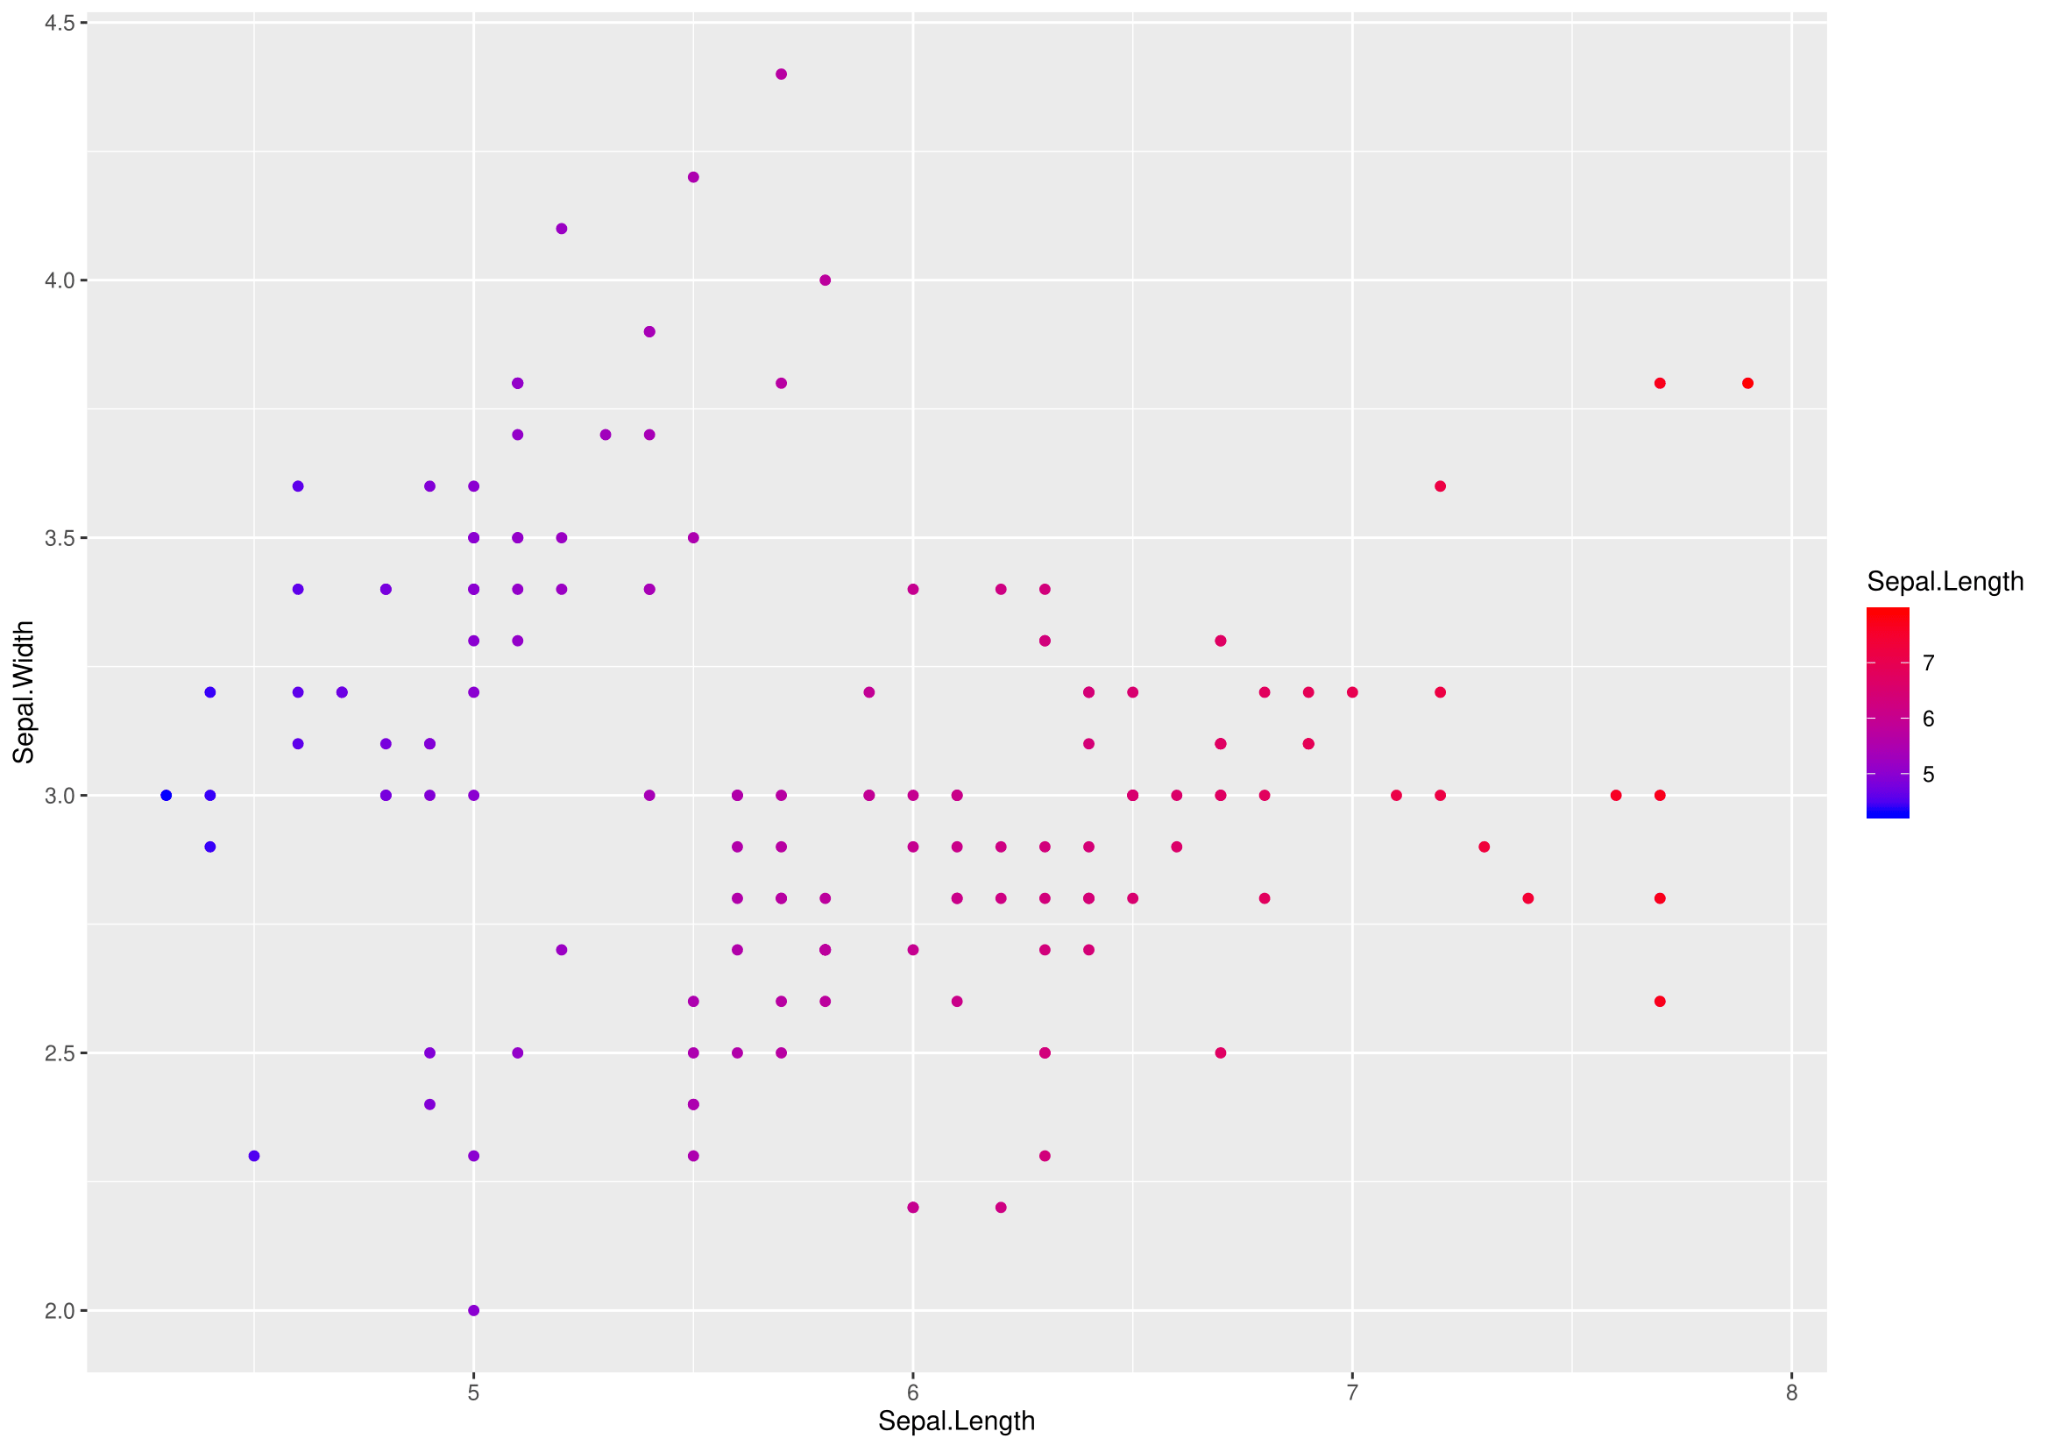
Figure 4: Example of an
equidistributed color gradient scale (using dataset Iris [29])
Q: "Does it omit or utilize
properly the third dimension?" This question focuses on minimizing the
additional dimensional complications of the visualization. According to
state-of-the-art research [30] using more than two dimensions on a
visualization may be misleading and difficult to perceive. Moreover, another
study [31] shows that interpreting angles (which appear a lot more often on 3D
graphics) has many possible vicious implications, ranging from minor “illusory
effects” distorting the viewer perception to completely hiding some data points
on the visualization. See figure 5 for a graphical example of how differently
the same angle (data point) looks due to different projections.
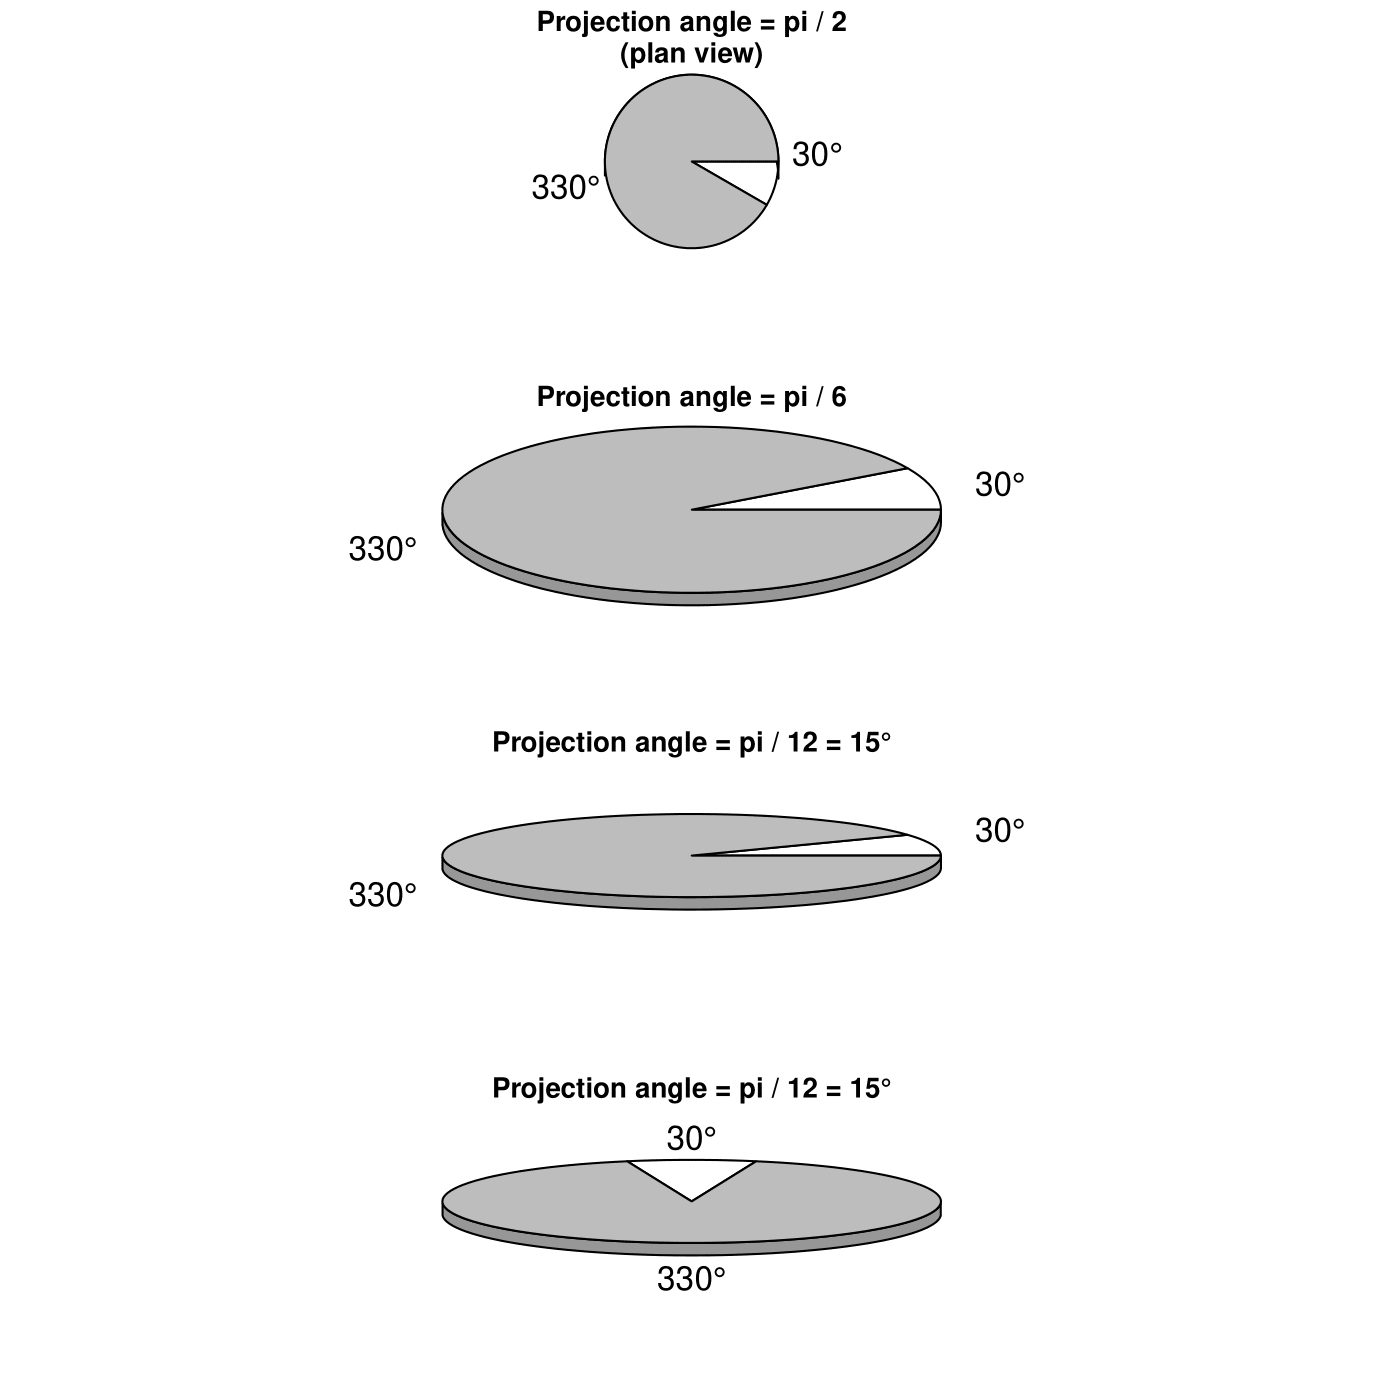
Figure 5: Example of different
angles for a 3D pie chart 8
Q: "Does the visualization obey
the reading gravity?" The concept of reading gravity [32] compre-
hensively aggregates all aspects of the order in which the viewer perceives
(reads) the visualization. It accounts for how the user reads the text of the
visualization and in what order they see the data points, sub-charts (if faceting)
and all other visuals. Although most western cultures are sinistrodextral (i.e.
read from left to right) and from top to bottom, some cultures follow different
patterns (e.g., Arabic is written right to left [33],
Hanunuo script is written bottom to top [34]).
Hence, to maintain flexibility and universality, the
question imposes general “reading gravity” instead of “left to right, top to
bottom”.
The VisQualdex has been implemented as
an easy to use online tool for data evaluation. The tool is hosted
at
https://visqual.onrender.com
and a screenshot is presented in Figure 6. The tool allows
anyone, even without advanced visualization knowledge, to upload a result of
data visualization (a picture in any common format, i.e. JPG, PNG etc.) and
evaluate it by going through all the questions. Each question has a yes or no
answer. If a question does not apply to a particular chart or a user
cannot
answer a question
because they are unsure, they can
skip it, which marks them as “NA” (Not Applicable). Moreover, most of the
questions have examples presenting good or bad practices of that question. For
example, the question “Are colors distinct?” shows a “bad example” in which the
colors are used incorrectly (i.e. continuous color scale is applied to the
categorical axis). After processing all the questions, a user can see the
report with percent of questions answered positively in each category. The
higher the percent, the better the evaluation is. Moreover, they can download a
persistent form of this report to the computer in a JSON or CSV format.
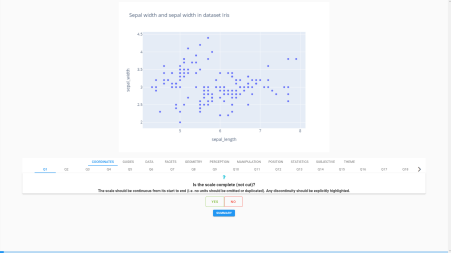
Figure 6: VisQual
website screenshot
From the technical point of view, the
website is implemented in Vue.js [35] as a single page application (SPA).
Therefore, it does not need to reload the page at any point. However, it is
responsive to changes and intuitive because it is based on the Material Design
[36]. This makes it easy to use for users without technical knowledge.
Additionally, all questions are stored in an external file, so it is possible
to hot swap any content. Finally, the whole project has been carefully
maintained using a version control system, Git [37].
The field of data visualization does
not suffer from the lack of guidelines and checklists, but rather from their
surplus and disorder. This disarray results in a situation where our checklists
are not comprehensive and thus dismiss the impact of the interaction of many
factors determining the effectiveness of visual communication [38]. VisQualdex
is the first codex (a structured set of criteria) that could be at the same
time versatile and extensive enough to cover all existing data visualizations.
Our systematic approach results in a
set of rules that constitutes a foundation for tools for data visualization
creation (e.g., Microsoft Excel, Plotly, ggplot, Matplotlib, D3, etc.) and
instruments for automatic/semi-automatic data visualization correction (e.g.,
project ReVision [39]). A principal example is the usage VisQualdex for default
settings of these tools.
One of the problems concerning
checklists is a varying level of detail. Specific points may mention at the
same time significantly narrow and very general criteria while being on the
same “level” of evaluation or even share the evaluation weight. It leads to
imbalanced evaluation, which may either allow “incorrect” visualizations to
slip through the metric or “good” visualizations to be unfairly punished for
minor mistakes. VisQualdex partially solves this problem with categories, which
guard question overlap and thematic division. However, we see it only as one of
the first steps into a comprehensive visualization ontology, focused on the
evaluation, instead of creation [40].
There are certain aspects of data
visualization that could not be included in questions due to lack of scientific
consensus and ongoing heated debate regarding the right answer. A primary
example of it is the question “Is the data-to-ink ratio rational?”. There are
respected experts like Edward Tufte [41] and others [42, 43] who favor
minimalism in data visualization and reject “chart junk” [44]). There are also
respected experts like Alberto Cairo [23] who claim that “chart junk” can be
useful [45] and claim that redundancy (e.g., highlighting in color) may help to
quicker convey the message and improve memorability [46]. Overly encumbering
the visualization with unnecessary information may lead to confusion, but
leaving as little trace of the information may also turn a visualization into a
“clue hunt” instead of quickening information perception. A similar debate
considers the “Y axis trimming” [47]. There are works claiming the
starting the Y axis from 0 is the best way [48],
while others suggest that different ranges apply in different situations [49].
These and other scientific arguments prove that data visualization is first a
still developing and lively domain and second, that it is not purely an applied
art/exact science but also fine arts/humanities. Moreover, it also implies that
the consensus regarding specific aspects of visualizing information is still
fluid and in future there will be a need to update the VisQualdex guidelines.
Finally, the current and future
techniques of image processing will make it possible to automate or
semi-automate some evaluation steps.
The following conclusions emerged from
this thorough analysis and after seeing thousands of graphs, charts or
infographics. Data visualization is a field on the border of computer science,
data science and arts [22],
which
renders it highly subjective to the bias of the creator and the viewer.
However, we believe it is possible to forge universal criteria and find a
universal standard to visualize data more understandably. VisQualdex is our
first attempt at this task.
[1] M. Friendly, “A brief history of
data visualization,” in
Handbook of data visualization,
pp. 15–56,
Springer, 2008.
[2] J. H. Kaas and P. Balaram,
“Current research on the organization and function of the visual system in
primates,”
// Eye and brain,
vol. 6, no. Suppl 1, p. 1, 2014.
[3] G. V. R. J. S. Prasad and A. Ojha,
“Text, table and graph – which is faster and more accurate to understand?,” in
2012
IEEE Fourth International Conference on Technology for Education,
pp. 126–
131, 2012.
[4] W. Weber and H. Rall, “Data
visualization in online journalism and its implications for the pro duction
process,” in
2012 16th International Conference on Information Visualisation,
pp. 349–356, IEEE, 2012.
[5] E. F. Sinar, “Data visualization,”
// Big data at work: The data science revolution and organizational
psychology,
pp. 115–157, 2015.
[6] S. Few and P. Edge, “Data
visualization: past, present, and future,”
// IBM Cognos Innovation Center,
2007.
[7] K. Catchpole and S. Russ, “The
problem with checklists,”
// BMJ Quality & Safety, vol. 24, pp. 545–
549, Sept. 2015.
[8] T. Azzam, S. Evergreen, A. A.
Germuth, and S. J. Kistler, “Data visualization and evaluation,”
// New
Directions for Evaluation, vol. 2013, no. 139, pp. 7–32, 2013.
[9] S. Tonidandel, E. B. King, and J.
M. Cortina,
Big data at work: The data science revolution and organizational
psychology.Routledge, 2015.
[10] C. Lallemand, “Les abaques
héxagonaux: Nouvelle méthode générale de calcul
graphique, avec de nombreux exemples d’application,”
// Ministère des
travaux publics, Comité du nivellement général de la
France, Paris, 1885.
[11] V. Porcu, “Matplotlib,” in
Python
for Data Mining Quick Syntax Reference, pp. 201–234, Springer, 2018.
[12] M. L. Waskom, “Seaborn:
statistical data visualization,”
// Journal of Open Source Software,
vol. 6, no. 60, p. 3021, 2021.
[13] H. Wickham, “An introduction to
ggplot: An implementation of the grammar of graphics in r,”
// Statistics,
2006.
[14] S. M. Ali, N. Gupta, G. K. Nayak,
and R. K. Lenka, “Big data visualization: Tools and challenges,” in
2016 2nd
International Conference on Contemporary Computing and Informatics (IC3I),
pp. 656– 660, IEEE, 2016.
[15] G. Palsky, “The debate on the standardization
of statistical maps and diagrams (1857-1901). ele ments of the history of
graphical semiotics,”
// Cybergeo: European Journal of Geography, 1999.
[16] “Joint committee on standards for
graphic presentation,”
// Publications of the American Statistical
Association, vol. 14, no. 112, pp. 790–797, 1915.
[17] S. Evergreen and A. K. Emery, “Data visualization checklist,”
2016.
[18] B. D. I. Team, “Data
visualization checklist,”
// Berkley Business Process Management, pp.
1–4, 2020.
[19] M. Scriven, “The logic and methodology of checklists,” 2000.
[20] D. McKie, “Data visualization
checklist.” (http://www.davidmckie.com/infogram-data
visualization-checklist.pdf), accessed 2020.
[21] E. Grigg, “Smarter clinical
checklists: how to minimize checklist fatigue and maximize clinician
performance,”
// Anesthesia & Analgesia, vol. 121, no. 2, pp.
570–573, 2015.
[22] M. Mirahan-Farag, “Chapter
fourteen the segregation of applied arts from fine arts and the status of
fashion,”
// An Anthology of Philosophical Studies Volume 7, p. 145.
[23] A. Cairo,
The Functional Art:
An introduction to information graphics and visualization.New Riders,
2012.
[24] U. Engelke, A. Abdul-Rahman, and
M. Chen, “Visupply: A supply-chain process model for visual ization
guidelines,” in
2018 International Symposium on Big Data Visual and
Immersive Analytics (BDVA), pp. 1–9, IEEE, 2018.
[25] A. Diehl, M. Kraus, A. Abdul-Raman,
M. El-Assady, B. Bach, R. S. Laramee, D. Keim, and M. Chen, “Studying
visualization guidelines according to grounded theory,”
// arXiv preprint
arXiv:2010.09040, 2020.
[26] L. Wilkinson, “The grammar of
graphics,” in
Handbook of computational statistics, pp. 375–414,
Springer, 2012.
[27] H. Wickham, “A layered grammar of
graphics,”
// Journal of Computational and Graphical Statis tics, vol.
19, no. 1, pp. 3–28, 2010.
[28] B. E. Rogowitz, A. D. Kalvin, A.
Pelah, and A. Cohen, “Which trajectories through which per ceptually uniform
color spaces produce appropriate colors scales for interval data?,” in
Color
and Imaging Conference, vol. 1999, pp. 321–326, Society for Imaging Science
and Technology, 1999.
[29] R. A. Fisher, “The use of
multiple measurements in taxonomic problems,”
// Annals of eugenics,
vol. 7, no. 2, pp. 179–188, 1936.
[30] E. Bertini, N. Elmqvist, and T.
Wischgoll, “Judgment error in pie chart variations,” in
Proceedings of the
Eurographics/IEEE VGTC conference on visualization: Short papers, pp.
91–95, 2016.
[31] W. S. Cleveland and R. McGill,
“Graphical perception and graphical methods for analyzing scientific data,”
//
Science, vol. 229, no. 4716, pp. 828–833, 1985.
[32] C. Wheildon, D. Ogilvy, and G.
Heard,
Type & Layout: Are You Communicating Or Just Making Pretty Shapes.
Kickstarting Business Series, Worsley Press, 2005.
[33] T. R. Jordan, A. A. Almabruk, E.
A. Gadalla, V. A. McGowan, S. J. White, L. Abedipour, and K. B. Paterson,
“Reading direction and the central perceptual span: Evidence from arabic and
english,”
// Psychonomic bulletin & review, vol. 21, no. 2, pp.
505–511, 2014.
[34] Y. J. S. Epo,
Discourse
analysis of suyot: a Hanunuo-Mangyan folk narrative.PhD thesis, Citeseer,
2014.
[35] “Vue.js – the progressive
javascript framework v3.0..” (https://vuejs.org/guide/ introduction.html),
2014.
[36] Google Inc., “Material design lite,” 2015.
[37] D. Spinellis, “Git,”
// IEEE Software, vol. 29, no. 3,
pp. 100–101, 2012.
[38] E. Kandogan and H. Lee, “A
grounded theory study on the language of data visualization principles and
guidelines,”
// Electronic Imaging, vol. 2016, no. 16, pp. 1–9, 2016.
[39] M. Savva, N. Kong, A. Chhajta, L.
Fei-Fei, M. Agrawala, and J. Heer, “Revision: Automated classification,
analysis and redesign of chart images,” in
Proceedings of the 24th Annual
ACM Sym posium on User Interface Software and Technology, UIST ’11, (New
York, NY, USA), p. 393–402, Association for Computing Machinery, 2011.
[40] D. J. Duke, K. W. Brodlie, and D.
A. Duce, “Building an ontology of visualization,” in
IEEE Visualization 2004,
pp. 7p–7p, IEEE, 2004.
[41] E. R. Tufte, N. H. Goeler, and R.
Benson,
Envisioning information, vol. 2. Graphics press Cheshire, CT,
1990.
[42] K. McGurgan,
Data-ink ratio
and task complexity in graph comprehension.Rochester Institute of
Technology, 2015.
[43] O. Inbar, N. Tractinsky, and J.
Meyer, “Minimalism in information visualization: attitudes to wards maximizing
the data-ink ratio,” in
Proceedings of the 14th European conference on
Cognitive ergonomics: invent! explore!, pp. 185–188, 2007.
[44] M. A. Gatto, “Making research
useful: Current challenges and good practices in data visualisation,” 2015.
[45] H. Li and N. Moacdieh, “Is “chart
junk” useful? an extended examination of visual embellishment,” in
Proceedings
of the Human Factors and Ergonomics Society Annual Meeting, vol. 58, pp.
1516–1520, Sage Publications Sage CA: Los Angeles, CA, 2014.
[46] S. Bateman, R. L. Mandryk, C.
Gutwin, A. Genest, D. McDine, and C. Brooks, “Useful junk? the effects of
visual embellishment on comprehension and memorability of charts,” in
Proceedings
of the SIGCHI conference on human factors in computing systems, pp.
2573–2582, 2010.
[47] M. Correll, E. Bertini, and S.
Franconeri, “Truncating the y-axis: Threat or menace?,” in
Proceedings of
the 2020 CHI Conference on Human Factors in Computing Systems, pp. 1–12,
2020.
[48] L. King, “Preparing better graphs,”
// Journal of Public
Health and Emergency, vol. 2, no. 1, 2018.
[49] J. K. Witt, “Graph construction:
An empirical investigation on setting the range of the y-axis,”
//
Meta-psychology, 2019.
1.1 Coordinates
1 Do the units match their values?
[17]
2 Are the coordinates changing in the
intuitive direction? [18]
3 Does the scale cover the whole data?
[17]
See Figure 1.1 with a good example.
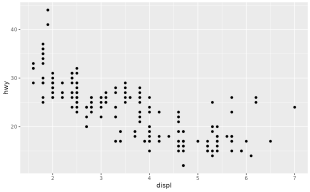
Figure 1.1: Good
example for question 31
4 Is there a scale/axis? [17]
See Figure 1.2 with a bad example.

Figure 1.2: Bad
example for question 4
5 Is there enough axes or value
references? [17]
See Figure 1.3 with a bad example.
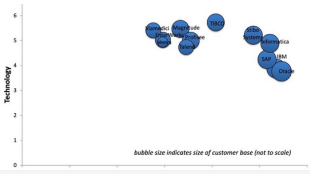
Figure 1.3:
Bad example for question 5
6 Is there no more than one scale in
one dimension? [7]
See Figure 1.4 with a bad example.
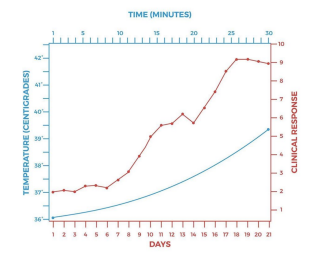
Figure 1.4: Bad
example for question 6
7 Are the units properly displayed?
[17]
See Figure 1.5 with a bad example.
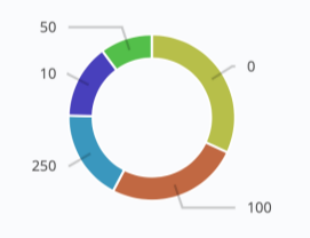
Figure 1.5: Bad
example for question 7
8 Does it use the proper coordinate
system? [17]
See Figure 1.6 with a bad example.
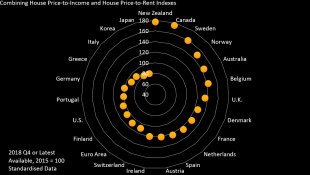
Figure 1.6: Bad
example for question 8
9 Are the coordinates consistent? [17]
See Figure 1.7 with a bad example.
Figure 1.7: Bad
example for question 9
10 Are the coordinates units equal?
[17]
See Figure 1.8 with a bad example.
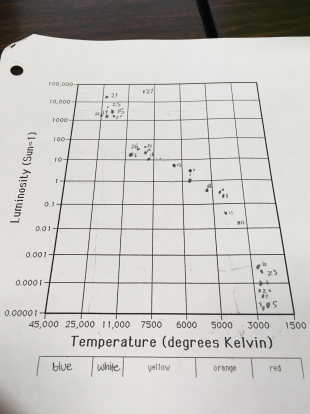
Figure 1.8: Bad
example for question 10
11 Is each axis in one dimension? [17]
See Figure 1.9 with a bad example.
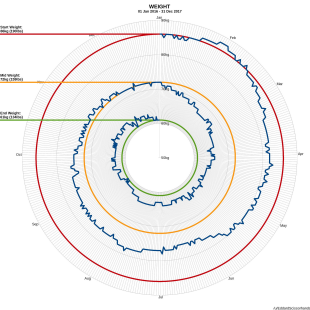
Figure 1.9: Bad
example for question 11
12 Do the coordinates correspond to
the rest of the visualization? [17]
13 Are the units displayed clearly?
[17]
See Figure 1.10 with a bad example.
Figure 1.10: Bad
example for question 13
1.2 Data
14 Does it contain any data? [17]
See Figure 1.11 with a bad example.

Figure 1.11: Bad example
for question 14
15 Is the data correct? [17]
16 Is missing data represented? [17]
17 Is the data organized according to
five hat racks? [10]
1.3 Position
18 Does it omit or utilize properly
the third dimension? [2]
See Figure 1.12 with a bad example.
Figure 1.12: Bad
example for question 18
1.4 Geometry
19 Are the shapes associated with the
topic? [13]
See Figure 1.13 with a good example.
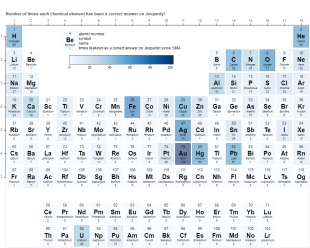
Figure 1.13: Good
example for question 192
20 Do the shapes represent the data in
proper scale? [17]
See Figure 1.14 with a bad example.
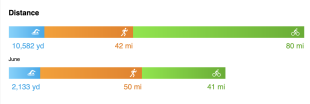
Figure 1.14: Bad
example for question 20
21 Does it use linear layour instead
of radial if it requires value lookup? [6]
1.5 Perception
22 If there are lines which may be
compared with each other are they far from being horizontal or vertical? [5]
23 Are all 2D shapes presented in a
simple projection/without projections? [9]
24 Are used pie chart simple? [2]
1.6 Position
25 Are angles not to sharp/too flat?
[5]
1.7 Guides
26 Are the axes labeled? [15]
See Figure 1.15 with a bad example.
Figure 1.15: Bad
example for question 26
27 Are all crucial data points
labelled? [17]
See Figure 1.16 with a bad example.
Figure 1.16: Bad
example for question 27
28 Is all text readable? [17]
See Figure 1.17 with a bad example.
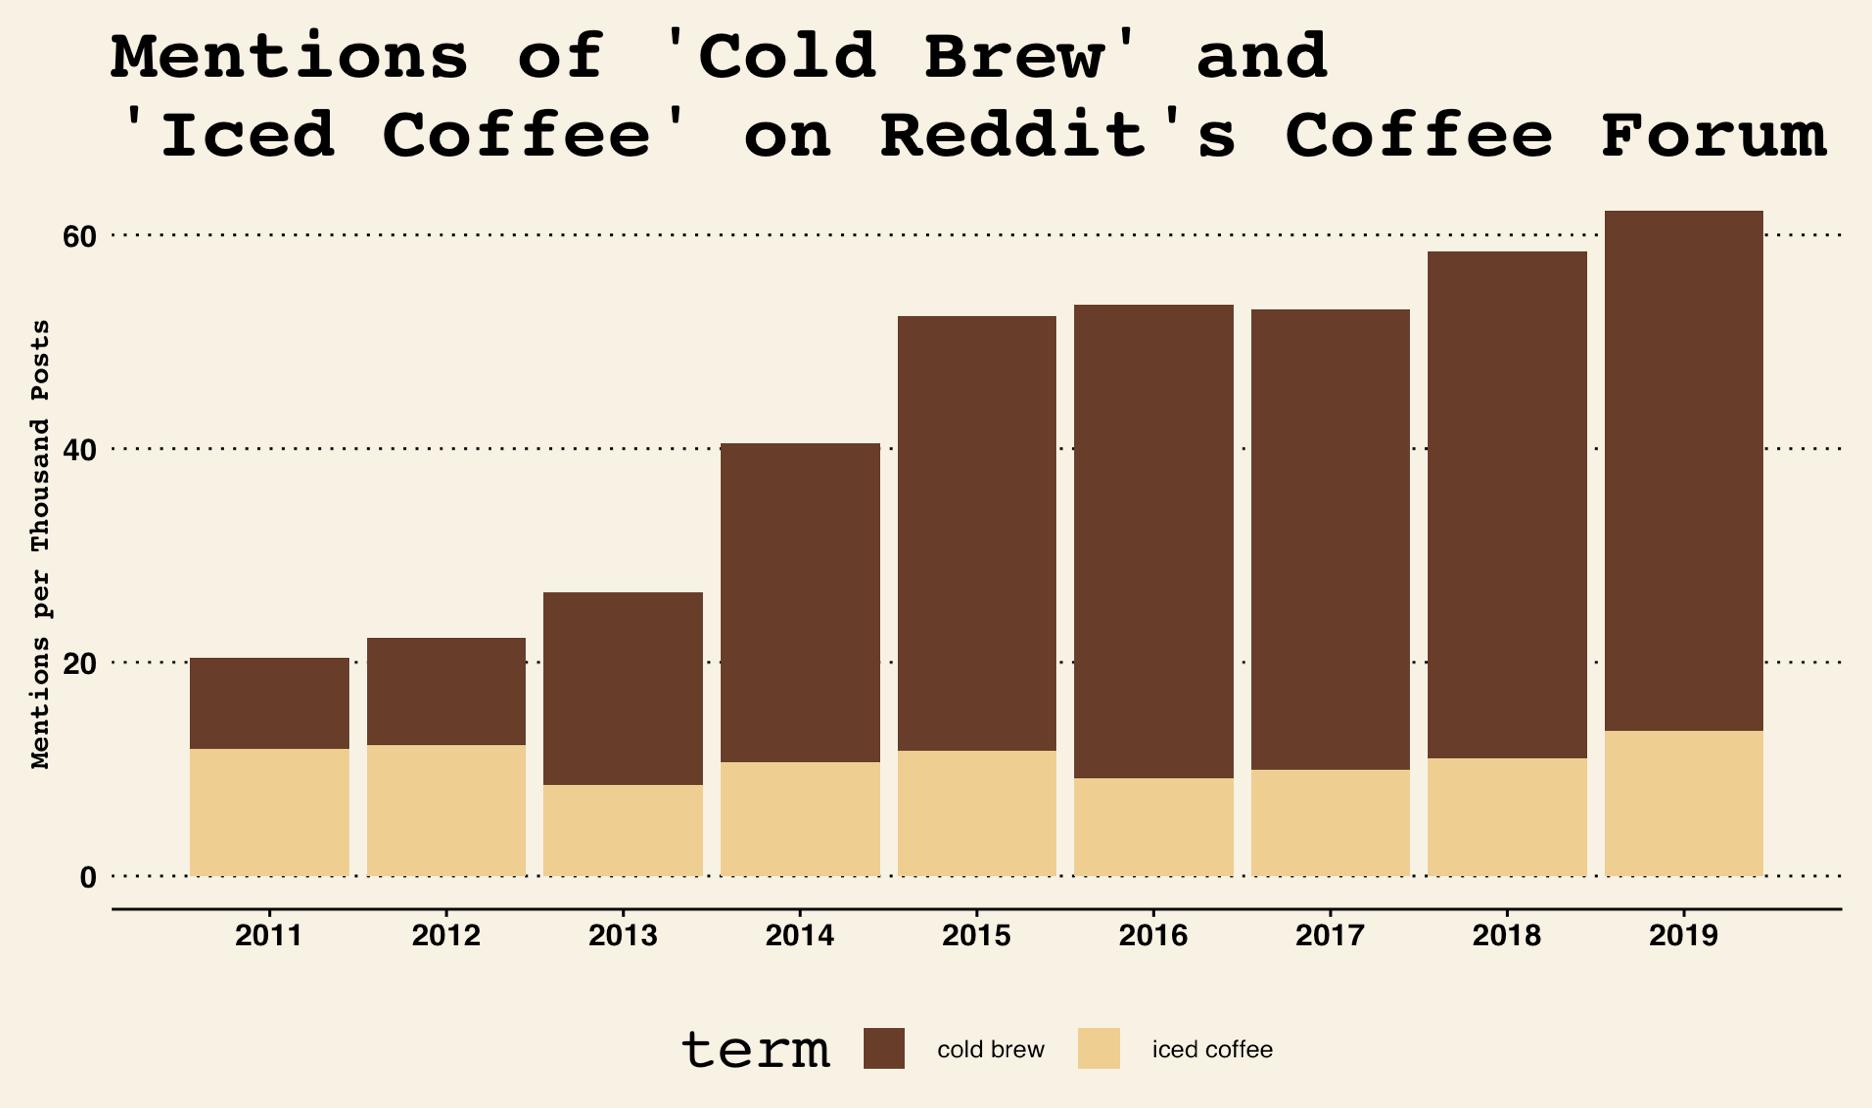
Figure 1.17: Bad
example for question 28
29 Is the title descriptive and well
formed? [3]
1.8 Facets
30 Does it preserve the
focus-plus-context principle? [4]
See Figure 1.18 with a good example.
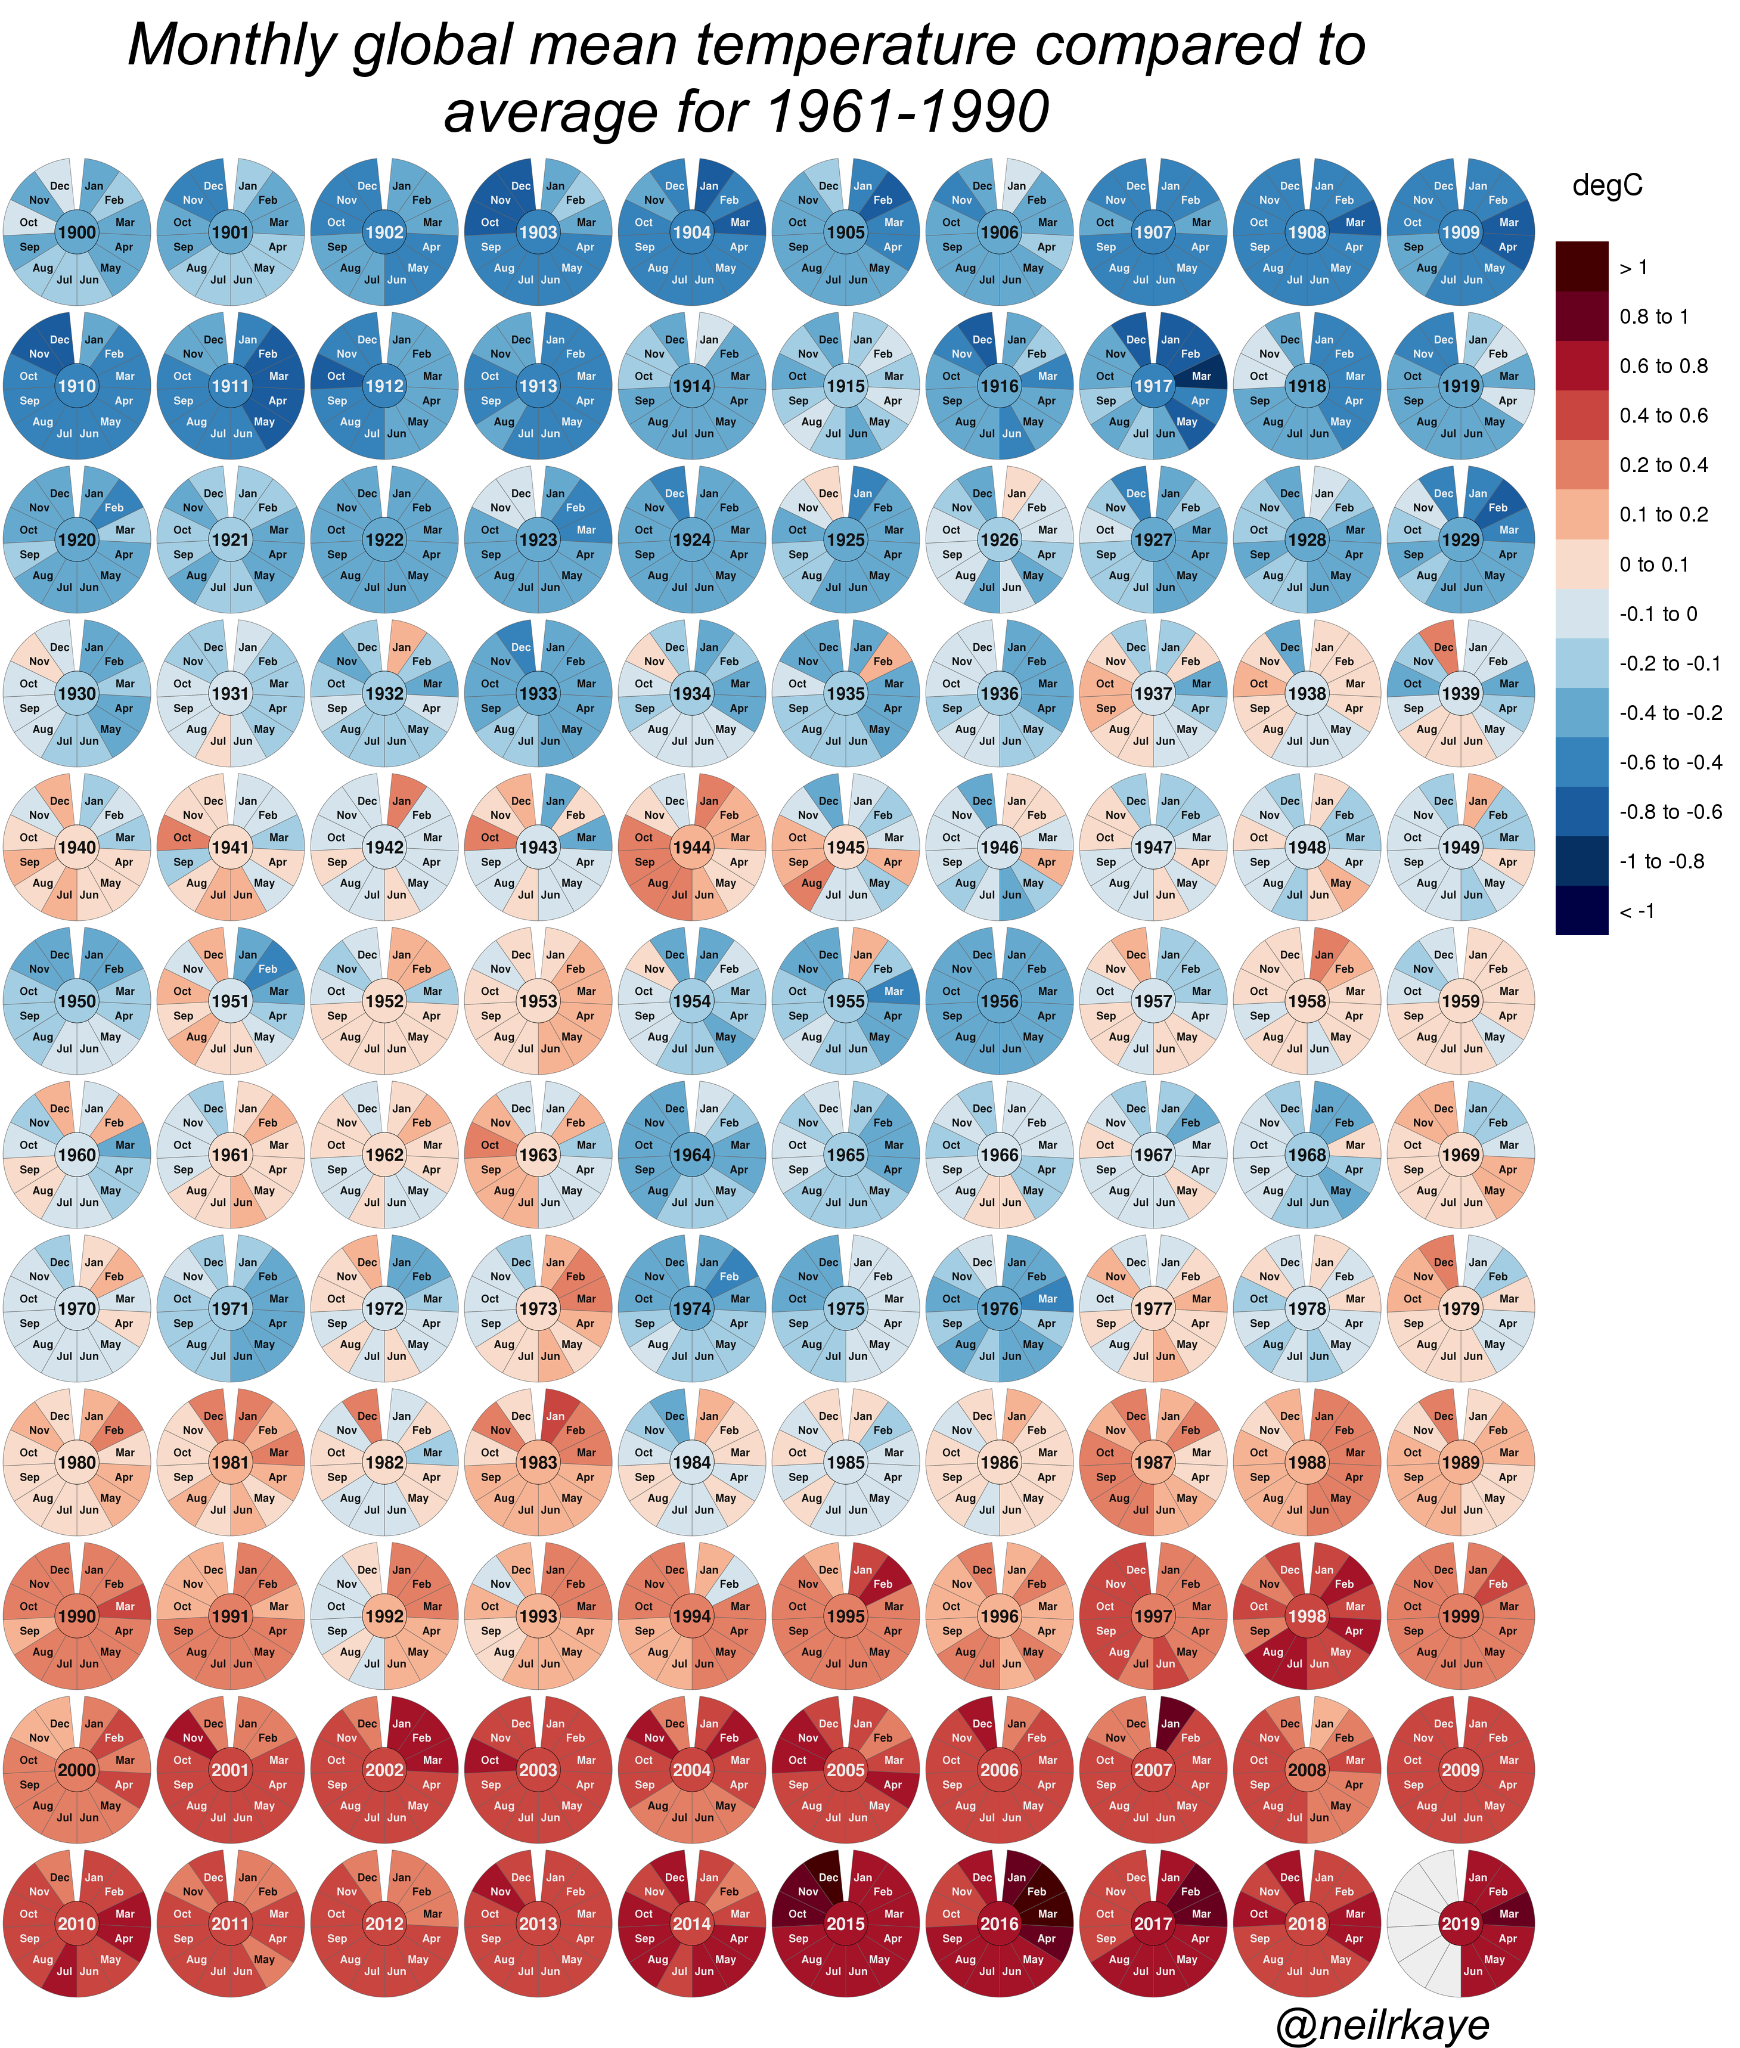
Figure 1.18: Good
example for question 303
1.9 Perception
31 Is the data memorable after the
first sight? [3]
32 Are the main features of the data
easy to remember long-term? [3]
33 Does the visualization obey the
reading gravity? [18]
34 Is the information organized
according to five hat racks? [10]
See Figure 1.19 with a good example.
Figure 19: Good
example for question 344
35 Are all axes’ directions and shape
proper? [18]
1.10 Manipulation
36 Does it take into account the
gestalt principles of perception [8]
37 Is redundancy used appropriately
and consistently? [3]
38 Is the visualization addressed
properly to target audience? [15]
1.11 Subjective
39 Is this visualization better than
similar ones that you have seen?
40 Did you learn something from this
visualization?
41 Is the visualization aesthetically
pleasing? [10]
42 Is the presented information
useful?
43 Was the time spent experiencing the
visualization worth it?
44 Would you like to see a
visualization similar to this one?
45 Do you understand the
visualization?
46 Do you like it?
47 Is this visualization interesting?
1.12 Theme
48 Are colors distinct? [16]
See Figure 1.20 with a bad example.
Figure 1.20: Bad
example for question 48
49 Is the use of colors appropriate?
[14]
See Figure 1.21 with a bad example.
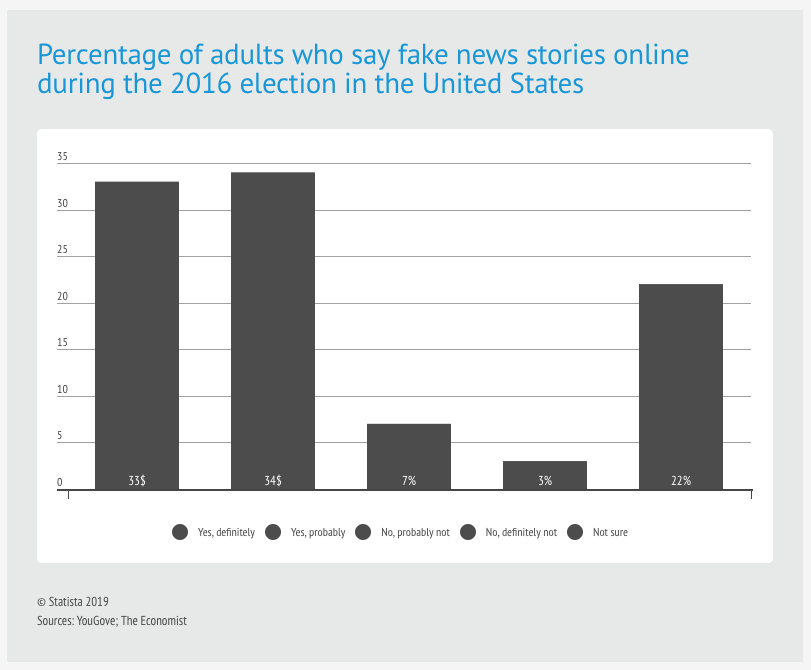
Figure 1.21: Bad
example for question 49
50 Are bipolar problems represented
using two-color scale? [16]
51 Are color values on color scale
consistent with their representation? [16]
52 Does it contain additional
graphics? [3]
See Figure 1.22 with a good example.
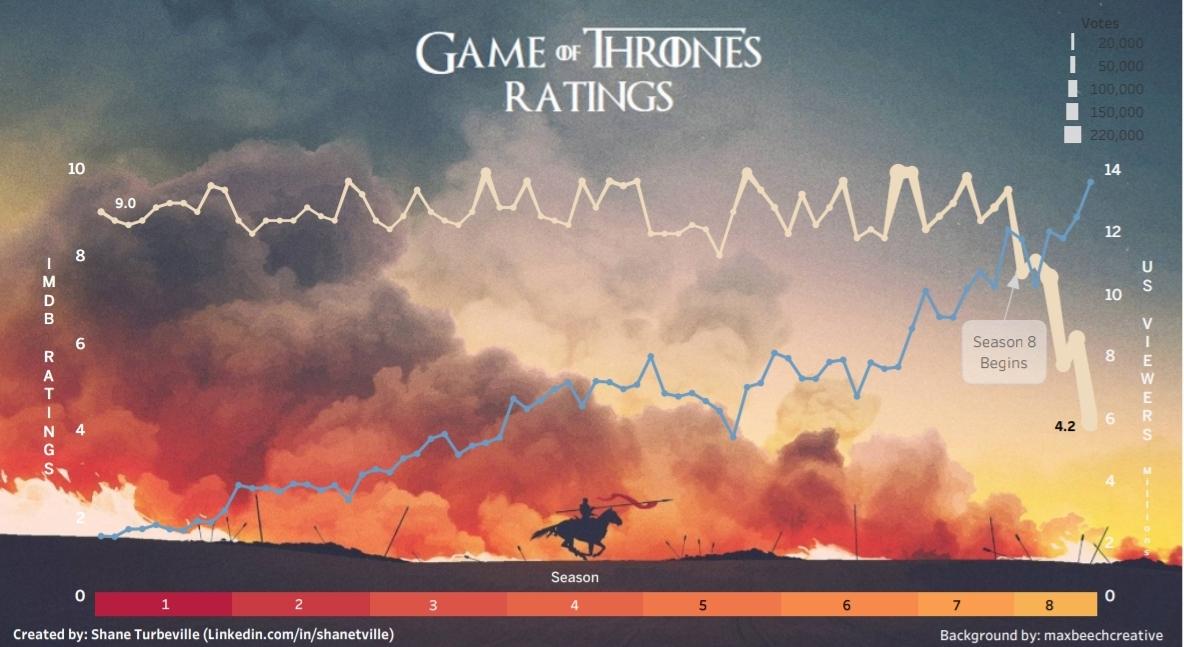
Figure 22: Good
example for question 525
53 Are there not too many colors? [16]
54 Are the colors intuitive? [11]
See Figure 1.23 with a bad example.
Figure 1.23: Bad
example for question 54
55 Is the gradient scale wide enough
to allow distinct colors? [11]
See Figure 1.24 with a good example.
Figure 1.24: Good
example for question 556
56 Are colors readable on the medium
that the visualization is supposed to be presented on? [15]
See Figure 1.25 with a bad example.
Figure 1.25: Bad
example for question 56
57 Are the colors understandable for
viewers with color blindess? [1]
58 Is color scale appropriate? [15]
59 Is there not too many colors
representing the data? [12]
60 Is there not too many colors
representing the data? [12]
The questions have been built using
among others the following sources:
References
[1] Basaeir Y Ahmed, Zainab H Majeed,
and Safa A Najim. Applying the visualization technique to solve the human color
blindness. In
AIP Conference Proceedings, volume 2290, page 040008. AIP
Publishing LLC, 2020.
[2] Enrico Bertini, Niklas Elmqvist,
and Thomas Wischgoll. Judgment error in pie chart variations. In
Proceedings
of the Eurographics/IEEE VGTC conference on visualization: Short papers,
pages 91–95, 2016.
[3] Michelle A Borkin, Zoya Bylinskii,
Nam Wook Kim, Constance May Bainbridge, Chelsea S Yeh, Daniel Borkin, Hanspeter
Pfister, and Aude Oliva. Beyond memorability: Visualization recognition and
recall.
IEEE transactions on visualization and computer graphics,
22(1):519– 528, 2015.
[4] Mackinlay Card.
Readings in
information visualization: using vision to think.Morgan Kaufmann, 1999.
[5] William S Cleveland and Robert
McGill. Graphical perception and graphical methods for analyzing scientific
data.
Science,
229(4716):828– 833, 1985.
[6] Joseph Goldberg and Jonathan
Helfman. Eye tracking for visualization evaluation: Reading values on linear
versus radial graphs.
Information visualization, 10(3):182–195, 2011.
[7] Petra Isenberg, Anastasia
Bezerianos, Pierre Dragicevic, and Jean Daniel Fekete. A study on dual-scale
data charts.
IEEE Transactions on Visualization and Computer Graphics,
17(12):2469–2478, 2011.
[8] Koponen, Juuso, and Jonatan
Hildén. Data visualization handbook. Aalto
korkeakoulusäätiö, 2019.
[9] Robert Kosara. Evidence for area
as the primary visual cue in pie charts. In
2019 IEEE Visualization
Conference (VIS), pages 101–105. IEEE, 2019.
[10] William Lidwell, Kritina Holden,
and Jill Butler.
Universal principles of design, revised and updated: 125
ways to enhance usability, influ ence perception, increase appeal, make better
design decisions, and teach through design.Rockport Pub, 2010.
[11] Sharon Lin, Julie Fortuna,
Chinmay Kulkarni, Maureen Stone, and Jef frey Heer. Selecting
semantically-resonant colors for data visualization. In
Computer Graphics
Forum, volume 32, pages 401–410. Wiley Online Library, 2013.
[12] Vinh T Nguyen, Kwanghee Jung, and
Vibhuti Gupta. Examining data visualization pitfalls in scientific
publications.
Visual Computing for Industry, Biomedicine, and Art,
4(1):1–15, 2021.
[13] Don Norman.
Things that make
us smart: Defending human attributes in the age of the machine.Diversion
Books, 2014.
[14] Christine Nothelfer, Michael
Gleicher, and Steven Franconeri. Redun dant encoding strengthens segmentation
and grouping in visual displays of data.
Journal of Experimental Psychology:
Human Perception and Performance, 43(9):1667, 2017.
[15] Nicolas P Rougier, Michael
Droettboom, and Philip E Bourne. Ten sim ple rules for better figures.
PLoS
computational biology, 10(9): e1003833, 2014.
[16] Maureen Stone. Choosing colors
for data visualization.
Business Intel ligence Network, 2, 2006.
[17] Edward R Tufte. The visual
display of quantitative information.
The Journal for Healthcare Quality
(JHQ), 7(3):15, 1985.
[18] Colin Wheildon and Geoffrey Heard.
Type & layout: Are you communicating or just making pretty shapes. Worsley
Press, 2005.
