In the modern world with widely
and actively developing technologies, there is a high interest in the
development of supersonic aircraft both in the military and in the civil
aviation. In particular, an important task of aerodynamics is to study a pair
of tip vortices, since various vortex structures are formed during the flight
of any aircraft on the edges of various aircraft elements, including wings. The
vortex wake hazard of any aircraft for the following aircraft is well known
[1]. Furthermore, a vortex wake risk to get on other downstream elements of the
aircraft especially in the supersonic modes. It can also get fall into
combustion chamber of propulsion system [2]. All of the above can affect the
movement and control of the aircraft up to the complete loss of its control. Subsonic
tip vortices have been studied quite well, while supersonic vortices need
further study under various regimes.
Special visualization methods
of vortex flows, in particular, are used for post-processing, analysis and comparison
of the obtained data. The corresponding extensive reviews were made, for example,
in [3-7].
In this paper the comparing results
of supersonic tip vortex pair propagation by the scientific visualization
methods are presented. Two pair configurations were considered: counter-rotating
and co-rotating. The method of maximum vorticity and the
λ2
criterion for visualization of vortex structures were used in the process of
analysis and comparison.
The authors are engaged in a
comprehensive study of the particular problem - the problem of propagation,
development and interaction of supersonic tip vortices. Scientific
visualization methods are one of the tools used by the authors in their work,
and not the subject of study. For the first time, the authors used the methods
of scientific visualization in [8]. Thus, the authors do not aim to compare and
study the methods of scientific visualization, but only apply them in their
research.
Of course, scientific
visualization is an important stage of data research, allowing for their
analysis. However, do not forget about the limitations associated with the use
of scientific visualization methods. Below we will give an example of data,
when the application of the already mentioned
λ2
method,
as well as the
Q
method leads to the appearance of an
"artifact" vortex and gives a false picture of the flow.
Visualization methods were used
to perform a comparative analysis of data obtained by numerical modeling of a counter-
and co-rotating supersonic vortex pair at the Mach number of the incoming flow
M∞
= 3. The attack angles of the wing-generators to the
incoming flow for the case of counter rotation were 10°, and for the case of
co-rotation, the attack angle of the one wing was 10°, and of the other was -10°.
The flow behind two coaxial
wings with sharp leading, trailing, and side edges and with a diamond-shaped
base was numerically investigated and compared (fig.1). The wings were attached
by the base to the walls which are parallel to the flow direction. The model configuration
of the case of a counter-rotating pair completely coincides with the one
described in [9]. The model configuration for the case of a co-rotating pair differs
by rotating one of the generator wings to the position -10 ° to the incoming
flow (wing 1 was rotated, fig.1).
A
unit of length
was taken
L
= 1 m. Density and pressure were non-dimensionalized
by its free
stream values [10]. The dimensions of the numerical domain were as follows:
Lx
= 0.35,
Ly
= 0.225 and
Lz
= 0.2. The
geometry of the used wings was the same for the both configurations considered:
the chord of each wing was equal to
b
= 0.03, half-span of the first
wing was
l1
= 0.075, of the second one was
l2
= 0.095. The thickness of the diamond-shaped base of the both wings was equal
to
h
= 0.004. The distance between the tip chords of the wings was
l3
=0.03. So the width of the area between the walls was
H
= 0.2.
The
x
axis was co-directed to the incoming flow. The
z
axis
coincided with the common axis of the wings. The
y
axis was directed
from the leeward side of the wings to the windward side (it implies the sides
of the counter-rotation case or of the second wing, the rotation of which
remains unchanged for both considered cases). The length of the numerical
domain under consideration was up to 10 wing chords downstream from the common
axis of the wings. The Reynolds number in simulation was ReL
= 1 ×
107.
Numerical modeling was carried
out on the supercomputer K-60 at the Keldysh Institute of Applied Mathematics
of the Russian Academy of Sciences [11] using the software package ARES developed
by the authors [12] for calculating three-dimensional turbulent flows of
viscous compressible gas on high-performance computing systems. The numerical
method is based on the solution of unsteady Reynolds averaged Navier-Stokes
equations (URANS) with the Spalart-Allmaras turbulence model [13, 14]. The
finite volume method was used with reconstructions of the 2nd (TVD) and of the
3rd (WENO) orders for space discretization of the equations. The temporal
approximation was performed on the basis of an explicit scheme. The numerical
algorithms are described in more details in [15]. An unstructured hexagonal mesh
was used for simulations. The mesh consisted of 25,774,200 cells for the case
of a counter-rotating vortex pair and of 35,763,750 for a co-rotating pair. The
mesh was fined in the zone of vortices formation and propagation for better
resolution of vortex structures. The difference in the number of cells is due
to the mesh rearrangement and to the fact that in the first considered case
mesh refinement was carried out on one side of the wings, and in the second –
on both sides according to the location of the tip vortices. Simulations were
carried out on 224 processors.
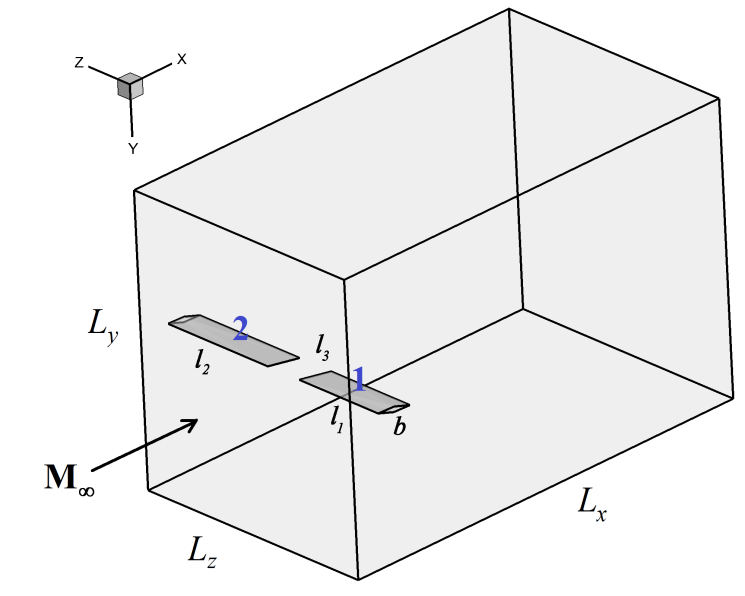
Figure 1.
General model scheme:
counter-rotating case
A separate post-processing data
simulation module was developed for determining, in particular, vortex
structures for hexagonal grids within the developed software package. Same
scientific visualization methods were fully implemented in it. Among them, the maximum
vorticity method and the
λ2
method are realized. The
module generates data of vortex structures in the format of the Tecplot
software package, which is used for further visualization of numerical simulation
results.
Despite the fact that there is
still no unambiguous definition of a vortex [7, 16, 17], the definition of a
vortex as the rotational motion of matter particles around the center is
intuitively clear. The measure of this movement is the vorticity. The vorticity
of the flow is defined as the vector product
 that
is the curl of velocity
u.
that
is the curl of velocity
u.
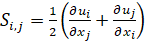
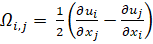
The velocity gradient tensor
 can
be decomposed into symmetric and antisymmetric parts like
can
be decomposed into symmetric and antisymmetric parts like
 ,
,
 ,
,
 ,
,
where
S
and
Ω
are the strain-rate and vorticity tensors of the flow respectively.
The
λ2-method
(or criterion) of vortex identification was proposed in [18]. According to this
criterion, the vortex flow region is determined based on the analysis of the
eigenvalues of the always real symmetric matrix
 .
.
According to this method the
vortex region is considered to be the part of space in which the second
eigenvalue
 (
(
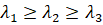 ). This method is quite widespread and
is often used in data processing. Under adiabatic conditions, this criterion
guarantees an instantaneous pressure minimum in a two-dimensional flow [16].
). This method is quite widespread and
is often used in data processing. Under adiabatic conditions, this criterion
guarantees an instantaneous pressure minimum in a two-dimensional flow [16].
The maximum vorticity method
was proposed in [19]. It is based on one of the definitions of vortex flow and
consists in detection the local maximum of the vorticity vector modulus
|ω| =
|∇
×
u|
in
the plane which is perpendicular to the direction of this vector. This method
allows to determine the exact axis of the streamwise vortex in the case of
sufficient resolution of the computational mesh.
In this part of the paper the
results of the analysis and comparison of the mentioned numerical data by
visualization methods are presented.
The application of the λ2
and of the maximum vorticity visualization methods of vortex structures to the
considered configuration of counter-rotating supersonic vortex pair was
demonstrated in [9]. Let's repeat the main results here.
The
λ2-method
makes it possible to determine a zone of the vortex flow. In our case it is the
vortex cores. The results of its application to the counter-rotating supersonic
vortex pair are shown on fig. 2, on which the isosurfaces of
λ2
= -600 are visualized.
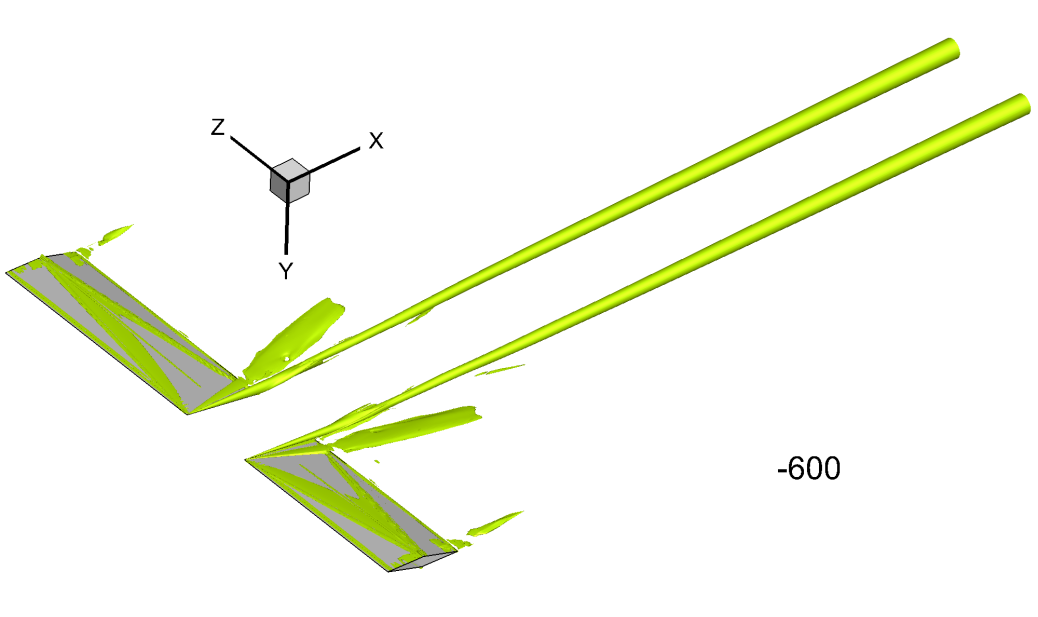
Figure 2.
The application result of
the λ2
visualization method to a pair of counter-rotating
supersonic tip vortices, isosurface of level λ2
= -600
(yellow-green)
Figure 3 shows the lines of the
level
λ2
= -600 in sections that are perpendicular to
the incoming flow direction:
x
= 0.1 (blue circle),
x
= 0.2
(green circle),
x
= 0.3 (black circle). There is an increase
in the diameter of the vortex core as it moves downstream from the wing-generators
axis.
The displacement of counter-rotating
supersonic vortices to leeward is noted, which correlates with the data of
other authors [20] and with dynamics of line vortices in two-dimensional
incompressible flow [21], and their repulsion from each other downstream from
the wing axis at the considered distance is also noted.
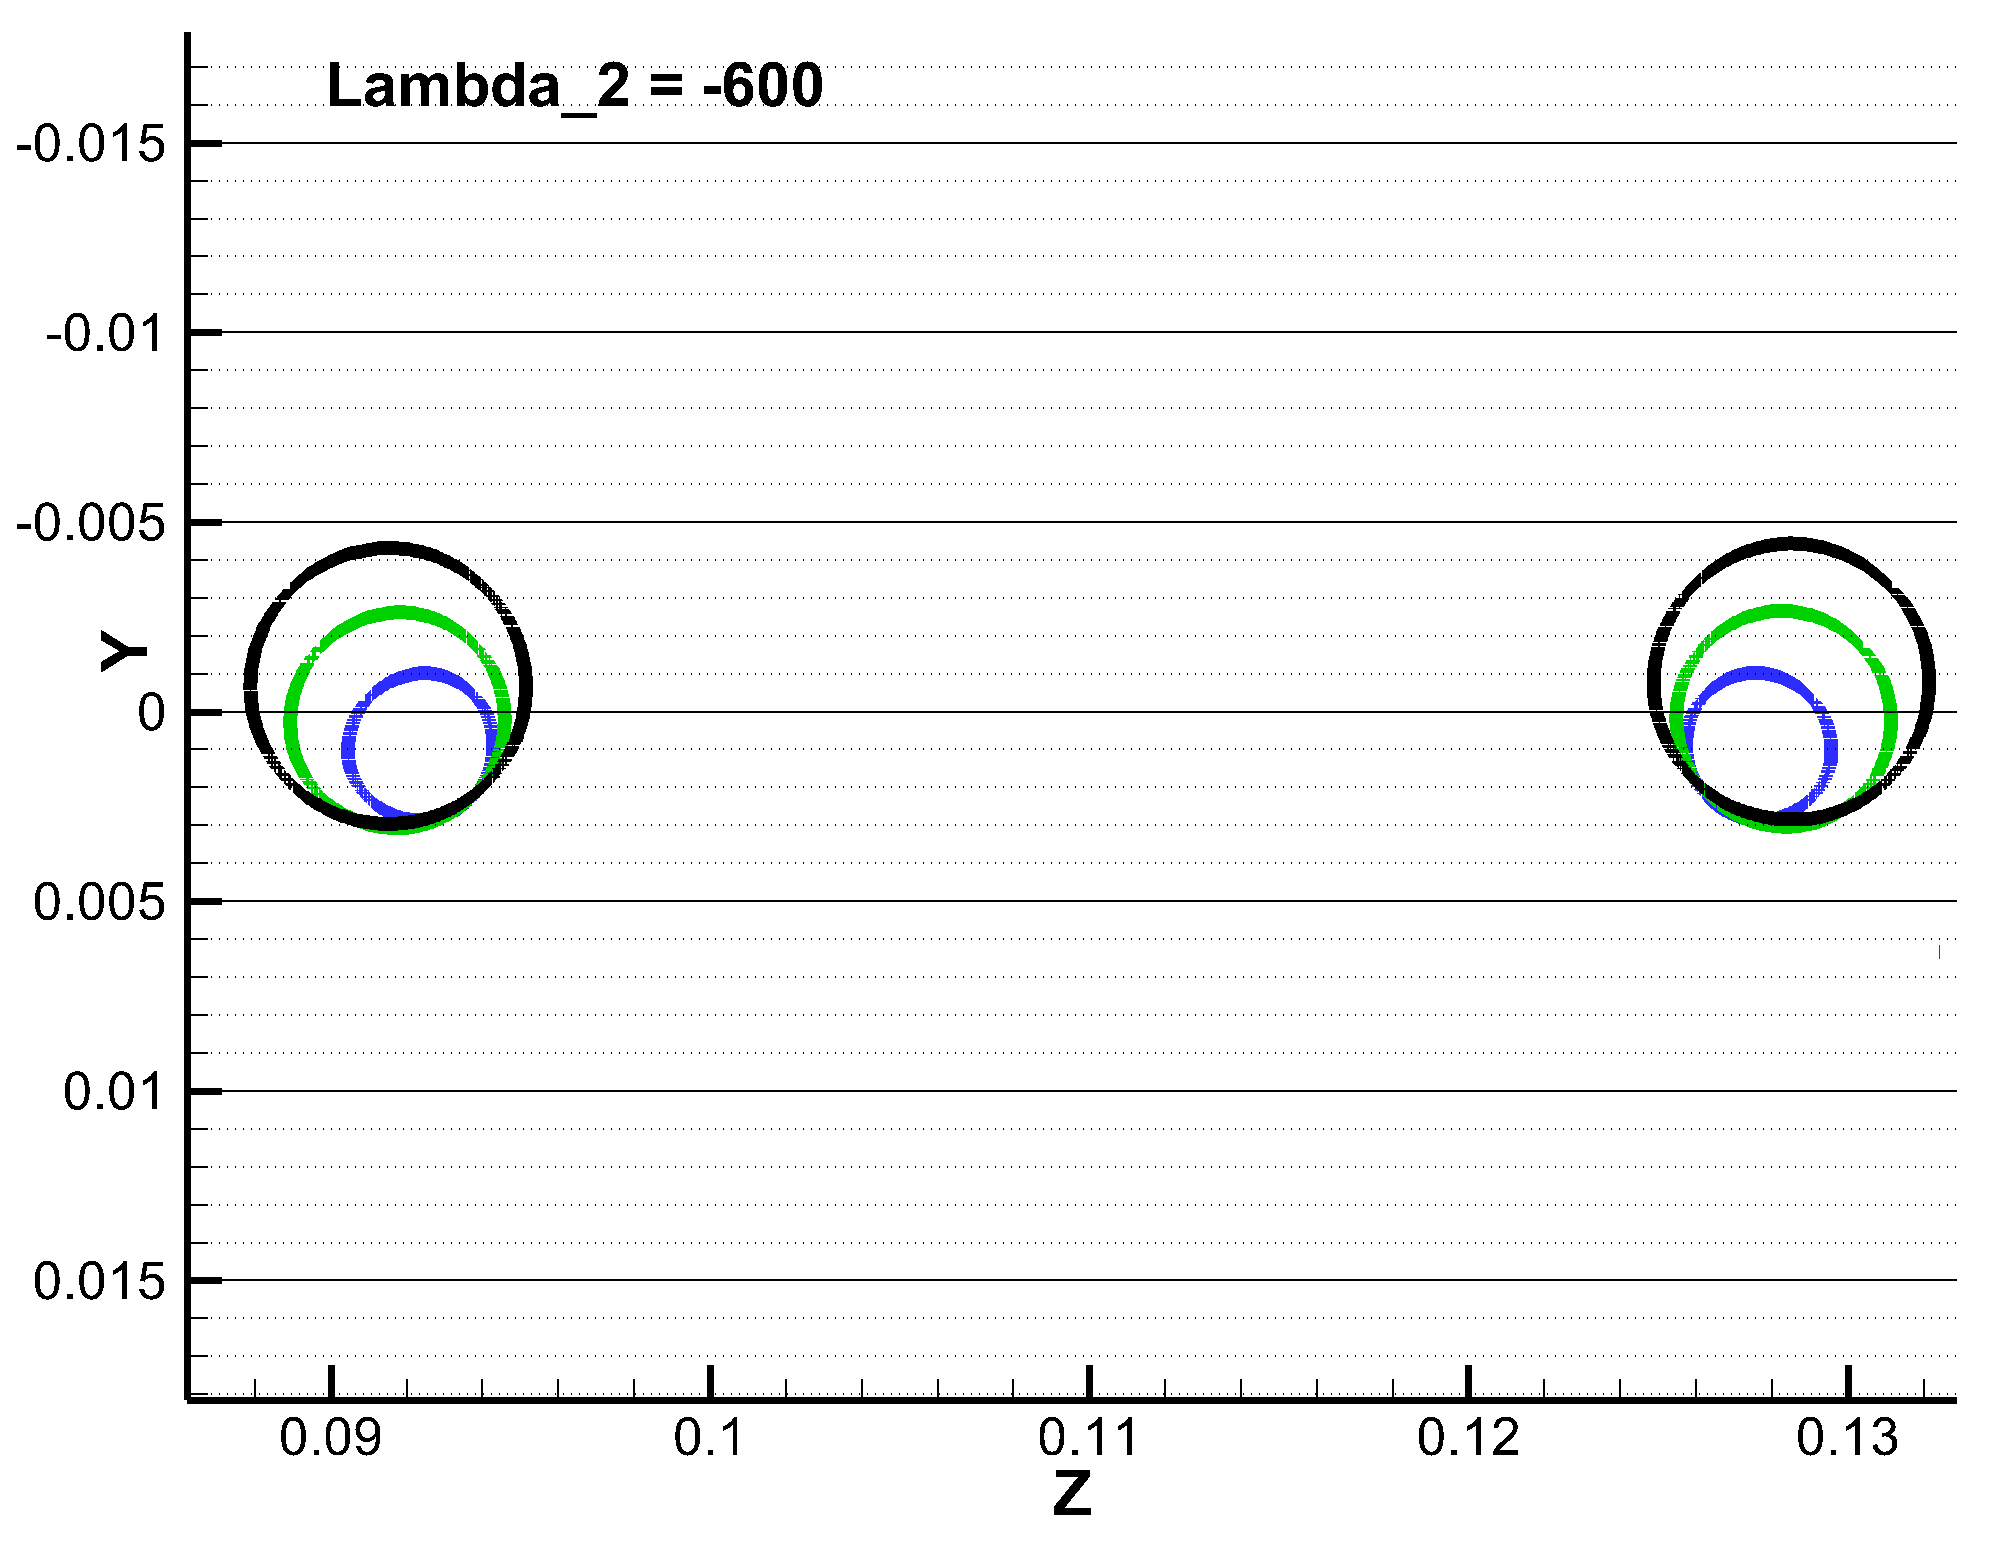
Figure 3.
Lines of level
λ2
= -600 in cross-sections
x
= 0.1 (blue line),
x
= 0.2 (green
line),
x
= 0.3 (black line), counter-rotating vortices
The application result of the
maximum vorticity method to the counter-rotating supersonic vortex pair is
shown on figure 4, it defines the axes of the vortices.
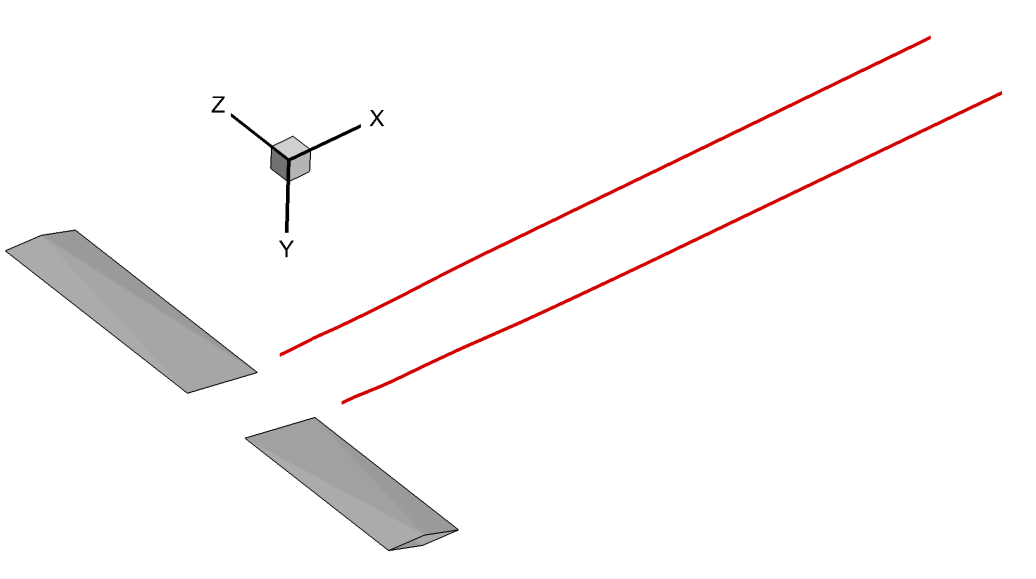
Figure 4.
Axes of counter-rotating
supersonic vortex pair determined by the maximum vorticity method (red lines)
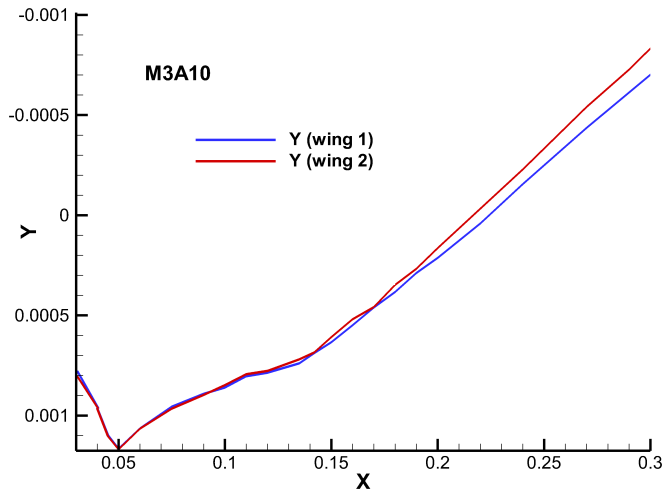
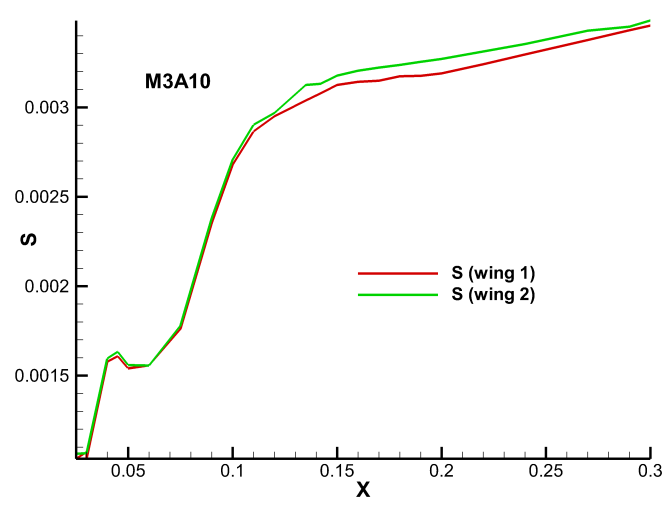
Figure 5 shows plots of the
vertical coordinate
y
of the axes and the variable
S
(the
distance between the coordinate
z
of the vortex axis and the tip chord
of the corresponding generator wing) for the counter-rotating vortex pair.
These plots, as well as fig. 3, demonstrate the displacement of the axes of the
vortices.
Figure 5.
Axis coordinates of
counter-rotating vortices:
y
(left) and
S
(right).
Figure 6 shows the results of
the scientific visualization methods superposition: of the maximum vorticity
and of the λ2-criterion that were applied to the counter-rotating
supersonic vortex pair: the red lines of the vortex axis are located inside the
yellow-green vortex core (isosurface λ2
= - 600).
Both methods show correlated results and complement each other.
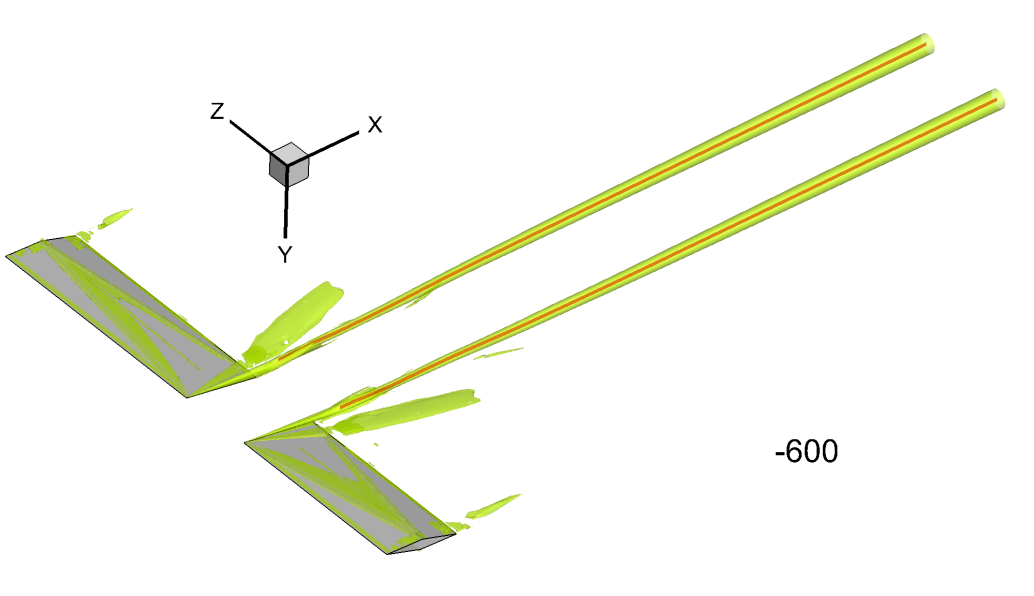
Figure 6.
The superposition result
of the axes of the counter-rotating vortex pair (red lines) found by the
maximum vorticity method and of the vortex core obtained by the
λ2
method,
isosurface of level
λ2
= -600 (yellow-green)
Further, the applying results
of two mentioned visualization methods to a co-rotating supersonic vortex pair present
in the paper.
Figure 7 shows the region of
vortex propagation determined by the
λ2
visualization
method where the isosurfaces of
λ2
= -600 are displayed.
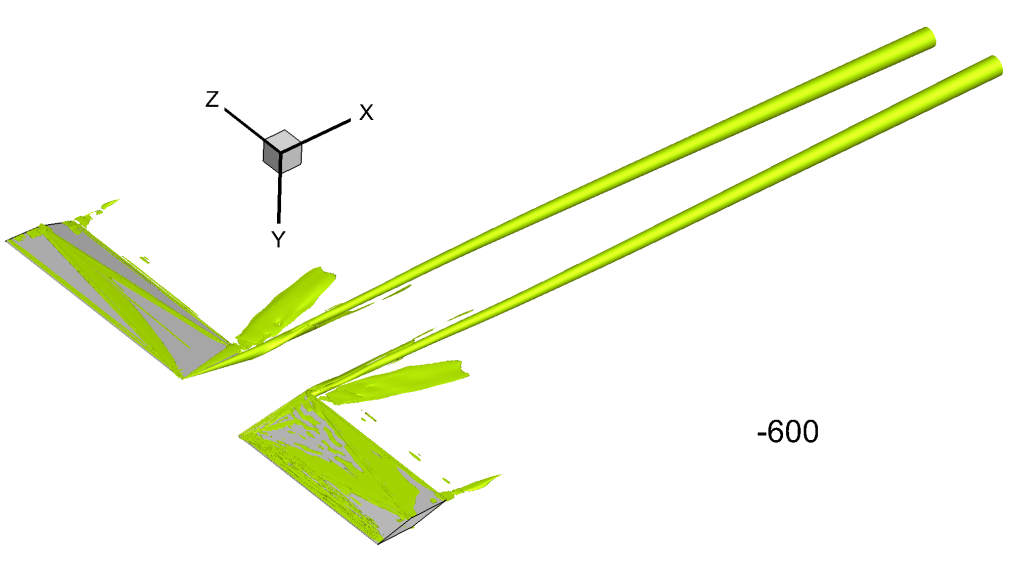
Figure 7.
The applying result of
the λ2
visualization method to a pair of co-rotating supersonic
tip vortices, isosurface of level λ2
= -600 (yellow-green)
Figure 8 shows the lines of the
level
λ2
= -600 in cross sections
x
= 0.1 (blue
line),
x
= 0.2 (green line),
x
= 0.3 (black line) which are
perpendicular to the main flow direction. The diameter of the vortex cores
increases downstream from the generator wings.
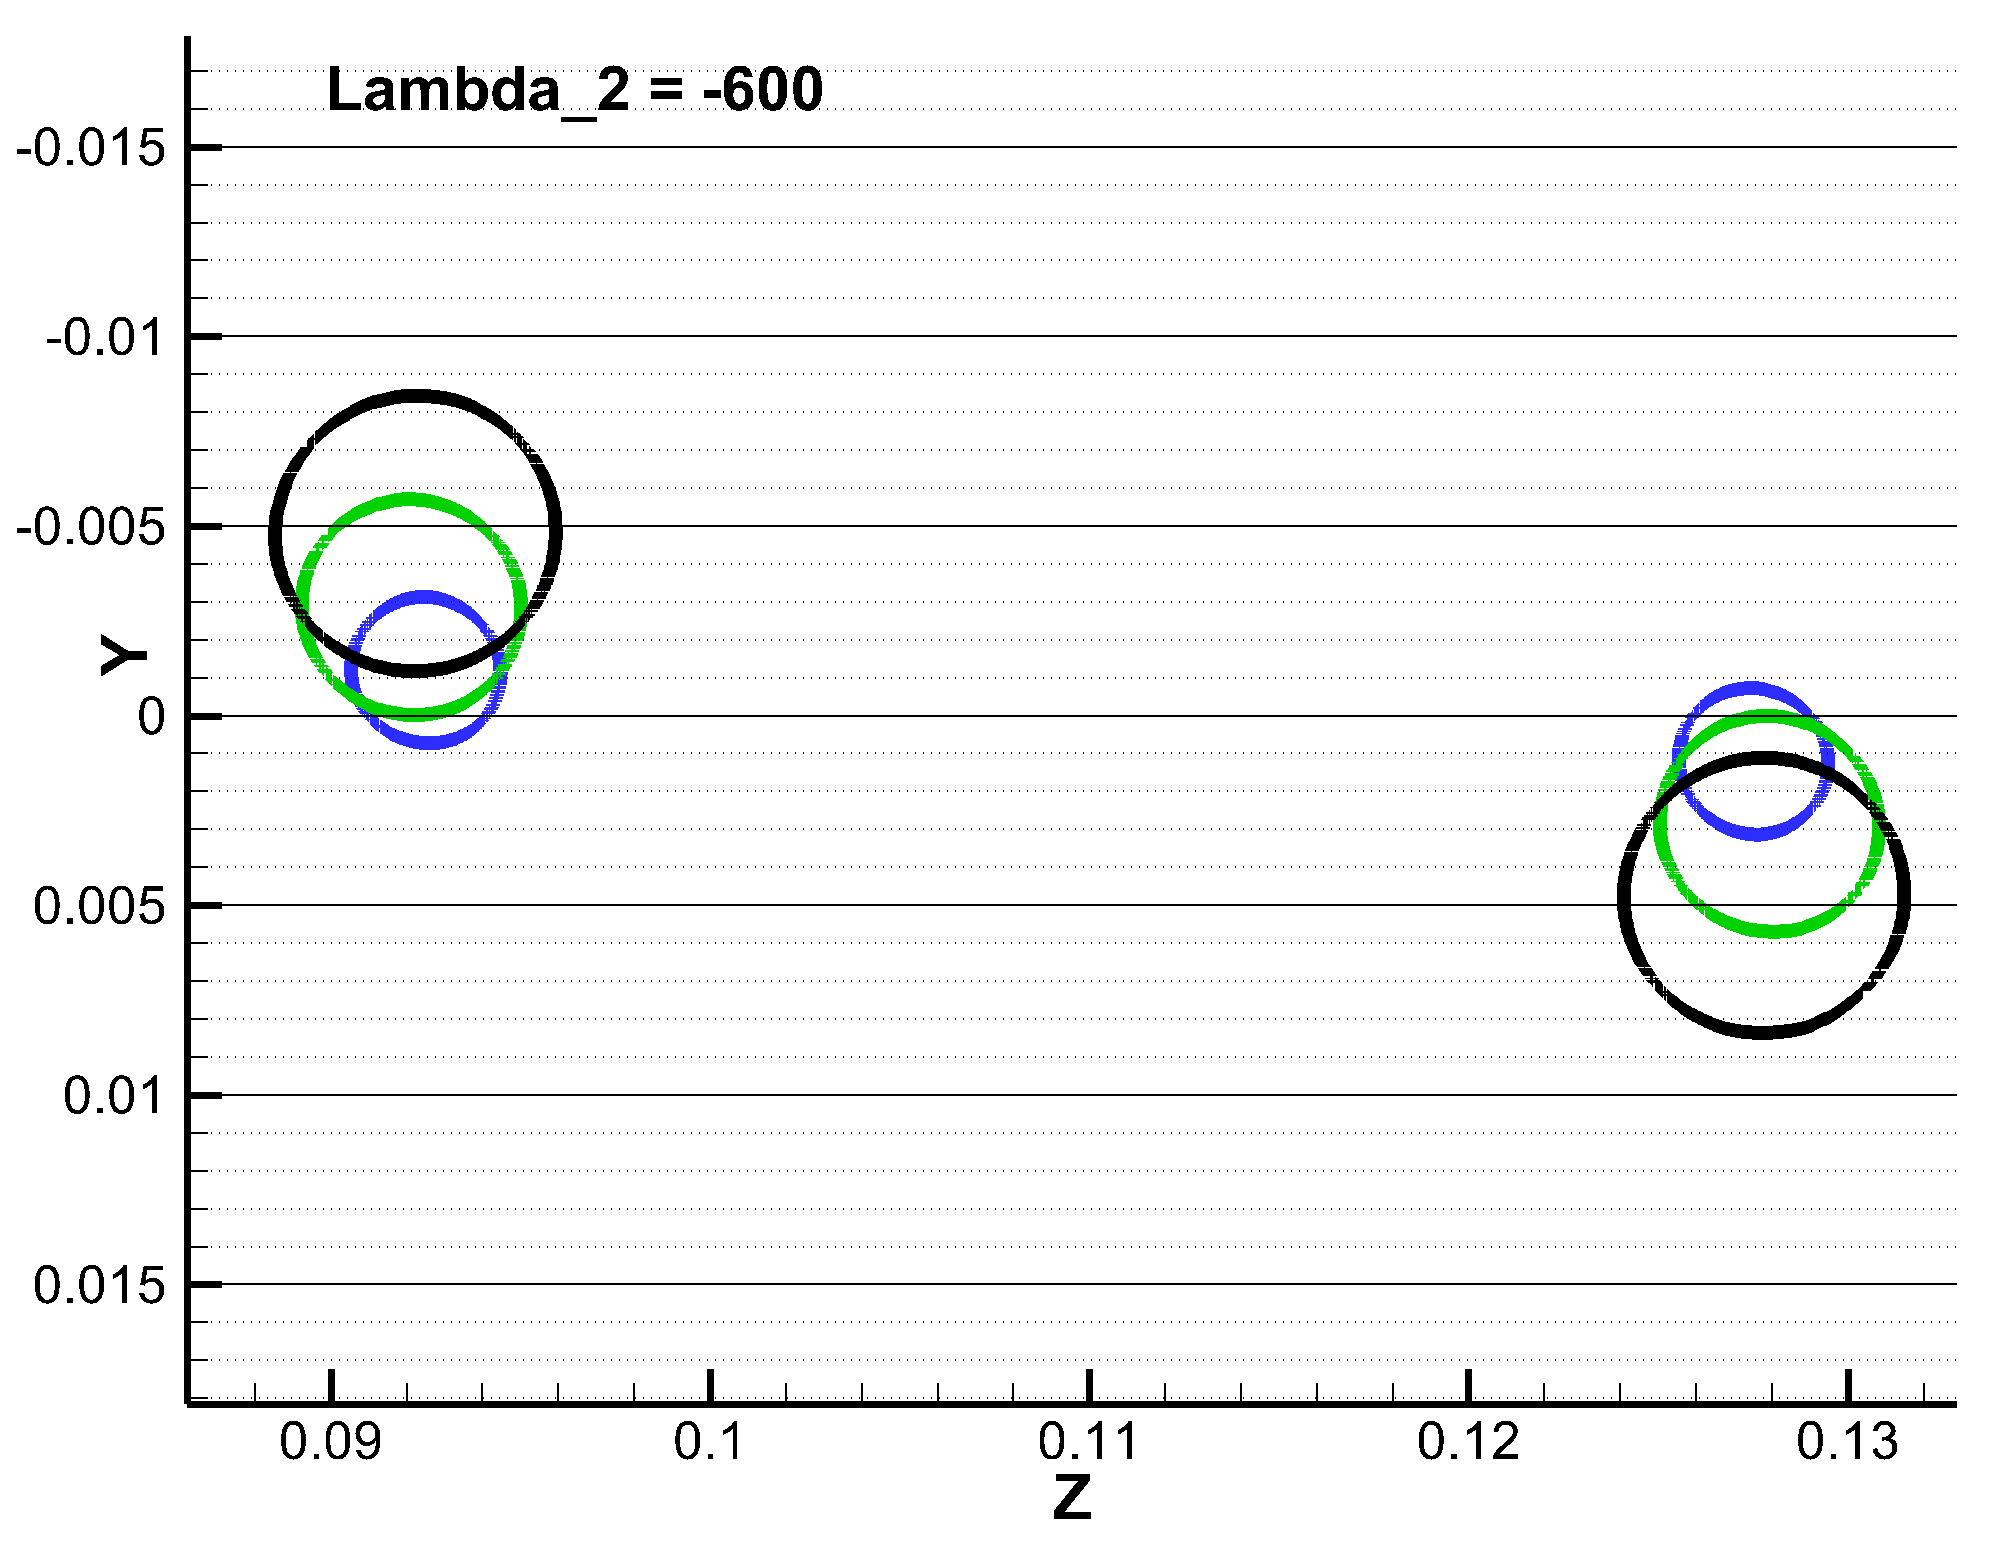
Figure 8.
Lines of level
λ2
= -600 in cross-sections
x
= 0.1 (blue line),
x
= 0.2 (green
line),
x
= 0.3 (black line), co-rotating vortices
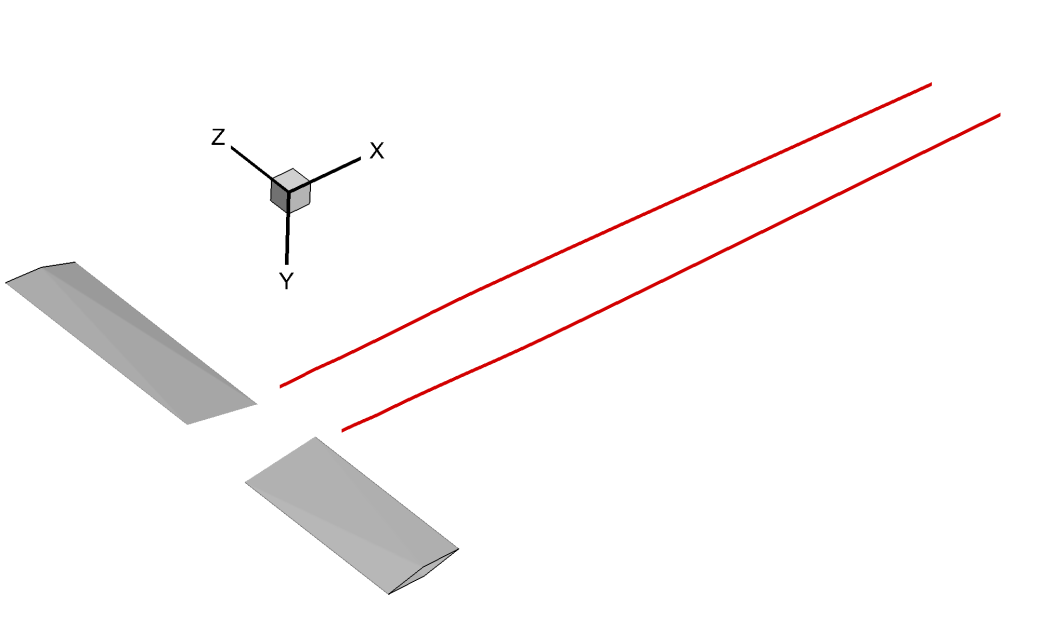
Figure 9.
Axes of co-rotating
supersonic vortex pair determined by the maximum vorticity method (red lines)
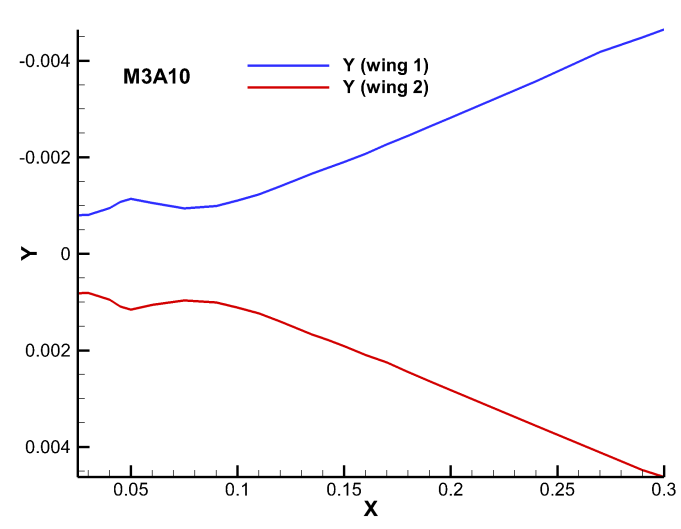
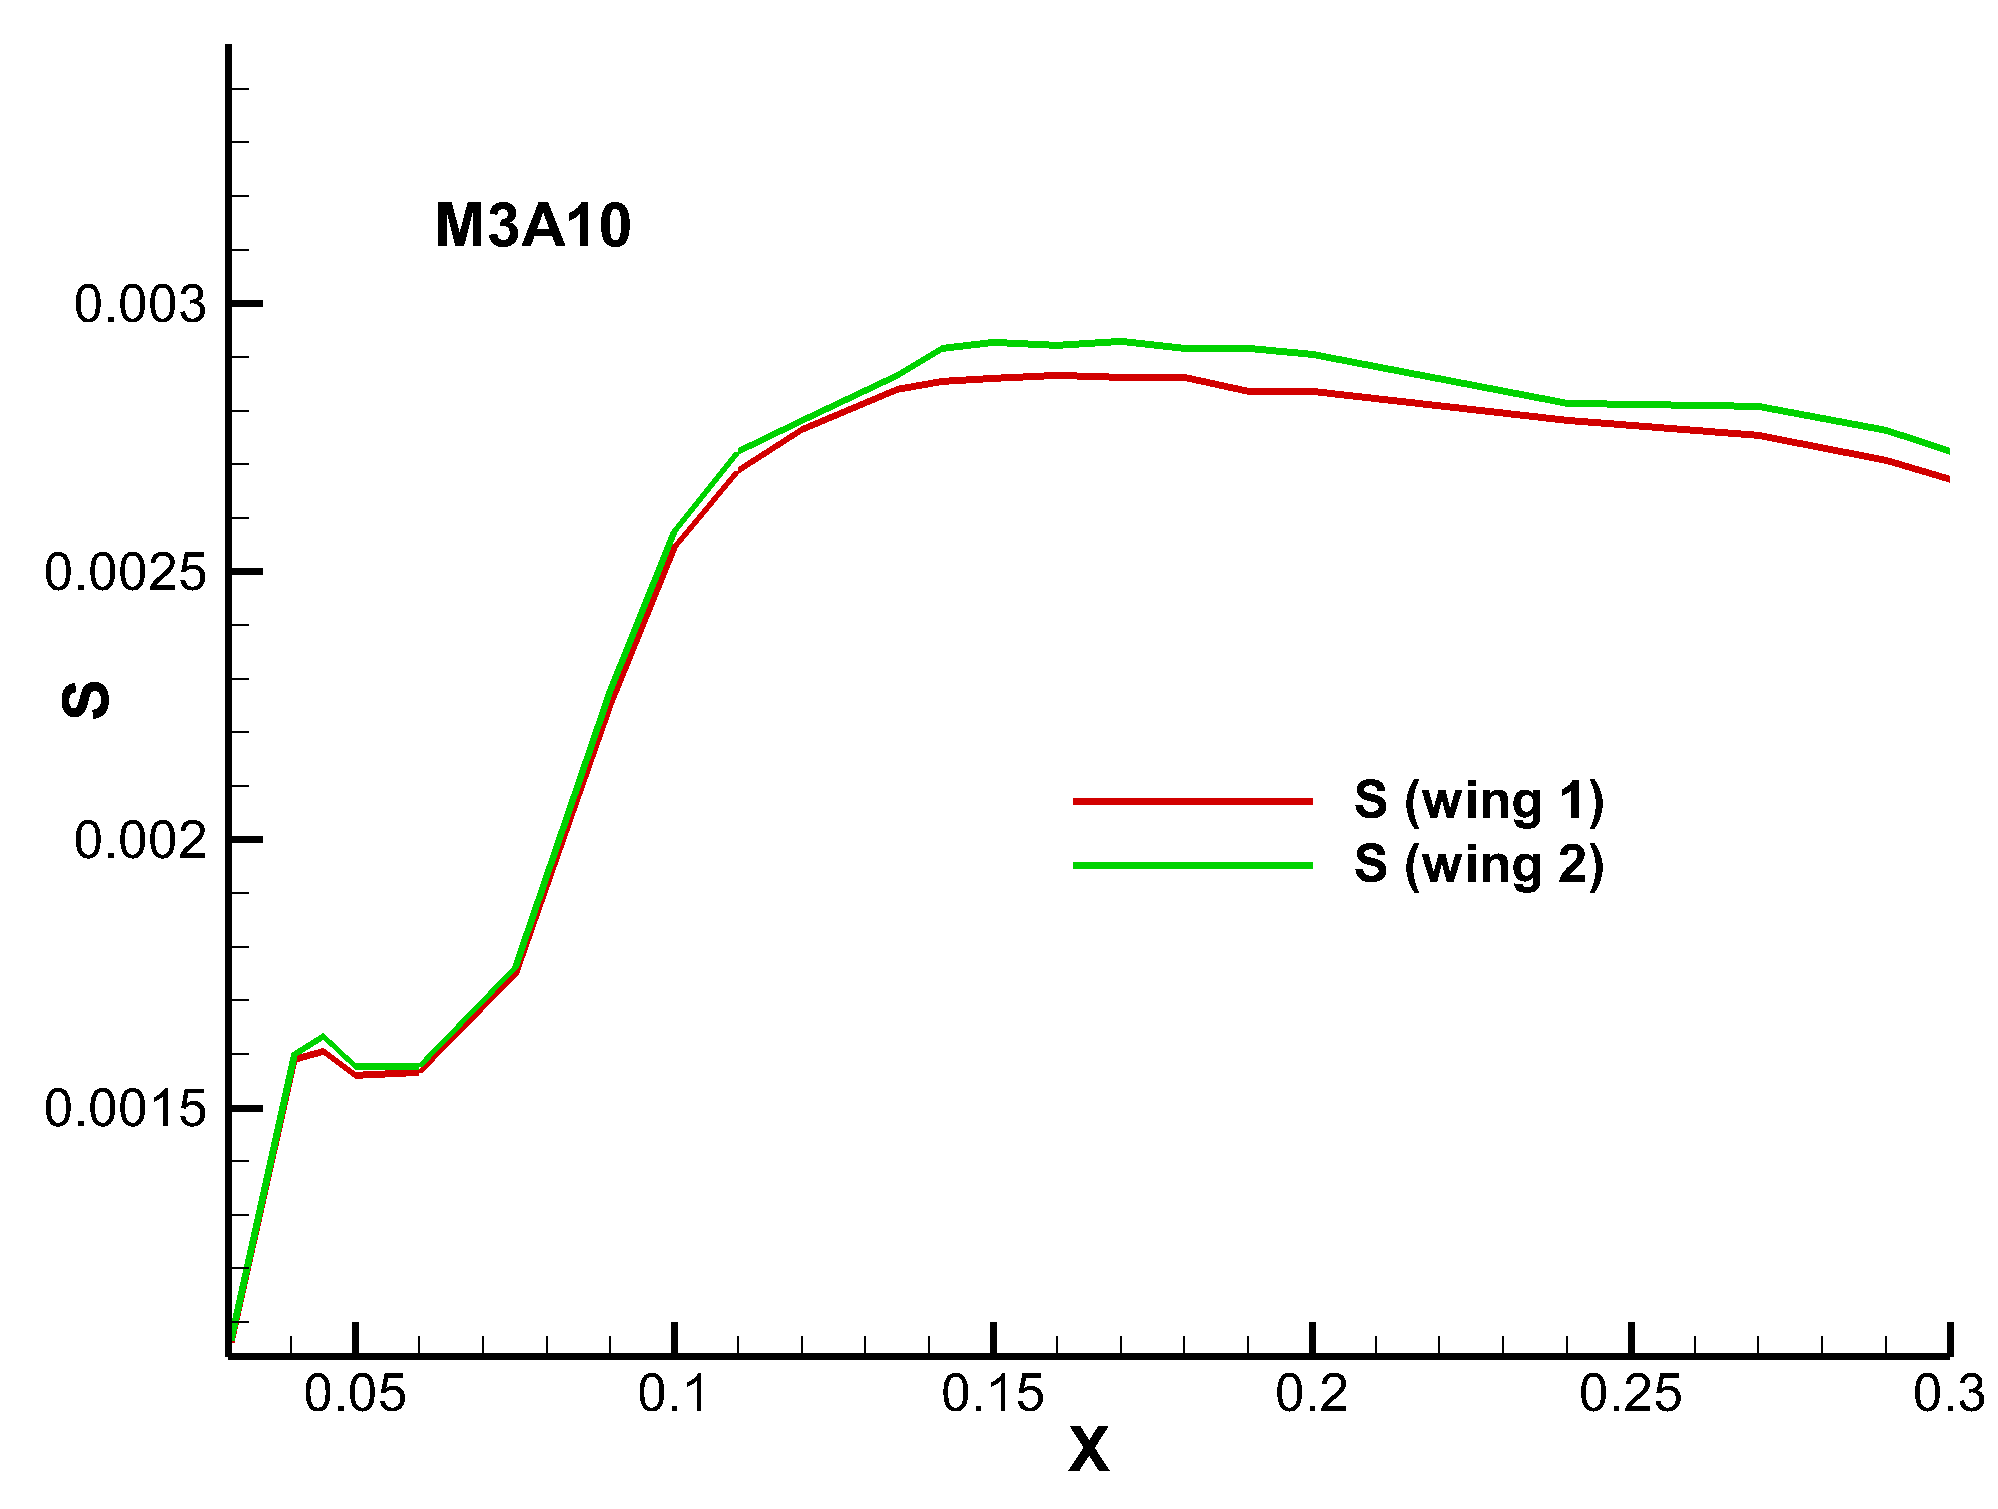
Figure 10.
Axis
coordinates of co-rotating vortices:
y
(left) and
S
(right).
The result of determining of
the co-rotating supersonic vortex pair axes obtained by the maximum vorticity
visualization method of vortex structures is shown in fig. 9.
Figure 10 shows plots of the
displacement of the axes of the co-rotating supersonic vortex pair. It shows the
change of the vertical coordinate
y
and of the variable
S
(the
distance between the
z
coordinate of the vortex axis and the tip chord
of the corresponding generator wing).
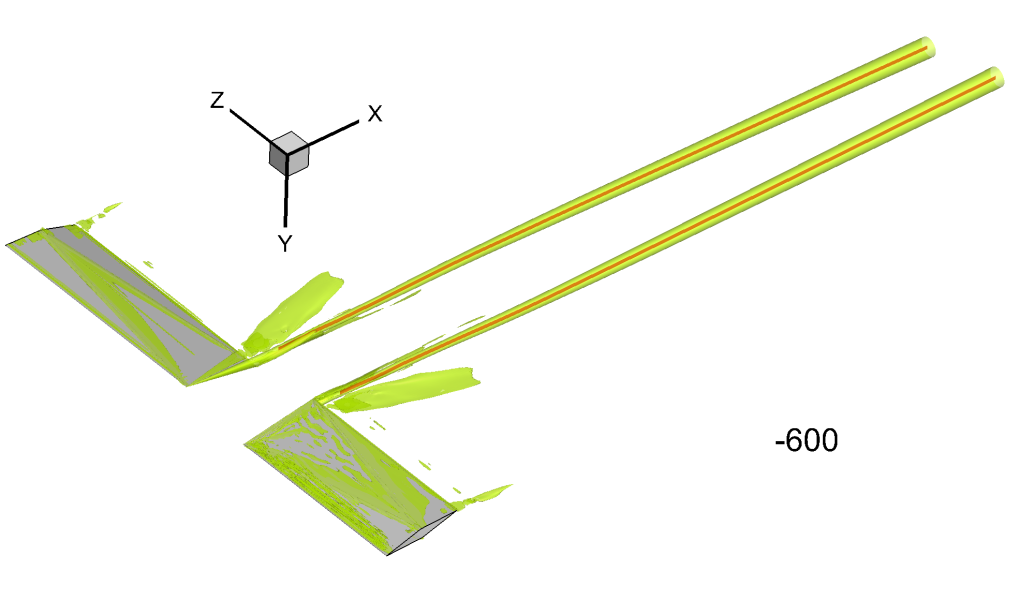
Figure 11.
The
superposition result of the axes of the co-rotating vortex pair (red lines)
found by the maximum vorticity method and of the vortex core obtained by the
λ2
method,
isosurface of level
λ2
= -600 (yellow-green)
Thus the circular displacement
of co-rotating supersonic vortices in the direction that coincides with the
direction of vortices rotation is noted (fig. 8, 10). This correlates with
the data of other authors [22] and with the dynamics of line vortices in
two-dimensional incompressible flow [21]. Their simultaneous divergence from
each other is also noted.
Figure 11 shows the joint
position of the axes of the co-rotating supersonic vortex pair determined by
the maximum vorticity visualization method (red lines) and of the vortex cores
determined by the
λ2
criterion (yellow-green isosurfaces
λ2
= -600). The application results of both scientific
visualization methods are in good agreement with each other.
Since our working group is
engaged in various studies in the field of supersonic vortices propagation and
interaction, one day we came across a problem where the visualization methods
we used earlier, namely the
λ2
method, gives false
vortex zones: it gives the presence of an artifact second vortex.
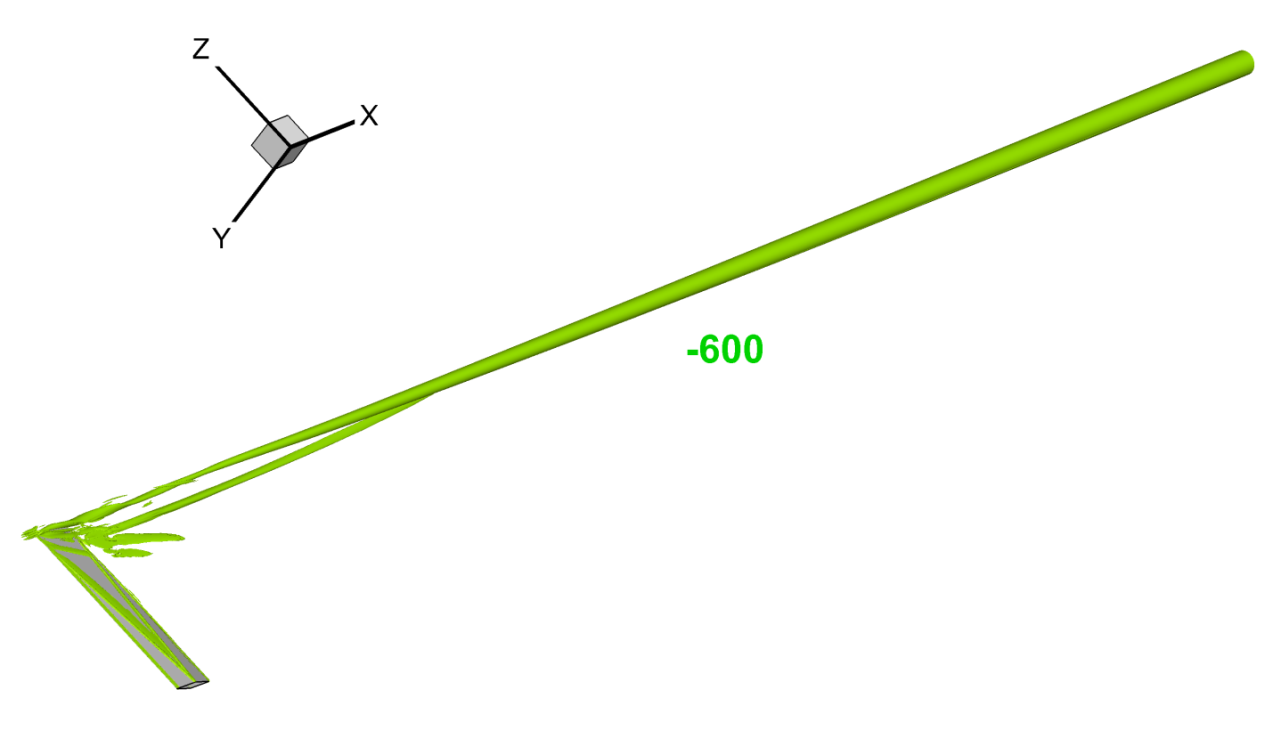
Figure 12.
The applying
result of the
λ2
method to the problem of energy input
upstream from the wing generator, isosurface of level
λ2
= -600
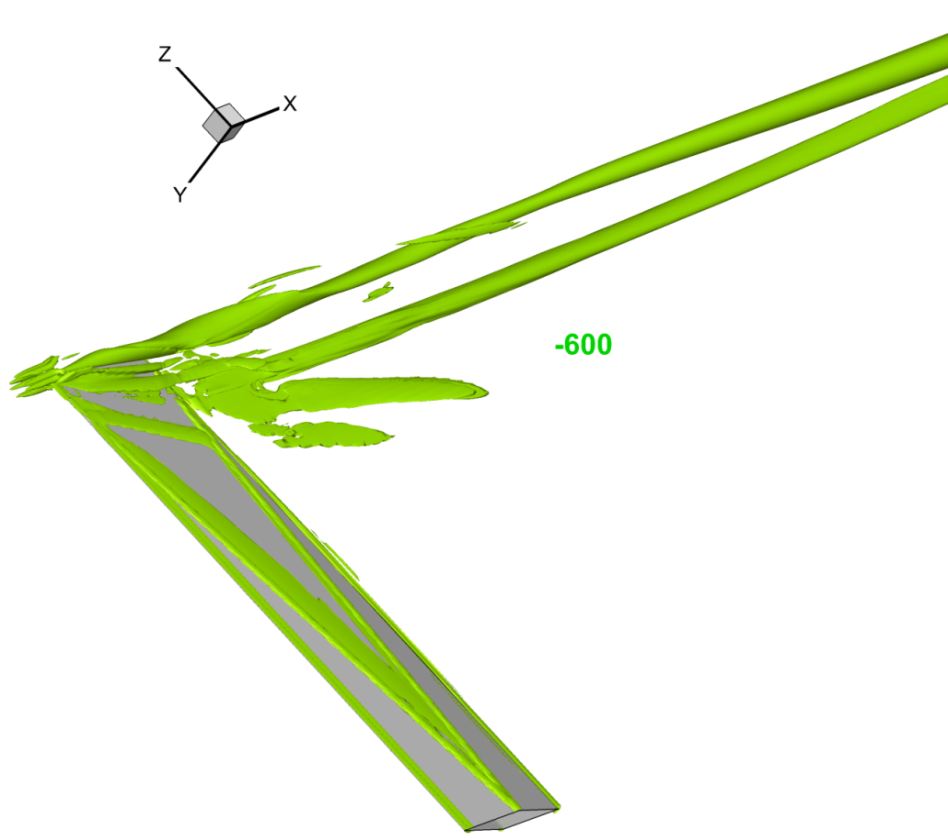
Figure 13.
The applying result of the
λ2
method to the problem of energy input
upstream from the wing generator, isosurface of level
λ2
= -600, zoom on near distance
We are talking about the
problem of energy input upstream from the wing generator. The applying result
of the
λ2
method to this problem is shown on the next figures (fig.
12, 13). Obviously, there is a visible appearance of a second vortex, which
then merges with the main one.
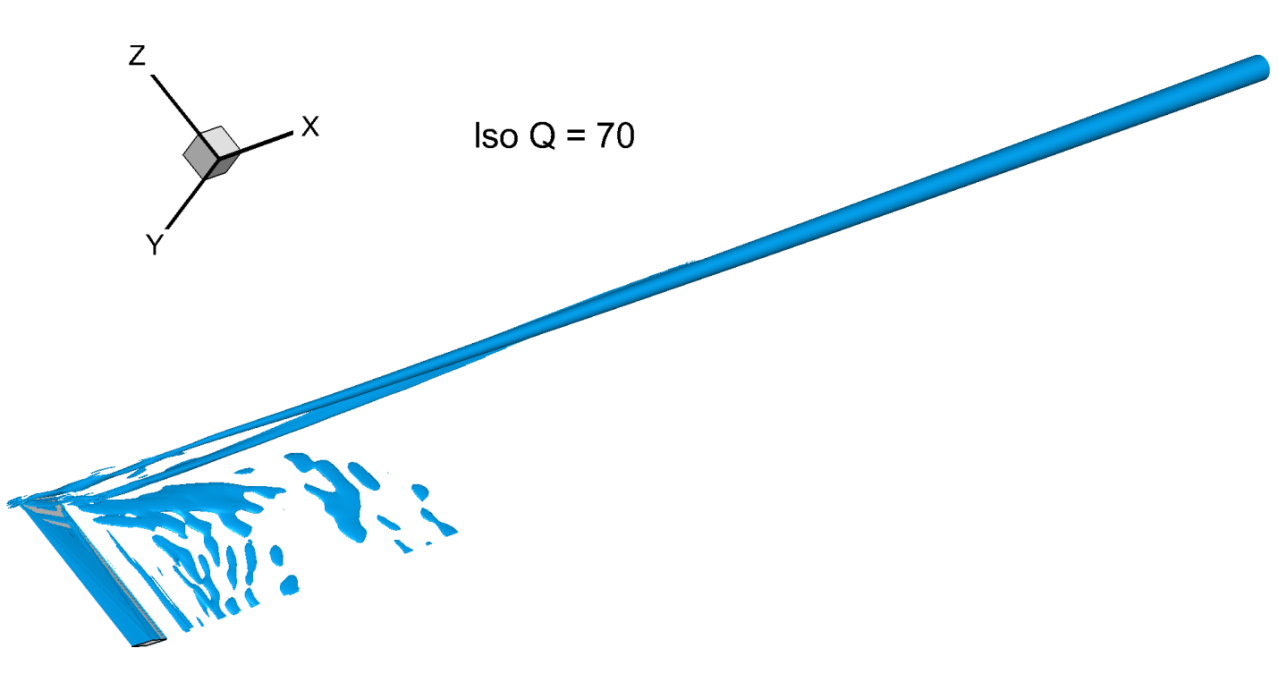
Figure 14.
The applying
result of the
Q
method to the problem of energy input upstream from the
wing generator, isosurface of level
Q
= 70
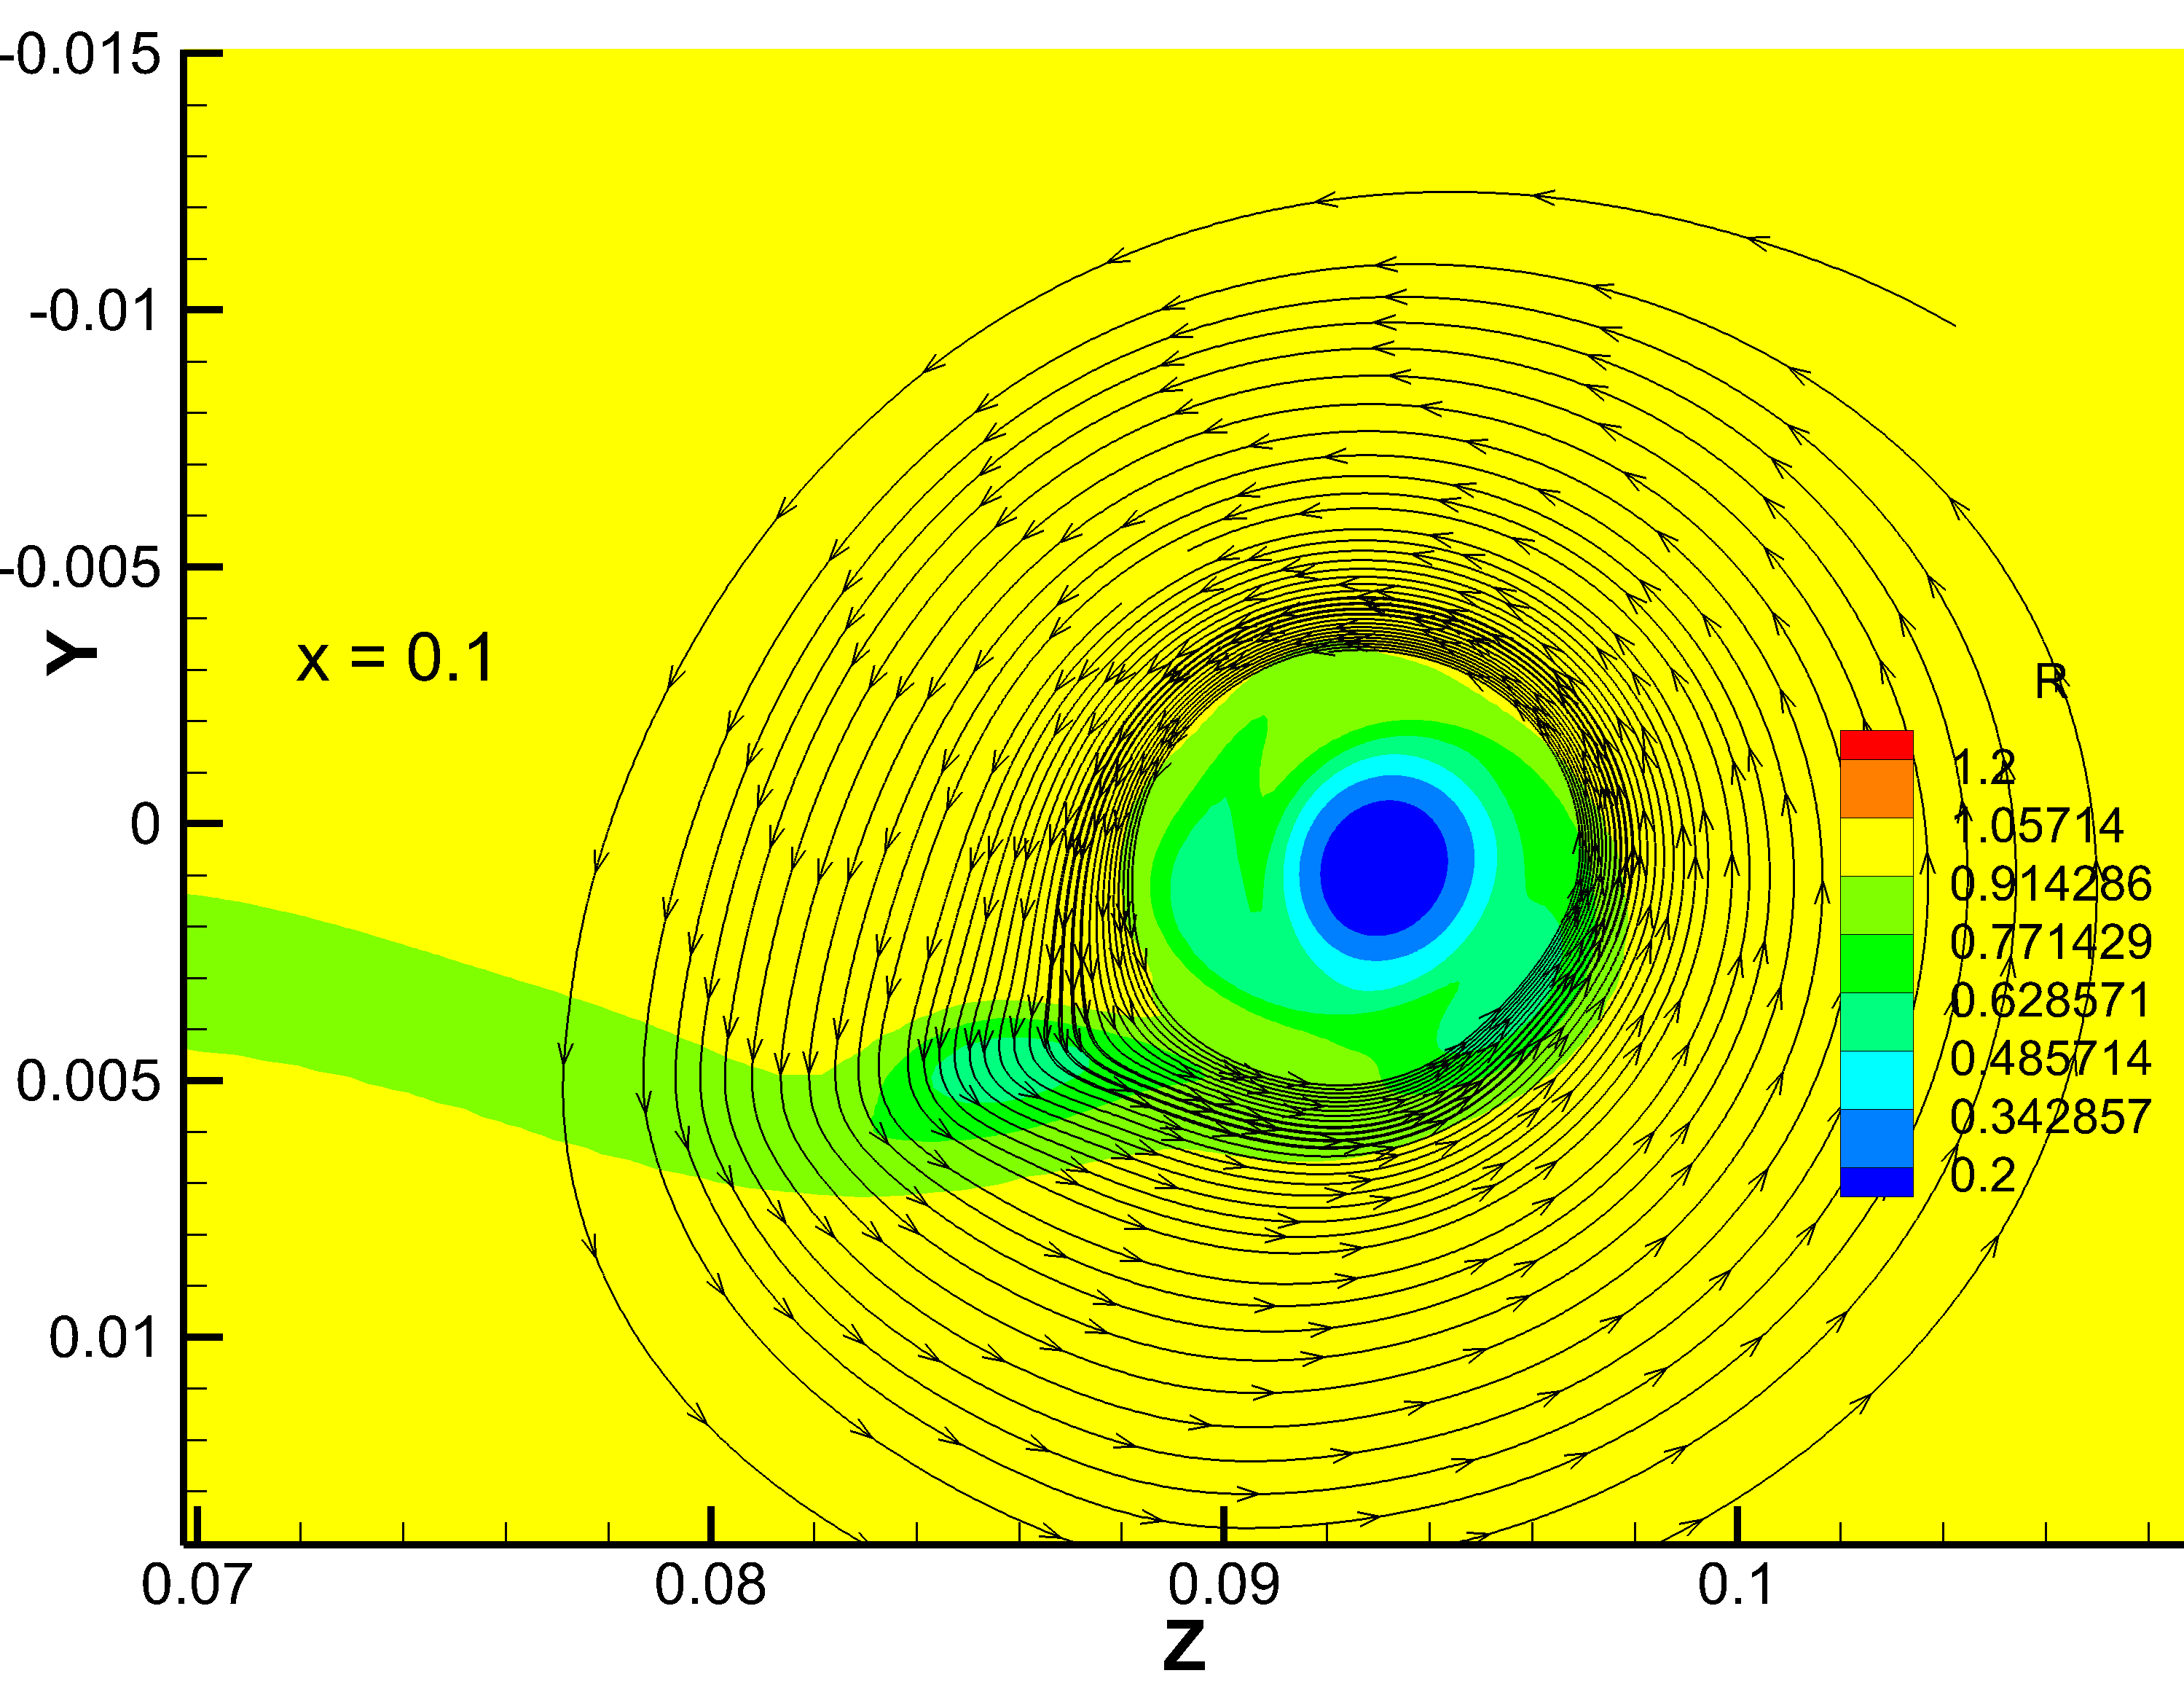
Figure 15.
Density
distribution and streamtraces in cross-section
x
= 0.1
The application of the Q scientific
visualization method (described in [23]) gives a similar result (see fig. 14).
This method, as well as the
λ2
method, is expressed in
terms of matrices
S
(strain-rate) and
Ω
(vorticity tensors) and
under the assumption of incompressible flow is:
that is a measure of the local
rotation rate in excess of the strain rate. Hence, a vortex region is defined
at
 .
.
However, additional studies
show that there is no second vortex. This can be seen on the example of figure
15, which shows the density and streamtraces in a cross section
x
= 0.1 located
approximately in the middle of the "false double vortex" zone.
The authors do not aim to
thoroughly investigate and describe the mentioned above task in this work, as
well as to describe all scientific visualization methods, and only aim to show
the case of the inapplicability of the mentioned visualization methods.
However, not so long ago, a new
visualization method of vortex structures called Rortex appeared [24]. Later it
was renamed Liutex in honor of one of the authors [25]. This method, unlike the
others, excludes shift terms and takes into account only rotational ones. Its
application to the mentioned problem of an energy source in front of a wing
generator will be the subject of our further research.
The results of the analysis and comparison
of a supersonic vortex pair interaction by scientific visualization methods at
the Mach number of the incoming flow M = 3 are reflected in the paper. Two
methods were used: the
λ2
criterion and the maximum
vorticity method. Two configurations are considered: pairs of counter- and
co-rotating vortices.
For numerical simulations of the analyzed
data, the developed software package ARES for simulating three-dimensional
turbulent flows was used. Simulations were carried out on 224 processors on the
hybrid supercomputer system K-60 at the Keldysh Institute of Applied Mathematics
of the Russian Academy of Sciences.
It is found that in both cases the vortices
are longitudinal cone-shaped structures whose diameter gradually expands as
they move downstream from the axis of the generator wings.
The axes of vortices are determined by the
scientific visualization method of maximum vorticity. After the nonmonotonous
zone associated with the vortex formation zone, the displacement of the
vortices for both considered cases at the considered distances is shown. For
the case of counter-rotating vortices, their displacement to the leeward side
of the generator wings and their slight divergence from each other is observed.
For the case of co-rotating vortices, the rotation of the vortices around each
other in the direction coinciding with the direction of rotation in the vortex
core is observed. Thus, there is a mutual influence of vortices on each other
during their joint propagation.
These methods of scientific visualization perform
well in many tasks. However, do not forget about the limitations associated
with their use. So, in the course of our research, we got a case when the above
methods do not work, i.e. they give an artefact vortex zone. Nevertheless, one
of the latest visualization methods (Rortex or Liutex) seems promising and its
application will definitely become one of the topics of our further research.
1.
Wake Turbulence Training Aid (section 2), FAA Report, DOT/FAA/RD-95/6
DOT-VNTSC-FAA-95-4, United States Department of Transportation, 1995.
2.
Vergine F., Maddalena L. Study of two supersonic streamwise vortex
interactions in a Mach 2.5 flow: Merging and no merging configurations.
Physics
of Fluids,
27, 076102, 2015.
3.
Hansen C.D., Johnson C.R. (Eds.).
The Visualization Handbook.
NY: Academic Press, 2004, 984 p.
4.
Chakraborty, P., Balachandar, S., Adrian, R. G. On the
relationships between local vortex identification schemes.
J. Fluid Mech.,
535, pp 189-214, 2005.
5.
Kolář V. Brief Notes on Vortex Identification.
Recent
Advances in Fluid Mechanics, Heat and Mass Transfer and Biology
(WSEAS Press,
163 p), pp 23-29, 2011.
6.
Volkov K.N. Visualization methods of vertical flows in computational
fluid dynamics and their applications.
Scientific and Technical Journal of
Information Technologies, Mechanics and Optics,
91
3, 2014 (in
Russian).
7.
Volkov K.N., Emelyanov V.N., Teterina I.V., Yakovchuk M.S. Methods
and concepts of vortex flow visualization in the problems of computational
fluid dynamics. Num. Methods and Programming,
17
1, 2016 (in Russian).
8.
Konstantinovskaya T., Lutsky A. Numerical simulation and
visualization of wing vortices.
Scientific Visualization, Vol.
4,
№2, pp 14-20, 2012.
9.
Borisov V.E., Davydov A.A., Konstantinovskaya T.V., Lutsky A.E.
Application of scientific visualization tools in the study of supersonic vortex
pair.
Scientific Visualization, Vol.
12, №4, pp 46-55, 2020.
DOI: 10.26583/sv.12.4.05
10.
Bykov
L.V., Molchanov A.M., Scherbakov M.A., Yanyshev D.S.
Computational mechanics
of continuous media in problems of aviation and space technology. LENAND,
2019, 668 p (in Russian).
11.
Hybrid
supercomputer system K-60
https://www.kiam.ru/MVS/resourses/k60.html
12.
Borisov
V.E., Davydov A.A., Kydryshov I.Yu., Lutsky A.E. ARES software package for
numerical simulation of three–dimensional turbulent flows of viscous
compressible gas on high-performance computing systems, Certificate of
registration of a computer program RU 2019667338, (23 December 2019) (in
Russian).
13.
Allmaras
S.R., Johnson F.T., Spalart P.R. Modifications and Clarifications for the
Implementation of the Spalart-Allmaras Turbulence Model.
Seventh
International Conference on CFD
(ICCFD7), Big Island, Hawaii (9-13 July
2012).
14.
Edwards
J.R., Chandra S. Comparison of eddy viscosity-transport turbulence models for
three-dimensional, shock-separated flow fields.
AIAA Journal
34
4,
pp 756–763, 1996.
15.
Borisov
V.E., Lutsky A.E. Simulation of transition between regular and Mach shock waves
reflections by an implicit scheme based on the LU-SGS and BiCGStab methods.
KIAM
Preprint
68
(2016) DOI: 10.20948/prepr-2016-68 (in Russian).
16.
Haller
G. An objective definition of a vortex.
J. Fluid Mech.,
525,
pp 1-26, 2005.
17.
Kolář
V. Vortex identification: New requirements and limitations.
International Journal of Heat and Fluid Flow,
28,
pp
638–652,
2007.
18.
Jeong
J., Hussain F. On the identification of a vortex.
Journal of Fluid Mechanics,
285, pp 69–94, 1995.
19.
Strawn
R.C., Kenwright D.N., Ahmad J. Computer visualization of vortex wake systems.
AIAA
Journal,
37
4, pp 511–512, 1999.
20.
Forster
K.J., Barber T.J., Diasinos S., Doig G. Interaction of a counter-rotating
vortex pair at multiple offsets.
Experimental Thermal and Fluid Science J.,
86, pp 63-74, 2017.
21.
Saffman
P.G. Vortex Dynamics. Cambridge: Cambridge Univ. Press, 1993, 311 p.
22.
Wang
Y., Liu P., Hu T., Qu Q. Investigation of co-rotating vortex merger in ground
proximity.
Aerospace Sciences and Technology,
53, pp 116-127,
2016.
23.
Hunt
J.C.R., Wray A.A., Moin P. Eddies, stream, and convergence zones in turbulent
flows. Technical Report № CTR-S88. Palo Alto: Center for Turbulent Research, pp
193–208, 1988.
24.
Liu
C., Gao Y., Tian S., Dong X. Rortex—A new vortex vector definition and
vorticity tensor and vector decompositions.
Phys. Fluids, 2018, 30,
035103.
25.
Shrestha
P., Nottage C., Yu Y., Alvarez O., Liu C. Stretching and shearing
contamination analysis for Liutex and other vortex identification methods.
Advances
in Aerodynamics,
3
8, 2021.