The
article discusses the problems of graph visualization when creating the knowledge
control application program on graph theory. Graphs are widely used in various
fields of knowledge, such as sociology, mathematical linguistics, economics,
biology, medicine, geography, programming, electronics. Now it is probably
difficult to give an example of a direction of human activity where graphs are
not used at all, since they provide a convenient language for describing
various models [1-3]. All this leads to the fact that the study of graph theory
is of great importance.
Since
it is believed that about 90% of all the information a person receives through
vision, and the name graph itself speaks of connections with graphics, images,
work on computer visualization of graphs appeared immediately as soon as
progress in the development of hardware made it possible to make the graphical
interface and computer graphics convenient for a person. Note that not all
tasks for computer visualization of graphs turned out to be simple and
unambiguous. Especially difficult problems arise when visualizing large graphs
[1,2,4,5,6,7].
When
studying graph theory in the course of discrete mathematics, working with large
graphs is not required, demonstration of drawings of graphs containing no more
than 2 dozen vertices and slightly more edges does not cause difficulties and
is well perceived by students. Moreover, in many cases it is possible to limit
ourselves to considering planar graphs. But everything changes when it comes to
algorithms on graphs. When studying algorithms on graphs, static images are
clearly not enough. Graph algorithms often have a complex structure, a large number
of steps and condition checks. For a quick understanding of such an algorithm, just
to read its description and view a static diagram, even a very detailed one is
not enough. It is desirable to be able to trace the stages of graph processing
by the selected algorithm.
To
solve the described problems in the study of graph theory, the authors
formulated an interdisciplinary task that combines pedagogical aspects and
visualization issues. From the point of view of teaching, it is important to
take into account the sequence of presentation of the material as its
complexity increases. At the same time, this sequence should determine the
principle of creating an application program and highlight the most important
aspects of visualization of methodological developments. For visualization, you
can use techniques of various color solutions, notation, complex images of
actions on graphs, interactivity. The principles of object-oriented programming
were chosen as a software solution for the implementation of techniques of
various color solutions, designations, complex images of actions on graphs,
interactivity. In the presented knowledge verification application program, for
example, classes "Graph", "Graph vertex", "Graph
Edge" are created. Techniques of color solutions, various designations,
actions on graphs, interactivity are defined as methods of these classes. The
program was developed in the Microsoft Visual Studio environment in C#.
To
do this, many authors create animations of these algorithms [8-11], but for a
faster and deeper study of the issue, the possibility of conducting independent
tests, i.e. performing actions according to the chosen algorithm, is useful. Of
course, the correctness of actions should be checked. In the classroom, the
teacher is engaged in checking, but it can be transferred to a computer, which
is important for self-study or distance education. Moreover, it is important to
check not only the completed work, but also intermediate solutions. Working
with the program should be interactive. And to ensure successful interactive
work, we will need a lot of designations and the use of various color
solutions. The program should provide the user with the opportunity to perform
various actions that are determined by the selected algorithm, while the
picture on the screen should change according to the actions performed and be
understandable to the user. On the one hand, such a program is useful when
studying algorithms, and on the other hand, it can be used to evaluate
knowledge [12-14].
Therefore,
the task was set to create an application program for testing knowledge in
graph theory, which on the one hand will be useful to students when studying
algorithms due to their visualization, and on the other hand it can be used by
a teacher to assess knowledge [12-14]. The development of such a program will
contribute to the formation of methodological and software tools that allow
students to perceive information efficiently and effectively in the learning
process on the basis of an interactive component, and the teacher can quickly
assess the acquired knowledge.
The
algorithms "search in width" and "search in depth" are
quite simple for visualization. Only two actions can be performed with the
selected vertex: either put it in an auxiliary object (stack or queue), or put
it in the traversal list, the student uses the switches to determine which
actions he wants to perform at a particular time and selects the vertex by
clicking it (see Figure 1). Since a vertex, once in an auxiliary object (stack
or queue), must be marked, this label is depicted as the color of the vertex in
a paler color. At the moment of selecting a vertex, it is colored red,
regardless of the operation that will be performed.
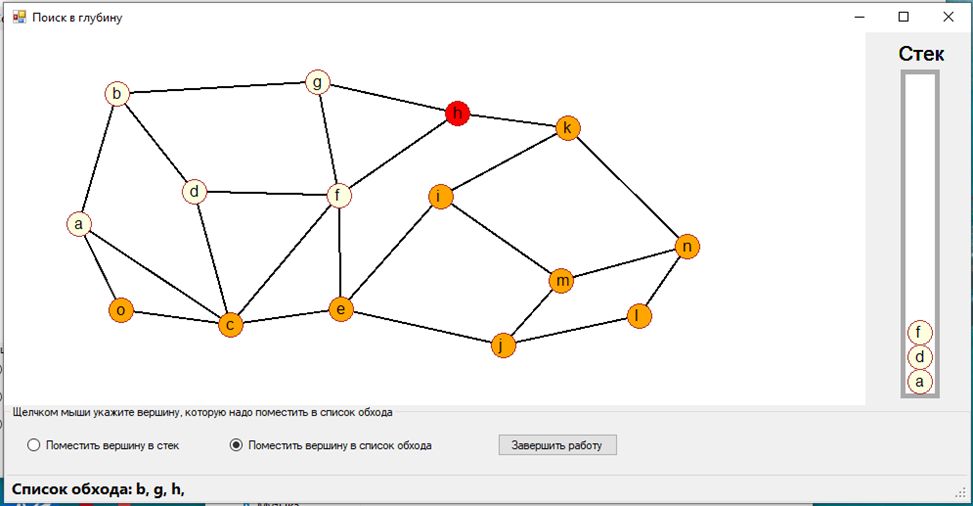
Figure
1. Using the "search in
width" algorithm, a graph traversal list is generated. At the step under
consideration, the selected vertex "h" is placed in the traversal
list.
In
case of an error the program outputs a message and counts errors. Since in such
work mistakes can be made not only from ignorance of the algorithm, but also
from excitement or inattention, the student is allowed to make 3 mistakes. If a
student makes 4 mistakes, then his work is reset to zero and he has to do the task
again on the same graph. The student works with the same graph, but when the
program starts, this graph is selected using a random number generator from a
list of pre-prepared graphs. In the previously developed program [11], random
generation of the graph itself was used, but later we came to the conclusion
that it is better to use pre-prepared variants [12], and only give the random
process the choice of one of them. To create variants of tasks, a special
editor has been developed that allows you to build graphs of the required level
of complexity. If a weighted graph is considered, then the weights of the edges
are determined randomly each time the program is run.
The
knowledge testing program implements tasks on two algorithms for finding the
shortest path - the Ford-Bellman algorithm and the Dijkstra algorithm. The
first algorithm consists of two stages: the stage of calculating indexes and
the stage of constructing the shortest path. Therefore, first the program
suggests calculating the indices of the vertices (see Figure 2). In order to
record the index of the vertex, the student selects the vertex itself, it is
painted in red, and in the lower right corner of the form an input field
appears in which the calculated index can be written, and the "Save"
button, clicking on which the student will associate the entered value with the
selected vertex.
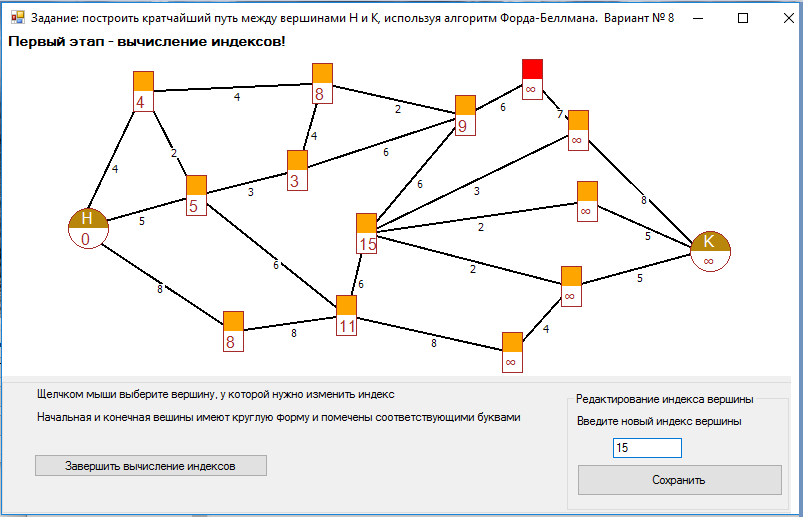
Figure
2. The Ford-Bellman algorithm.
The currently selected vertex is indicated in red, it is its index that is
adjusted in the input field located in the lower right part of the window.
After
calculating the indices of all the vertices of the graph, the student will
click the "Complete index calculation" button. If there are errors in
the calculated indexes, the program will ask if the student wants to find them
and fix them himself. The student can agree and correct the errors, and send
the solution for review again. If the student refuses to look for errors, the
program will display an analysis of these errors and the student will not be
able to correct them. If the errors do not concern the shortest path, then the
program will allow you to continue working and build one of the shortest paths.
Since the error analysis is displayed on the screen (Figure 3), the teacher can
evaluate the work in full.
For
example, in Figure 3, the work is done, but with errors. To display the results
of error analysis, the vertices of the graph were numbered, the vertex numbers
are shown in white on an orange background, the errors themselves are listed in
the lower left corner of the window. The shortest path is constructed
correctly, the edges included in this path are colored orange.
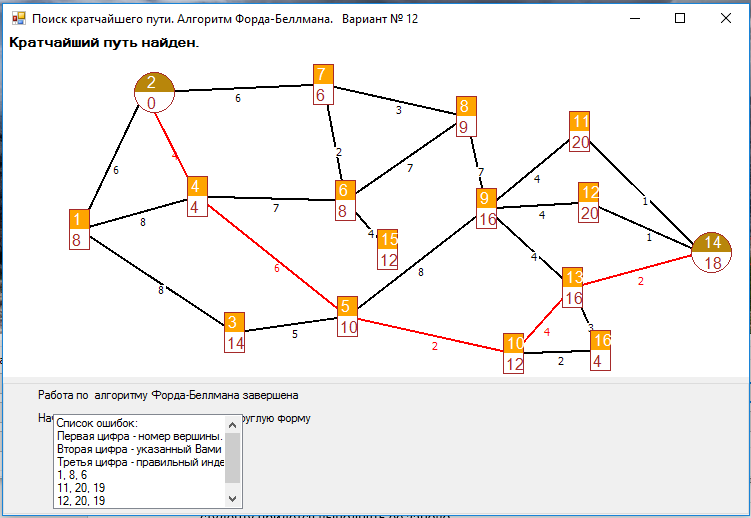
Figure
3. Ford-Bellman algorithm:
completion of work in which uncritical errors were made.
If
the incorrect indexes lie on the shortest path, then it is impossible to
continue the work, and the student will have to do it again.
In
Dijkstra's algorithm, it is also necessary to calculate vertex indexes, but in
this algorithm the procedure is more complicated, a vertex can be traversed,
active, highlighted, or not examined at all. And there are not two, but three
action mode switches on the form. If we analyze the situation in Figure 4, we
will see that the purple color shows passed vertices. One of the passed
vertices is active, it is marked with a blue frame. The currently selected
vertex is drawn in red color, the index of the red vertex is being adjusted in
the input field located in the lower right part of the window. The remaining
vertices are colored orange so far, as they have not been considered yet.
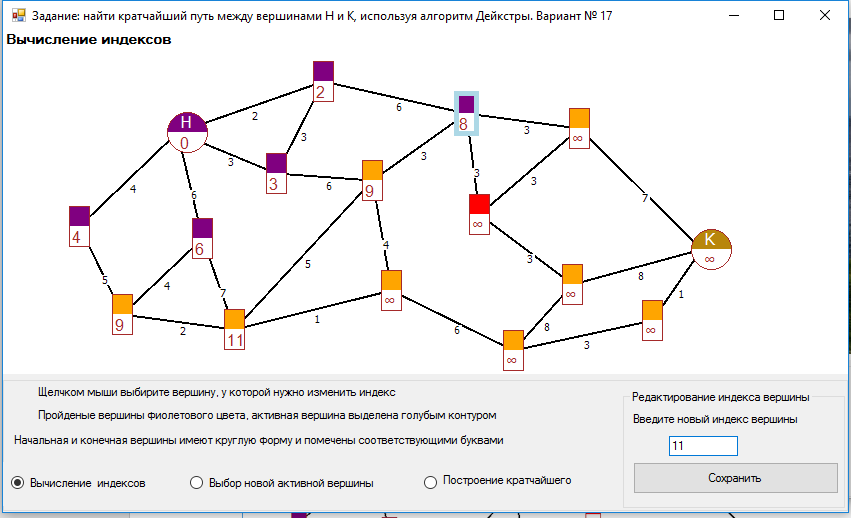
Figure
4. Dijkstra's algorithm.
Each
completed action of the student is checked, errors are reported, and counted.
Just like when checking bypass algorithms, it is allowed to make no more than 3
errors. On the fourth error, all actions are reset to zero, and the student
begins to do the work again.
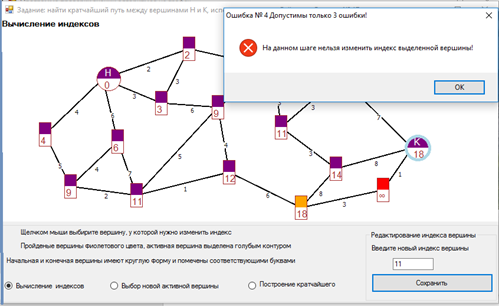
Figure
5. Dijkstra's algorithm. The
work is almost complete, but because of the fourth error, we will have to start
all over again.
Such
"rollbacks" (see Figure 5) mobilize students, they are excited, and
desire to beat the program. Moreover, the program makes it possible to view
descriptions of all the algorithms under consideration.
When
constructing spanning trees and cycles, edge coloring is used, in some cases
partial coloring is used. For example, when constructing a minimum weight
spanning tree, if the user has made a mistake, then he is given the opportunity
to look at one of the correct answer options. In order for the student to compare
this tree with his own, there is a viewing mode with half-colored edges (see
Figure 6). In Figure 6 chords are colored black, the edges of the spanning tree
are yellow.
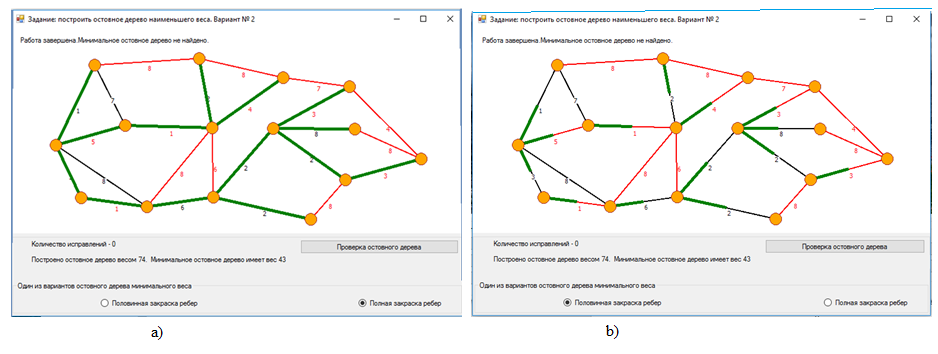
Figure
6. Finding the minimum weight
spanning tree. The student made a mistake and was asked to look at one of the
correct answers. The tree is painted green. In points a) and b) there are
different types of edge painting.
Partial
coloring is also used when working with cycles. For example, when using the
cycle image, it is necessary to find the basic cycles into which the original
one is decomposed. Since it is important to know which chords are included in
the original cycle to solve this problem, partial painting of the edges
included in it is used. If necessary, you can also enable full coloring by
raising the checkbox "full painting of the edges of the cycle", in
this case it is more difficult to find the necessary chords, but the cycle
itself is better viewed. Since the cycle is selected (of course, randomly) in
such a way that it can be represented as the sum of 2 or 3 basic cycles, then
there are three drop-down lists on the form, each of which contains the names
of all basic cycles. To compile the formula, you need to choose the names of
the terms of the cycles.
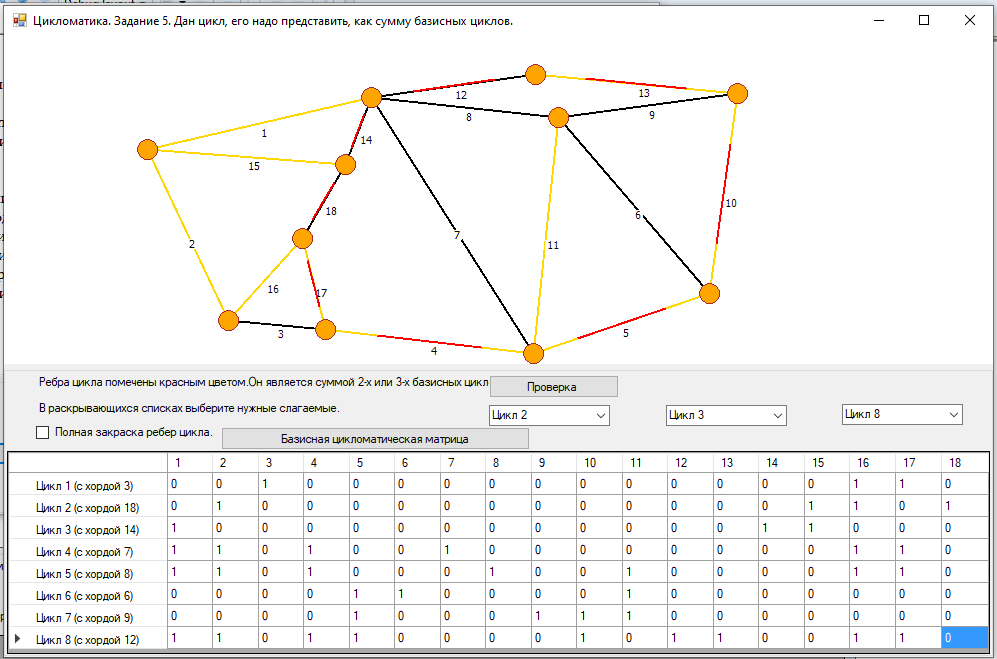
Figure
7. Given a cycle, it is
necessary to find the basic cycles that define it. The edges of the cycle are
partially colored in red. Partial painting can be replaced with a full one.
Figure
7 shows one of the cyclomatic tasks. In this case, not its weight is printed
next to the edge, but its number, which is then used in the cyclomatic matrix.
The program offers several graph theory problems related to topics related to
cycles.
All
these tasks are connected by one goal – the construction of a basic cyclomatic
matrix and its use. Therefore, the work is based on the following plan:
1. Defining a
cycle using a vector consisting of zeros and ones.
a. Construct
a cycle according to a given vector.
b. Construct
a vector according to a given cycle.
2. The basic
system of vectors
a. Building
a spanning tree.
b. Definition
of a cyclomatic number.
c. Construction
of basic cycles included in the system defined by the constructed spanning
tree.
3. Decomposition
of an arbitrary cycle into basic cycles.
a. Two
or three basic cycles are given (their names are indicated, which are used in
the basic cyclomatic matrix) it is necessary to build a cycle equal to the sum
(addition modulo 2 is considered) of these cycles.
b. Given
a cycle (see Figure 7), it is necessary to find the basic cycles into which it
decomposes. The names of the cycles into which the source is decomposed can be
found in the drop-down lists.
Since
the program performs various types of checks at each step, it counts errors and
eventually prints their number.
In
the proposed article, the interdisciplinary task was considered, which is
implemented in the form of the application program [12] used in the study of
the discipline "discrete mathematics". The considered computer
program has proven itself well in distance learning, in addition, and in
full-time classes, it diversifies the learning process, making it more
entertaining, but no less informative. Despite the fact that many conventions
are used when implementing various situations on the screen, students quickly
understand them and use them with confidence.
The
novelty of our research lies in the fact that an interactive computer program
has been developed using graph visualization, which helps to study algorithms
such as "breadth search", "depth search", the Ford-Bellman
algorithm (shortest path search), Dijkstra algorithm (shortest path search),
the algorithm for finding the spanning tree of the least weight, Terry's
algorithm and the rules for constructing a cyclomatic matrix. When introducing
this program into the educational process, it was noted that the learning rate
has increased. Before using the developed program to study algorithms for
finding shortest paths, 2 practical classes were required, one lesson for each
algorithm. After the introduction of the program into the educational process,
it took only one lesson to study both algorithms, while the teacher did not
take stacks of sheets of paper with him for verification. At the exam,
students' answers to questions and tasks on algorithms became more confident,
and 2 additional topics that previously belonged to electives were transferred
to the main program of the discipline.
1.
Kas'janov,
V. N., Evstigneev, V. A. Grafy v programmirovanii: obrabotka, vizualizacija i
primenenie. – SPb.: BHV-Peterburg, 2003. – 1104 c. – 3000 jekz. – ISBN
5-94157-184-4 [in Russian].
2.
Kas'janov
V.N., Kas'janova E.V. Vizualizacija informacii na osnove grafovyh modelej //
Nauchnaja vizualizacija. - 2014.- Tom. 6, N 1. - S. 31 – 50 [in Russian].
3.
Ovchinnikov
V.A. Grafy v zadachah analiza i sinteza struktur slozhnyh sistem. - Moskva,
2014 [in Russian].
4.
Lisitsyn I.A., Kasyanov V.N. Higres – Visualization system for
clustered graphs and graph algorithms // Proc. of Graph Drawing 99. – Lect.
Notes in Comput. Sci. – 1999. – Vol. 1731. – P. 82–89.
5.
Kas'janov
V.N., Zolotuhin T.A. Visual Graph - sistema dlja vizualizacii slozhno
strukturirovannoj informacii bol'shogo ob#ema na osnove grafovyh modelej //
Nauchnaja vizualizacija. - 2015. - Tom. 7, N 4.- S. 44 – 59 [in Russian].
6.
Kasyanov V.N., Kasyanova E.V. Graph- and cloud-based tools for
computer science education // Lecture Notes of Computer Science. - Springer,
2015. - Vol. 9395. - pp. 41-54.
7.
Demetrescu C., Finocchi I., Stasko J. T., Specifying Algorithm
Visualizations: Interesting Events or State Mapping? // In Proc. of Dagstuhl
Seminar on Software Visualization – Lect. Notes in Comput. Sci. – 2001. – P.
16–30.
8.
Gordeev
D.S., Obzor tehnik vizualizacii algoritmov na grafah. // Nauchnaja
vizualizacija. 2018. T. 10. № 1. S. 18-48 [in Russian].
9.
Karpovich
S.E., Dajnjak I.V., Baev V.S., Razrabotka animacionnyh modelej dlja
avtomatizirovannoj obuchajushhej sistemy. //Innovacionnye obrazovatel'nye tehnologii.
2014. № 2 (38). S. 18-24 [in Russian].
10.
Romanov E.L.,
Romanenko T.A. Tehnologija proektirovanija vizualizatorov algoritmov. //Sbornik
nauchnyh trudov Novosibirskogo gosudarstvennogo tehnicheskogo universiteta.
2020. № 4 (99). S. 59-70 [in Russian].
11.
Kuz'mina T.M.
Programma «Jelektronnyj uchebnik po teorii grafov»., //Svidetel'stvo ob
oficial'noj registracii programmy dlja JeVM. №2003611422. Zajavka № 2003610962
ot 29.04.2003 [in Russian].
12.
Kuz'mina T.M.,
Programma proverki znanij algoritmov na grafah., //Svidetel'stvo o registracii
programmy dlja JeVM RU 2018666894, 24.12.2018. Zajavka № 2018664516 ot
17.12.2018 [in Russian].
13.
Kuz'mina T.M.,
Vetrova O.A., Ispol'zovanie komp'juternoj programmy "algoritmy na
grafah" v uchebnom processe., Dizajn i tehnologii. 2019. № 70 (112). S.
135-139 [in Russian].
14.
Kuz'mina T.M.,
Vetrova O.A., Avtomaticheskaja proverka znanij pri izuchenii algoritmov na
grafah., Dizajn i tehnologii. 2018. № 65 (107). S. 136-140 [in Russian].
