The
development of high-latitude areas of the Earth in general and the Arctic zone
of the Russian Federation (AZRF) in particular is inevitably associated with
solving problems related to the behavior and operation of complex technical
objects in the physical conditions of the natural environment of this region.
Increased, and sometimes extreme geomagnetic activity in the auroral and
subauroral zones of the Northern Hemisphere is one of those factors, the
neglect of which leads to a decrease in the overall level of technospheric
safety in the polar regions and, as a result, accidents and technospheric
disasters of various scales.
For
example, a magnetic storm on March 13, 1989 caused the failure of power
transformers and a cascade shutdown (or blackout) of power transmission lines
(PTL) for more than 9 hours in the province of Quebec (Canada) [1]. In the
united power system of the north-west of Russia in November 2001, due to
geomagnetic activity, there were two times of one-way disconnection of the
overhead transmission line (330 kV) "Olenegorsk-Monchegorsk" from the
substation "Olenegorsk", as a result of which consumers with a total
capacity of more than 70 MW were disconnected [2]. In October 2003, a similar
cause resulted in a 20-50 minute power outage in the power system in Malmo in
southern Sweden. From the report of "Zurich Insurance Group" it
follows that in the United States alone, as a result of electrical failures
during the periods of magnetic storms from 2005 to 2015, insurance payments
exceeded $ 1.9 billion [3].
In
papers [4-5] it is noted that almost every strong magnetic storm is the cause
of synchronous anomalies in the signal automation of the northern branches of
the Oktyabrskaya (St. Petersburg – Murmansk) and Severnaya (Yaroslavl – Vorkuta)
railways. In addition, the influence of space weather on technical objects
during periods of magnetic storms is associated with magnetic dragging (damping
of the angular velocity) of artificial satellites of the Earth, satellite
anomalies [6]; violation of short-wave radio communications [7-8]; additional
errors in underground navigation systems during directional drilling of wells
[9], etc.
In
turn, the necessary monitoring of geomagnetic field (GMF) parameters is carried
out today mainly through several hundreds of ground magnetic stations connected
in a network, which are (from the consumer's side) specialized web services
that provide access to time series of geomagnetic data and have tools necessary
to find, preview and download them [10]. However, type and format (usually CSV
corresponding to the IAGA-2002 standard) of the data provided in this way do
not provide an understanding of the properties of the spatial distribution of
the observed parameters, which is necessary both in the tasks of predicting
extreme geomagnetic activity and in preventing / minimizing its consequences.
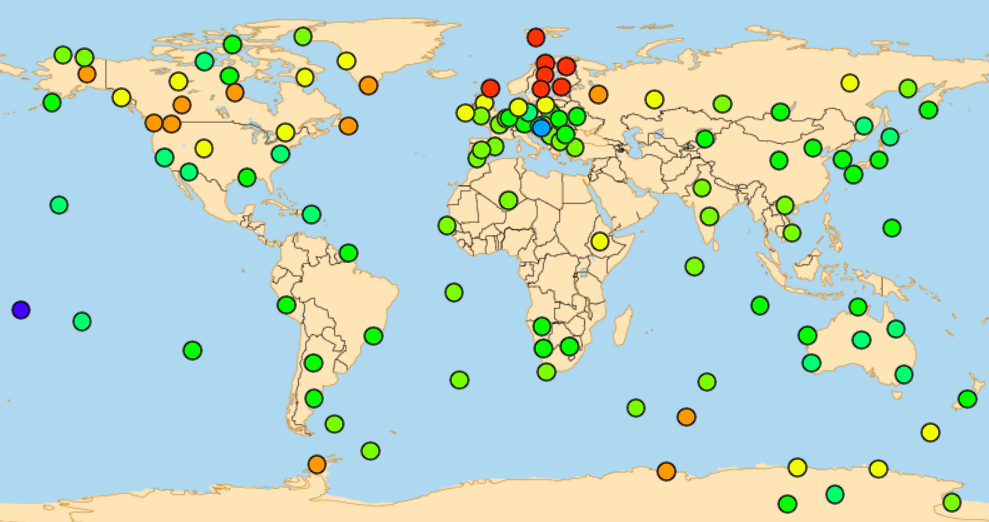
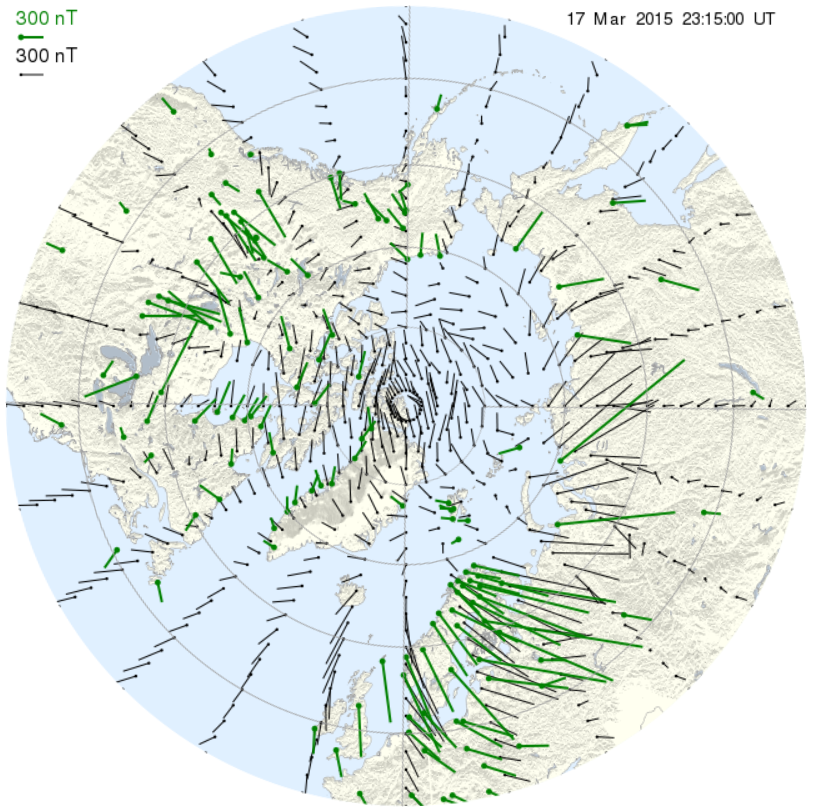
Today
the most popular results of research in this scientific area are concerned with
the services INTERMAGNET (Fig. 1, a) and SuperMag (Fig. 1, b), which form a
general characteristics of spatial distribution of the geomagnetic disturbances
parameters. Along with this, the mentioned services from the leading providers
of geomagnetic data do not actually provide the level of visualization that is
required to identify the properties and structure of the regional distribution
of geomagnetic parameters. So, for example, by means of these systems, due to
their low resolution, it is not possible to distinguish impulse disturbances of
GMF with a characteristic duration of 5–10 min, recorded at polar magnetic
stations with an amplitude of more than 100 nT in both horizontal and vertical
components. In this case, the rate of change in the GMF parameters during such
events can reach up to 30 nT / s, which is many times higher than the
variability of similar parameters during the Quebec event in 1989.
In
addition, the lack of spatial interpolation, tools for express analysis and
interface management (Fig. 1, a), as well as visualization results presentation
in the form of a raster image loaded onto the page (Fig. 1, b) make the
existing approaches ineffective and practically unsuitable for most geophysical
(heliogeophysical) research, and in the tasks of creating an information
environment for problem-oriented decision support systems (for example, in the
field of technosphere safety).
|
|
|
|
a
|
b
|
Fig.
1. Spatial visualization of geomagnetic variations based on data from ground
stations (2015-03-17_23: 15 UT): a - full GMF vector (INTERMAGNET service:
https://www.intermagnet.org/); b - horizontal component of GMF variations in
the northern hemisphere (SuperMAG service: https://supermag.jhuapl.edu/)
Thus,
the development of new, modernization and improvement of the efficiency of
existing systems of analytical control and visualization of the extreme
geomagnetic disturbances parameters (especially according to Decree of the
President of the Russian Federation dated October 26, 2020 No. 645 "On the
Strategy for the Development of the Arctic Zone of the Russian Federation and
Ensuring National Security for the Period until 2035 ”[11]) is an urgent scientific
and technical problem with an acute applied character.
Previously,
in [12-14], the authors considered approaches and presented the results of
web-based visualization of various kinds of geophysical parameters. For
example, in [12], an approach to visualizing the IGRF model of the main
geomagnetic field [15] was proposed and implemented, in [14] as a web-based
approach to visualizing the position of the auroral oval based on the Ovation
Prime model [16], etc.
However,
the problem of visualizing geomagnetic disturbances based on data from
ground-based magnetic stations initially supposes the spatial anisotropy of the
data sources density, which is associated with rethinking and modernizing already
proven techniques. In addition, a web-based mechanism for dynamic visualization
of geomagnetic data is being developed and implemented, as well as a technique
for their presentation in the form of a vector field.
The
research is based on geomagnetic data for 2015 (i.e., the period corresponding
to the maximum activity of the 24th solar cycle (January 2009 - May 2020))
provided by the SuperMAG project (http://supermag.jhuapl.edu/), which is the
international collaboration of leading scientific organizations engaged in
fundamental research of terrestrial magnetism [17-18]. Here, the choice of the
provider, in addition to the vast geomagnetic data base, is also based on the
possibility of optional exclusion of the annual trend and diurnal variations
from the time series, which is also provided by SuperMAG, as a result, allowing
to significantly reduce the time spent on the development of the target
resource and start preparing data for visualization directly from the
formalization of one of the methods spatial interpolation.
So, for
example, according to the Inverse Distance Weighting method, the interpolated
value of a parameter at a given point in a geographic area is determined by the
weighted average sum of deterministic values in its vicinity. In the case of
Shepard's modification used in the research, the level of influence of the
deterministic point on the value
X* is set by the exponent
p
and
with distance from the top of the polygon, including the reference data
sources, its influence on the interpolated value weakens. In other words, for
the case under consideration, the analytical form of the IDW method in
Shepard's modification can be defined as follows:
|
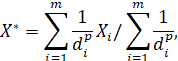
|
(1)
|
where
m
is the number of stations,
Xi
is the value of the GMF
parameter at the
i
-th station,
d
is the distance between the
studied point and the
i
-th station;
p
is the weighting factor (in
this research,
p
= 2.5).
Further,
in order to increase the informativeness of visualization, it makes sense to
divide the available values (including interpolated ones) by quasi-logarithmic
ranges (Table 1) so that the density isodynams within each of them under
conditions of spatial anisotropy, which is especially manifested during periods
of magnetic storms, was equal, or at least comparable. Classification of ranges
in Table 1 is given in accordance with the expected effect of the impact of
geomagnetic variations on technical objects and systems.
Table 1 - Scale of ranges
of values of GMF vector disturbed variations
|
Weak disturbance:
green-yellow gradient
|
Moderate indignation:
yellow-red gradient
|
Strong disturbance:
red-black gradient
|
|
[nT]
|
[nT/min]
|
[nT]
|
[nT/min]
|
[nT]
|
[nT/min]
|
|
|N<| < 200
|
|dN
/
dt<| < 50
|
200 < |N<| < 1000
|
0 < |dN
/
dt<| < 400
|
|N<| > 1000
|
|dN
/
dt<| > 400
|
|
|E<| < 400
|
|dE
/
dt<| < 100
|
400 < |E<| < 1600
|
0 < |dE
/
dt<| < 500
|
|E<| > 1000
|
|dE
/
dt<| > 500
|
|
|Z<| < 400
|
|dZ
/
dt<| < 80
|
400 < |Z<| < 1800
|
0 < |dZ
/dt| < 700
|
|Z<| > 1000
|
|dZ
/
dt<| > 700
|
|
F
< 200
|
|dF
/
dt<| < 60
|
200 <
F
< 900
|
0 < |dF
/
dt<| < 700
|
F
> 1000
|
|dF
/
dt<| > 700
|
|
Note: N, E and Z are the
northern, eastern and vertical components of the GMF vector, respectively; F
- full vector
(F2
=
N2
+
E2
+
Z2)
|
At
the final stage of preprocessing, to the data generated and presented in this
way, we will apply one of the methods for generating isolines on a uniform grid
of values, for example, “Marching squares” [19].
In
general, variations in GMF as an object of visualization represent a structured
set of spatial and attributive data, processing and graphical interpretation of
which, obviously, is advisable to implement using the web-based GIS
technologies. The accumulated experience of building a web GIS for visualizing
geophysical parameters, described in [10, 12-14, 20], showed the consistency of
this software and tools for solving this type of problem.
So,
according to the way of representing spatial data, modern GIS can be divided
into classic flat maps and virtual globes. On the one hand, taking into account
the predominantly high-latitude nature of the objects location, the obvious
advantage of virtual globes is the quality of their visual perception, the
preservation of the geometric similarity of the contours, the ratio of the
areas of the Earth's surface and the absence of cartographic distortions of
projections inherent in flat maps, especially in the polar regions. However, on
the other hand, visualization algorithms based on classical cartographic
substrates, as a rule, do not need hardware acceleration, that is, they are
less demanding on computer performance and are able to provide a result within
a significantly shorter time interval, which determines their efficiency in
dynamic visualization problems at mid and low latitudes. Thus, when developing
a visualization system, it makes sense to provide for the implementation of
graphic models both in a cartographic format and on the basis of the
"virtual globe" technology.
In
addition, it should be noted that the rendering speed of the final image is
largely determined by the resolution of the loaded layers. Taking into account
the density of geomagnetic data sources distribution [17-18] over the Earth's
surface, as well as the boundaries of the most interesting geospatial zones in
terms of visualization (auroraral and subauroral zones, the Arctic zone of the
Russian Federation, etc.), it was found that in order to achieve this goal, it
is advisable to limit small-scale (from 1: 2,000,000 to 1: 10,000,000)
cartographic substrates.
Table
2 compares the characteristics and capabilities of the main programming
libraries that provide work with geospatial data at the web application level.
Table 2 - Current GIS-API
|
Название (URL)
|
Programming Languages
Support
|
Visualization
Mode
|
Free to use
|
Web Access
|
Hardware accelerationе
|
|
JavaScript
|
Python
|
Java
|
|
ArcGIS API (https://developers.arcgis.com/)
|
+
|
+
|
+
|
Map,
Globe
|
+*
|
+
|
+
|
|
Bing Maps V8 Web Control
(https://www.microsoft.com/en-us/maps/web/)
|
+
|
–
|
–
|
Map
|
+*
|
+
|
–
|
|
Cesium (https://cesium.com/)
|
+
|
–
|
–
|
Map,
Globe
|
+
|
+
|
+
|
|
Gio.js (https://giojs.org/)
|
+
|
–
|
–
|
Globe
|
+
|
+
|
+
|
|
Google Maps Platform (https://developers.google.com/maps/apis-by-platform)
|
+
|
–
|
–
|
Map,
Globe
|
+*
|
+
|
–
|
|
Leaflet (https://leafletjs.com/reference-1.7.1.html)
|
+
|
–
|
–
|
Map
|
+
|
+
|
–
|
|
NASA World Wind (https://worldwind.arc.nasa.gov/)
|
+
|
–
|
+
|
Globe
|
+
|
+
|
+
|
|
OpenGlobus API (https://www.openglobus.org/)
|
+
|
–
|
–
|
Globe
|
+
|
+
|
+
|
|
OpenLayers (https://openlayers.org/en/latest/apidoc/)
|
+
|
–
|
–
|
Map
|
+
|
+
|
–
|
|
WebGLEarth (https://www.webglearth.com/)
|
+
|
–
|
–
|
Globe
|
+
|
+
|
+
|
|
WhirlyGlobe (https://mousebird.github.io/WhirlyGlobe/)
|
+
|
–
|
–
|
Map,
Globe
|
+
|
+
|
+
|
|
Yandex
Maps (https://yandex.ru/dev/maps/)
|
+
|
–
|
–
|
Map
|
+*
|
+
|
–
|
|
Note:
* shareware (with restrictions on the number of
requests per day)
|
|
|
|
|
|
|
|
|
|
|
As
follows from Table 2, today there is a fairly wide range of platforms, on the
basis of which it is possible to implement an approach to dynamic visualization
of the spatial distribution of the parameters of geomagnetic disturbances.
Thus,
to solve the problem in a first approximation (without imposing requirements
for the interface, tools, input data, visualization quality, compatibility and
the possibility of further development), any of the listed libraries can be
used (mainly: ArcGIS API, Bing Maps V8 Web Control , Cesium, Google Maps
Platform, Leaflet, NASA World Wind, or WebGL Earth). However, upon closer
examination, given the possibility of flexible expansion by connecting
third-party libraries and APIs based on open standards, the presence of an Open
Source license and a set of methods for processing spatial data most adapted to
the tasks being solved, it is proposed to implement the system based on the
Leaflet and Cesium libraries.
It
is proposed to use the traditional client-server architecture as a basis for
the system developed as a web application (Fig. 2). The server component
combines the data and business logic layers: the first of them is responsible
for connecting to the data providers, and the second one is implemented for
preprocessing the responses received from them. The client component, in turn,
integrates spatial data visualization functions for the user, thus providing
appropriate support for interactive interaction with the application through a
set of user interface elements.
Let's
consider the purpose and features of the data providers used in the proposed
architecture. So, distributed web services behave as data providers, which, in
accordance with various client-server interaction protocols, provide the
ability for program and user clients to receive geomagnetic data in accordance
with the specified spatial and time query parameters. Since not all data
providers provide support for cross-domain requests and data transfer between
providers and consumers (CORS - Cross-origin resource sharing), interaction
with them is implemented exclusively on the server side of the application.
Since
the main business logic of a web application is centered around the acquisition
and processing of multidimensional spatial data, the main criterion for
choosing a server-side scripting language has become the support of libraries
for efficient processing and analysis of spatial data. Using the method of
analyzing hierarchies, the Python programming language was distinguished,
which, when used on the server side, provides operational processing of spatial
data using dynamically linked software libraries. The choice of the programming
language clarifies the client-server architecture of the web application,
dictated, among other things, by the requirements of the Django framework.
The
specificity of this framework and, as a consequence, the architecture of the
developed web application is the separation of the visual presentation and business
logic of the application by means of the MVC (Model - View - Controller)
programming pattern. At the same time, this pattern in relation to Django is
redefined as the MVT (Model - View - Template) format, all components of which
can be used separately, according to the principle of microservice
architecture.
It
is important to note that in the proposed architecture, the M (Model) component
is actually removed from the final application structure. This decision is due
to the fact that the database (in the traditional sense) is not used in the
visualization system, and its functioning is ensured by means of information
flows dynamically obtained from spatially distributed sources of geomagnetic
data. Thus, there is no need to use additional data structures, and,
consequently, the use of the corresponding components of the pattern.
Based
on the tasks of the application, its main functionality is assigned to the
views (V - View). They process the HTTP(S) requests received from the client,
implement the processing of the requested spatial data, and form an HTTP (S)
response, which, when transmitted to the client side, defines a set of spatial
data for subsequent rendering using user agents (browsers).
To
process spatial data, including the processes of collecting it from providers
using existing communication protocols, a number of specialized libraries are
used on the server side of the application: Pandas, NumPy, etc. Some of them
implement the establishment of a connection session with remote data providers
(Pandas), others perform processing received information (Pandas, NumPy).
In
addition, in the developed visualization system, the Pandas-based
representation (V - View) provides aggregation of data received from providers,
their unification, preprocessing and forms the final result in the form of data
array in GeoJSON format. The resulting dataset in GeoJSON format is sent to the
client side for subsequent rendering by the user agent.
Client-side
application scripts are represented by two types of modules, each of which
provides its own version of the web rendering of a spatial image based on the
GeoJSON data received from the server and implements elements of interactive
interaction of the end user with them. In fact, one stream of data from the
server response is interpreted on the client side depending on the rendering
mode selected by the user (flat map or virtual globe).
As
already noted, in this work, the "virtual globe" rendering mode is
implemented on the basis of the Cesium platform, an open JavaScript library for
creating three-dimensional globes and maps in the high-precision WGS84
projection, which ensures high-performance interaction of the application with
users.
Fig. 2.
Client-server architecture of the system (web application) for dynamic
visualization of geomagnetic field disturbances based on data from ground-based
magnetic stations
So,
using the Cesium API, the set of JSON data presented in the server response is
integrated into a single object - the Cesium Entity. Interaction with the
Cesium Entity instance, in turn, is done through the Entity API library, which
provides data-driven rendering techniques. It is in the context of a Cesium
Entity instance that a set of high-level objects and their methods that combine
data and a mechanism for their visualization into a single information
structure. Entity API for manipulating Cesium Entity applies various heuristics
to server-supplied data in response to provide flexible, high-performance
web-based visualization of spatial data, while providing a logical programming
interface.
The
formation of a visual representation of a spatial image within a web
application is directly implemented through the MapCesium class developed on
the basis of the Cesium API. With its implementation, in particular, at the
initial stage of web rendering, an instance of the Cesium-class “Viewer” is
created, which is responsible for drawing the virtual globe. To make the latter
more realistic, a spatial layer is placed on top of the globe, which is
obtained by requesting an instance of the class to the OpenStreetMap map
server. As a result, the basis of the spatial image is formed - the so-called
basic layer.
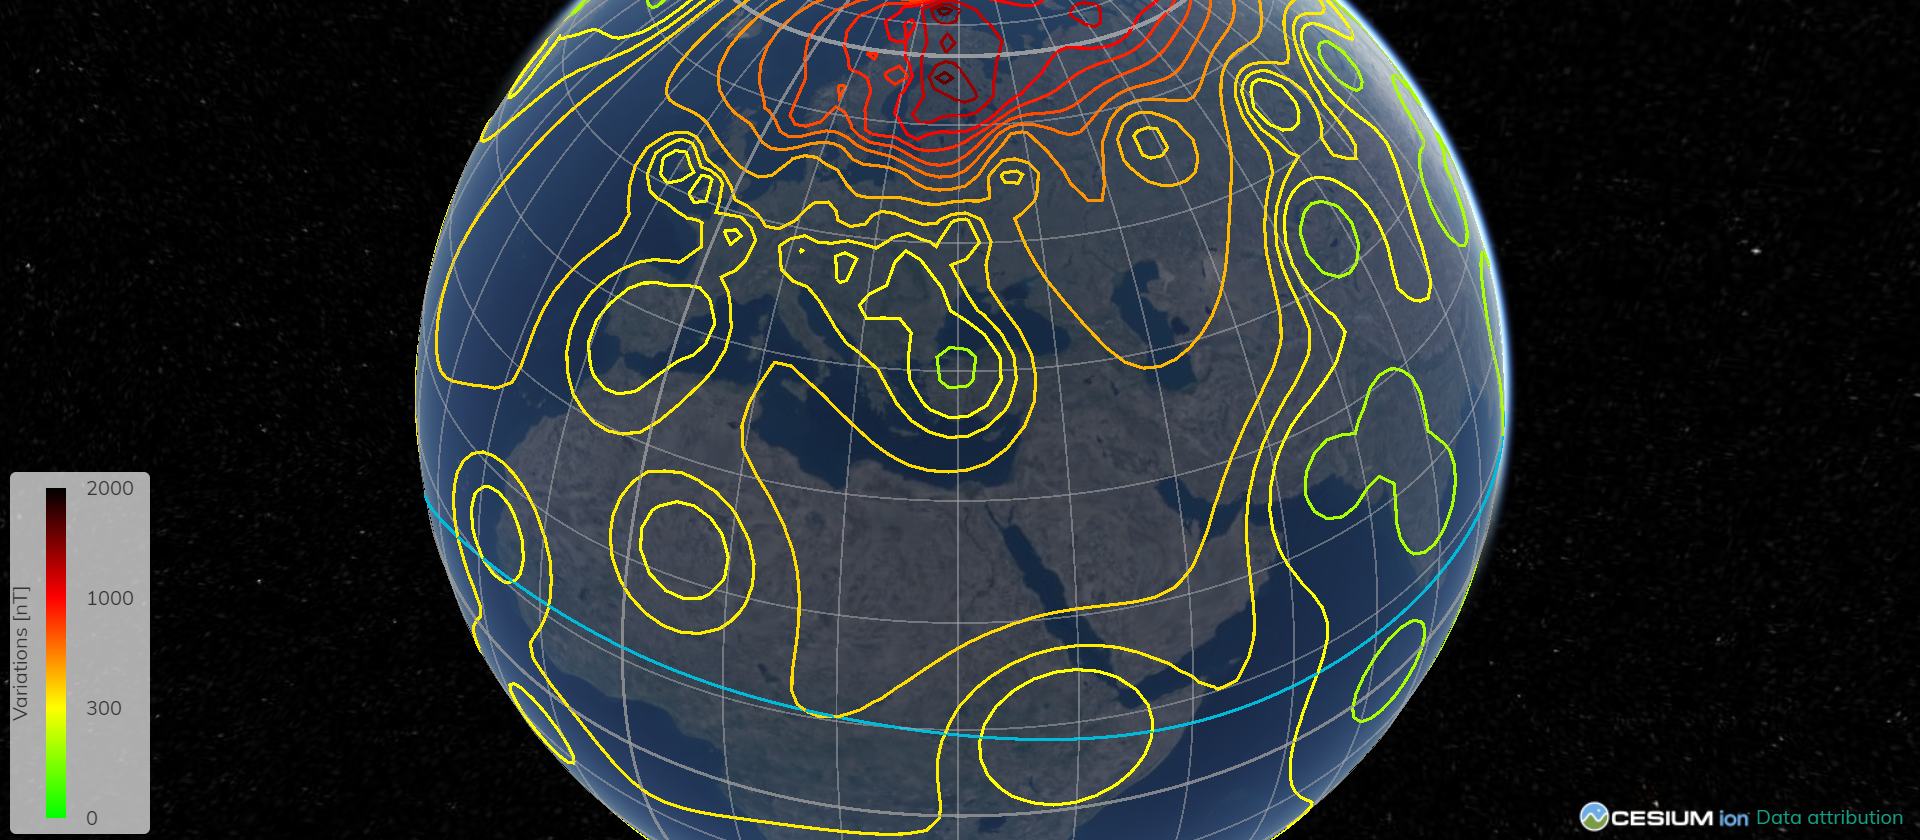
At
the final stage, the created layers are combined - a layer with contours is
superimposed on the basic layer and the final representation of the virtual
globe with the spatial distribution of geomagnetic parameters is formed (Fig.
3, a).
|
|
|
a
|
|
|
|
b
|
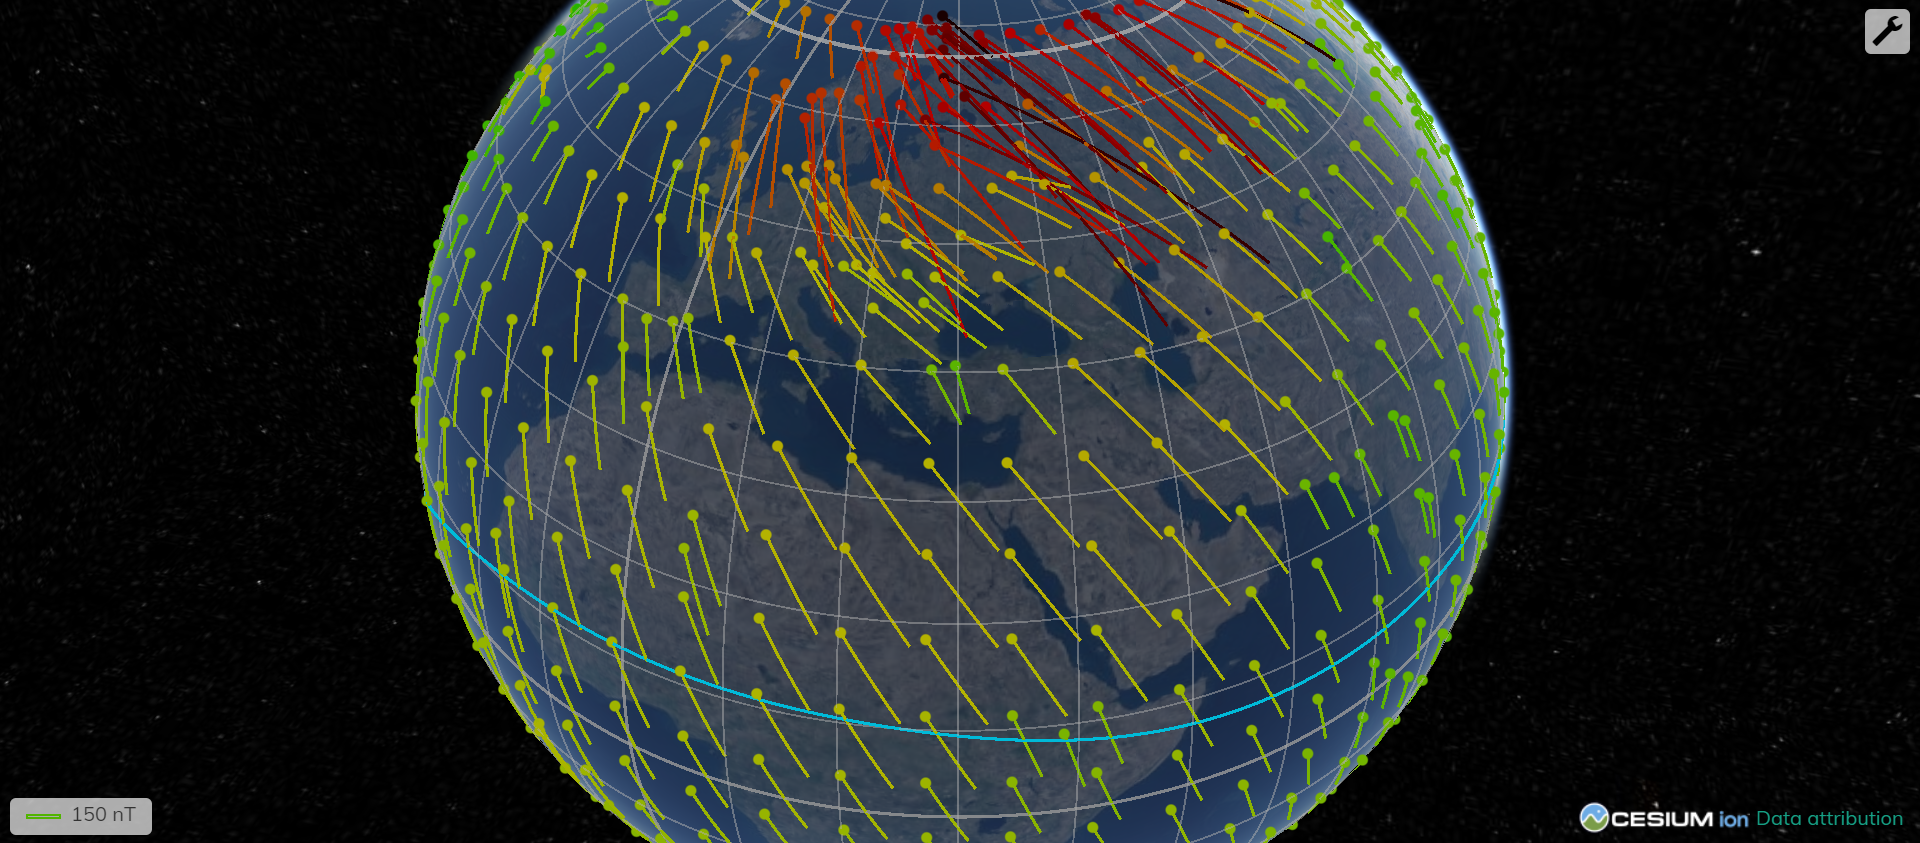
Fig. 3. Result
of visualization of a magnetic storm fragment 2015-03-17 (23:15 UT) on the
basis of a virtual globe in the form of isodynams (a) and a vector field in the
horizontal plane (b)
(The magnetic
equator is marked with a blue line)
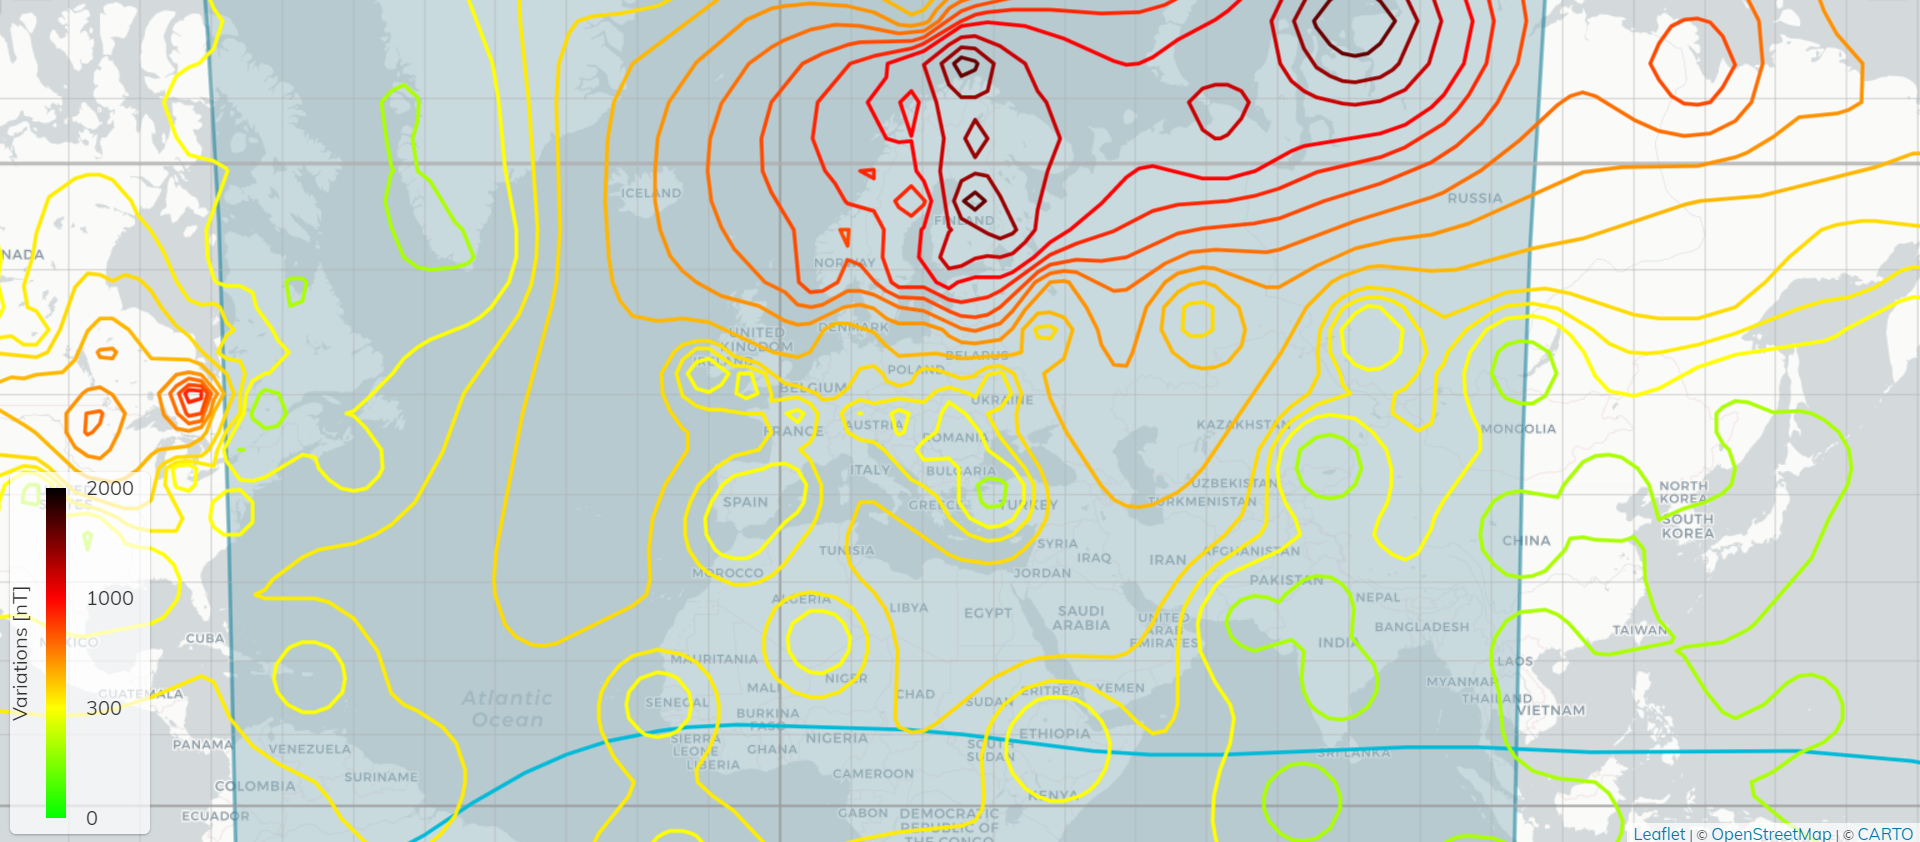
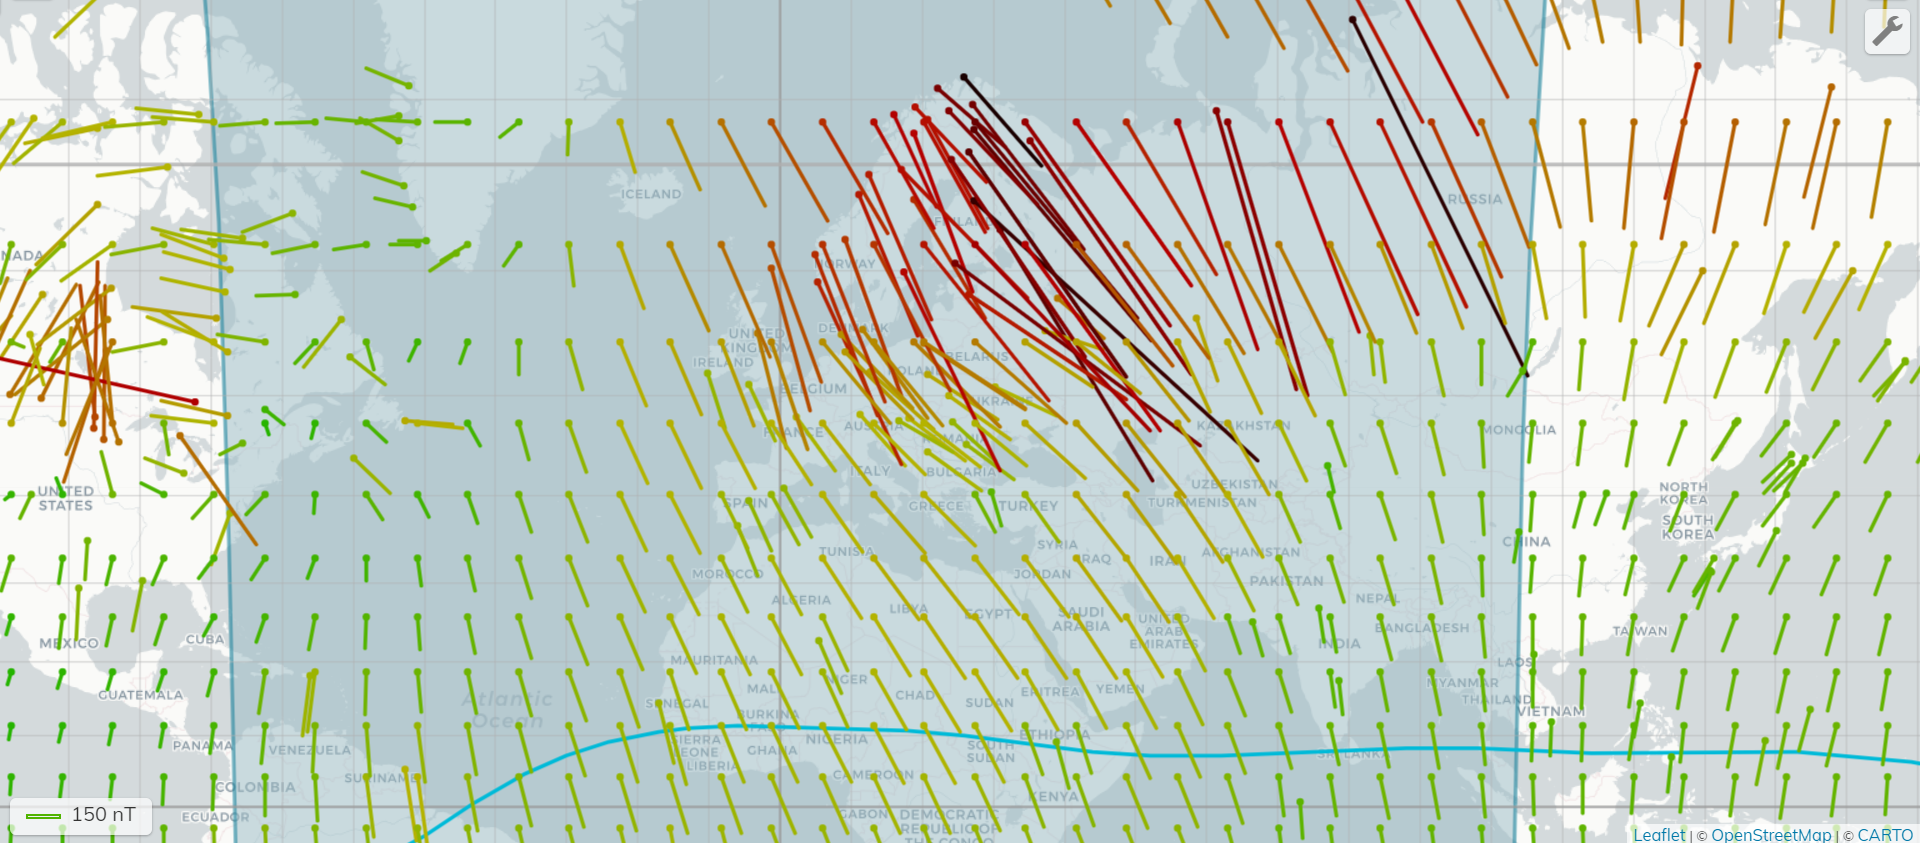
The
solution to the same problem, but with visualization on a flat map, is provided
by another module of the web application, which is responsible for
two-dimensional visualization of spatial data. The module is based on the
Leaflet open source lightweight JS library, which allows processing spatial
data in accordance with open network mapping protocols. At the initial stage,
the base layer is formed by sending a request to the OpenStreetMap server by an
instance of the Leaflet class or a map tile server (Web Map Tile Service). The
Leaflet class provides not only obtaining basic map information from a remote
server, but also rendering this data in a user's browser window in a
device-independent mode.
Analytical
processing of spatial data is implemented using the open source JS library Turf
that allows a user to analyze, aggregate and transform spatial data on the
client side at the web browser level. So, the module of the Turf (“Interpolate”)
library provides the construction of a solid surface with a given grid step
size based on the initial geomagnetic data, and module “Isolines” implements
the formation of a layer of isodynams (Fig. 4, a).
|
|
|
a
|
|
|
|
b
|
Fig. 4. Result
of visualization of a magnetic storm fragment 2015-03-17 (23:15 UT) on the
basis of a flat map in the form of isodynams (a) and a vector field in the
horizontal plane (b)
(The magnetic
equator is marked with a blue line)
At
the final stage (based on the methods of an instance of the Leaflet class), two
generated spatial layers are integrated - the base layer and the contour layer.
Visualization
of the spatial distribution of the GMF parameters in the form of a vector field
(Fig. 3, b; Fig. 4, b) is implemented by forming (for each point) a polylinear
layer representing geomagnetic data in the form of two-dimensional vectors in
the horizontal plane based on the values of the northern and eastern components
vectors:
|

|
(2)
|
where H is a vector
displayed in the horizontal plane; N and E are the northern and eastern
components of the GMF vector, respectively.
In
the process of vector visualization of the H-component on the base layer of a
virtual globe (Fig. 3, b) or a flat map (Fig. 4, b), the initial geographic
coordinates of the measurement point are converted into a rectangular
coordinate system relative to the user's browser window. Further, the values of
the vector are incremented to the obtained coordinates, multiplied by the
corresponding coefficient of proportionality. In this case, the value of the
E-component of the GMF vector is added to the x-coordinate, and the value of
the N-component is subtracted from the y-coordinate. As a result, a set of
coordinates of the end of the vector in a rectangular coordinate system is
formed, which must be converted to geographic for spatial web rendering.
The
described architecture and methods are formalized as a specialized web portal
(https://geomagnetic.ru/), which includes a number of problem-oriented
interactive services necessary for effective monitoring of geomagnetic
disturbances.
So,
Fig. 5 shows the screen form of the "Time Series" service, which
provides manipulation operations with time series of heterogeneous geomagnetic
data (components of the GMF variation vector, geomagnetic activity indices,
substorm onset times, etc.), as well as providing tools for their visual
display.
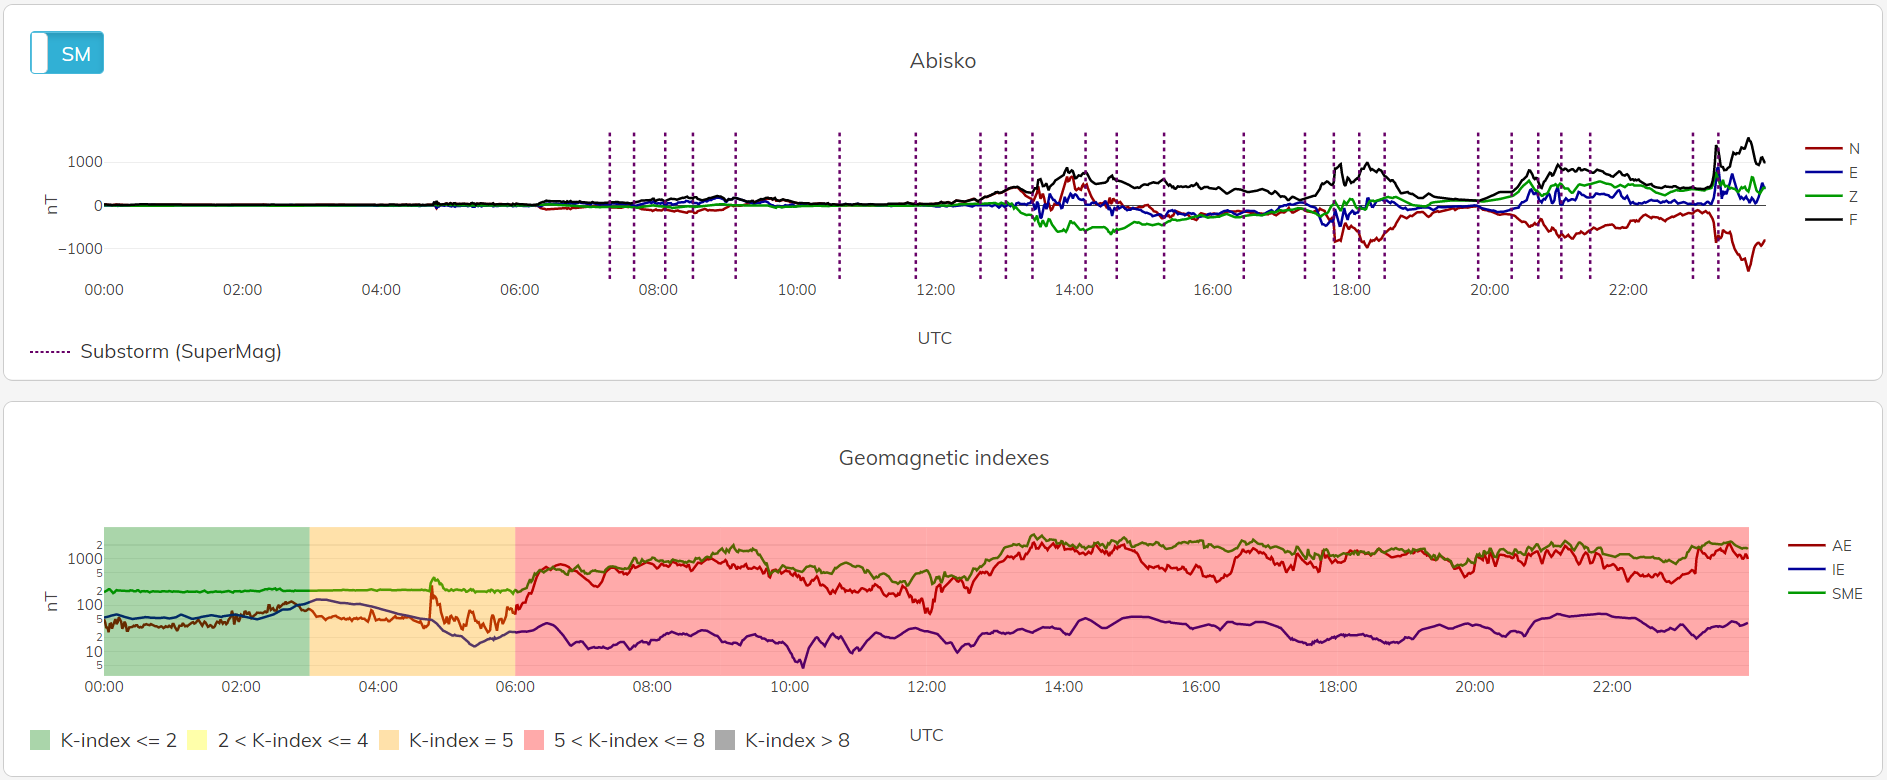
Fig.
5. Visualization of GMF disturbances recorded by the "Abisko" ABK
station for March 17, 2015 (top) and a number of geomagnetic activity indices
(bottom)
The
“GeoSpatial” service visualizes the spatial distribution of GMF parameters
depending on user settings based on a virtual globe (Fig. 3) or flat map (Fig.
4) in the form of isodynams or a vector field, as well as through sequential
synthesis and rendering of layers provides a dynamic visualization (Fig. 6),
which makes it possible to assess the nature of the global change in the
parameters of the GMF not only in space, but also in time.
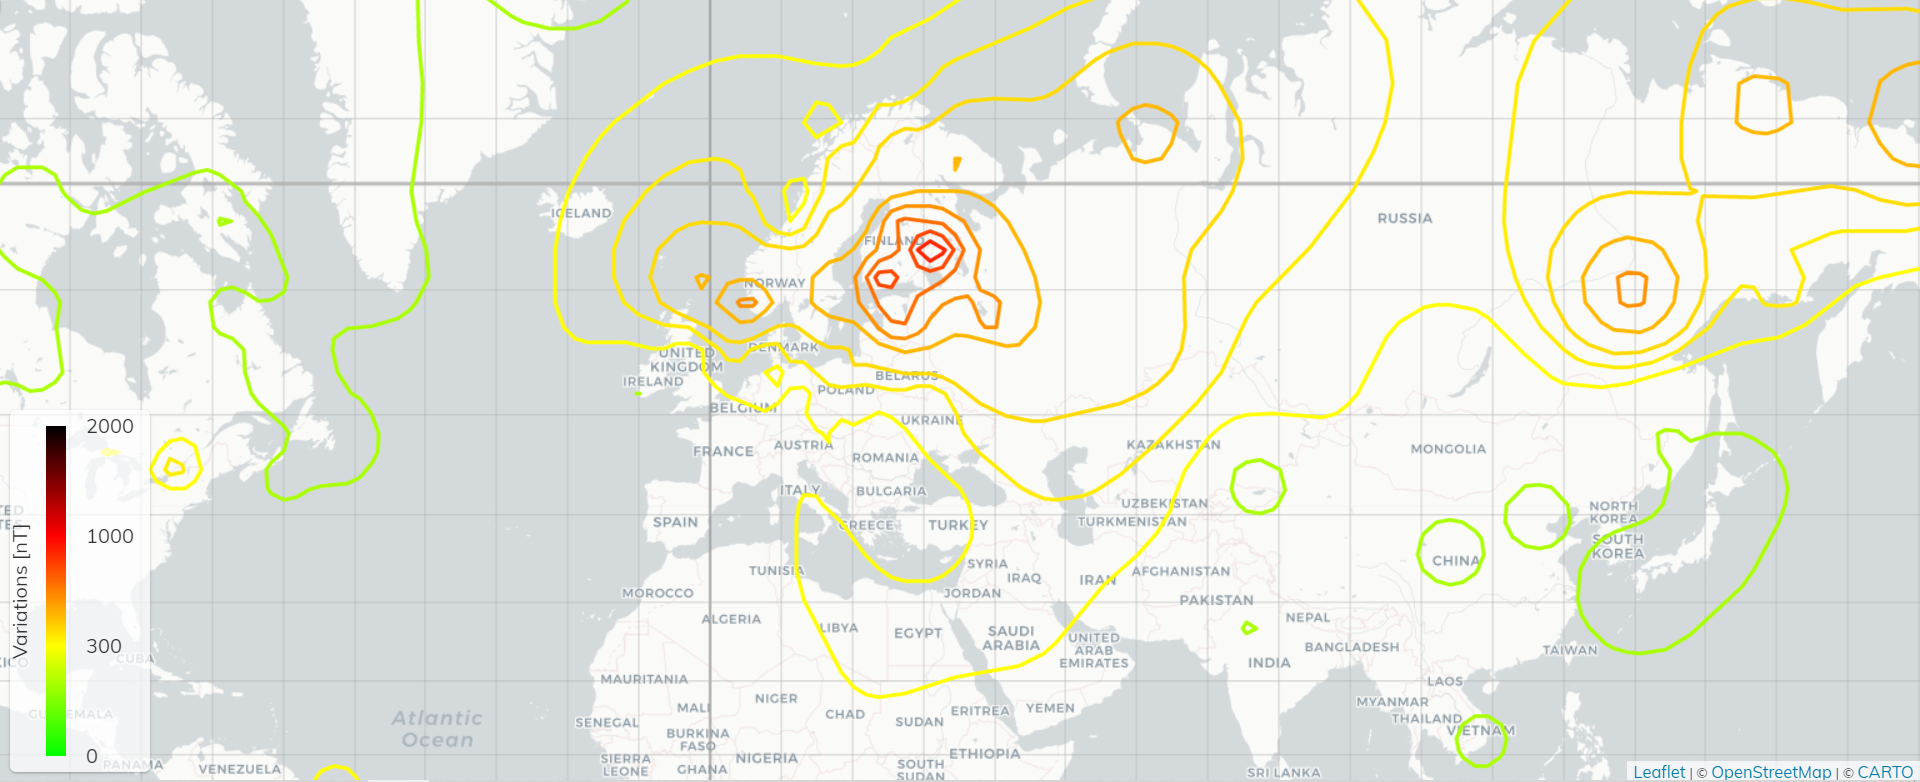
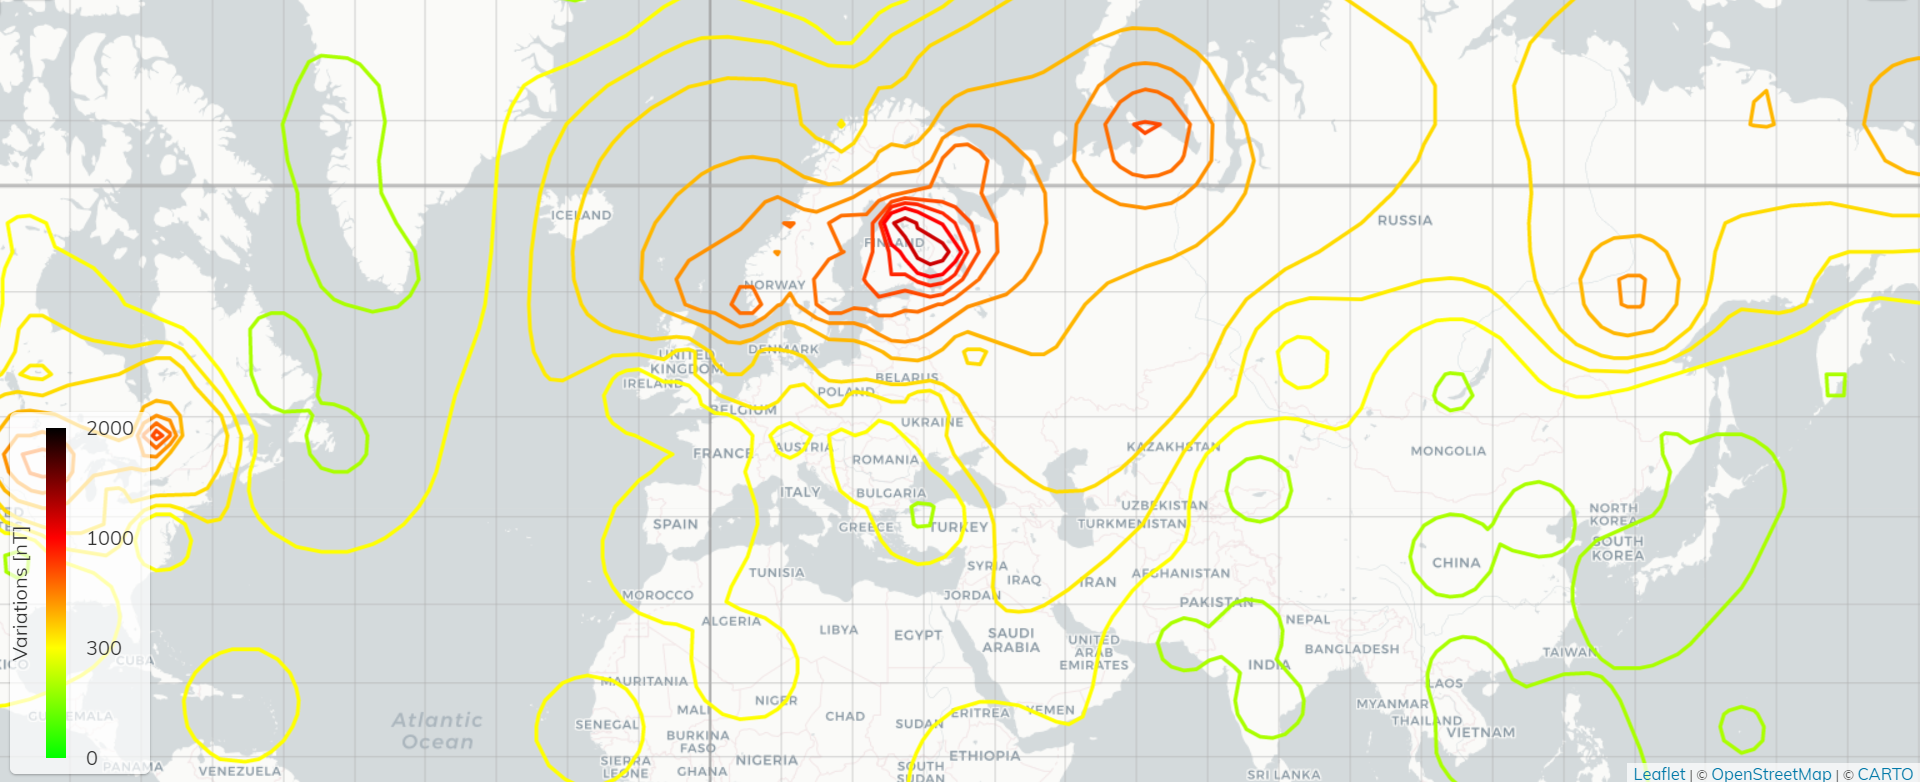
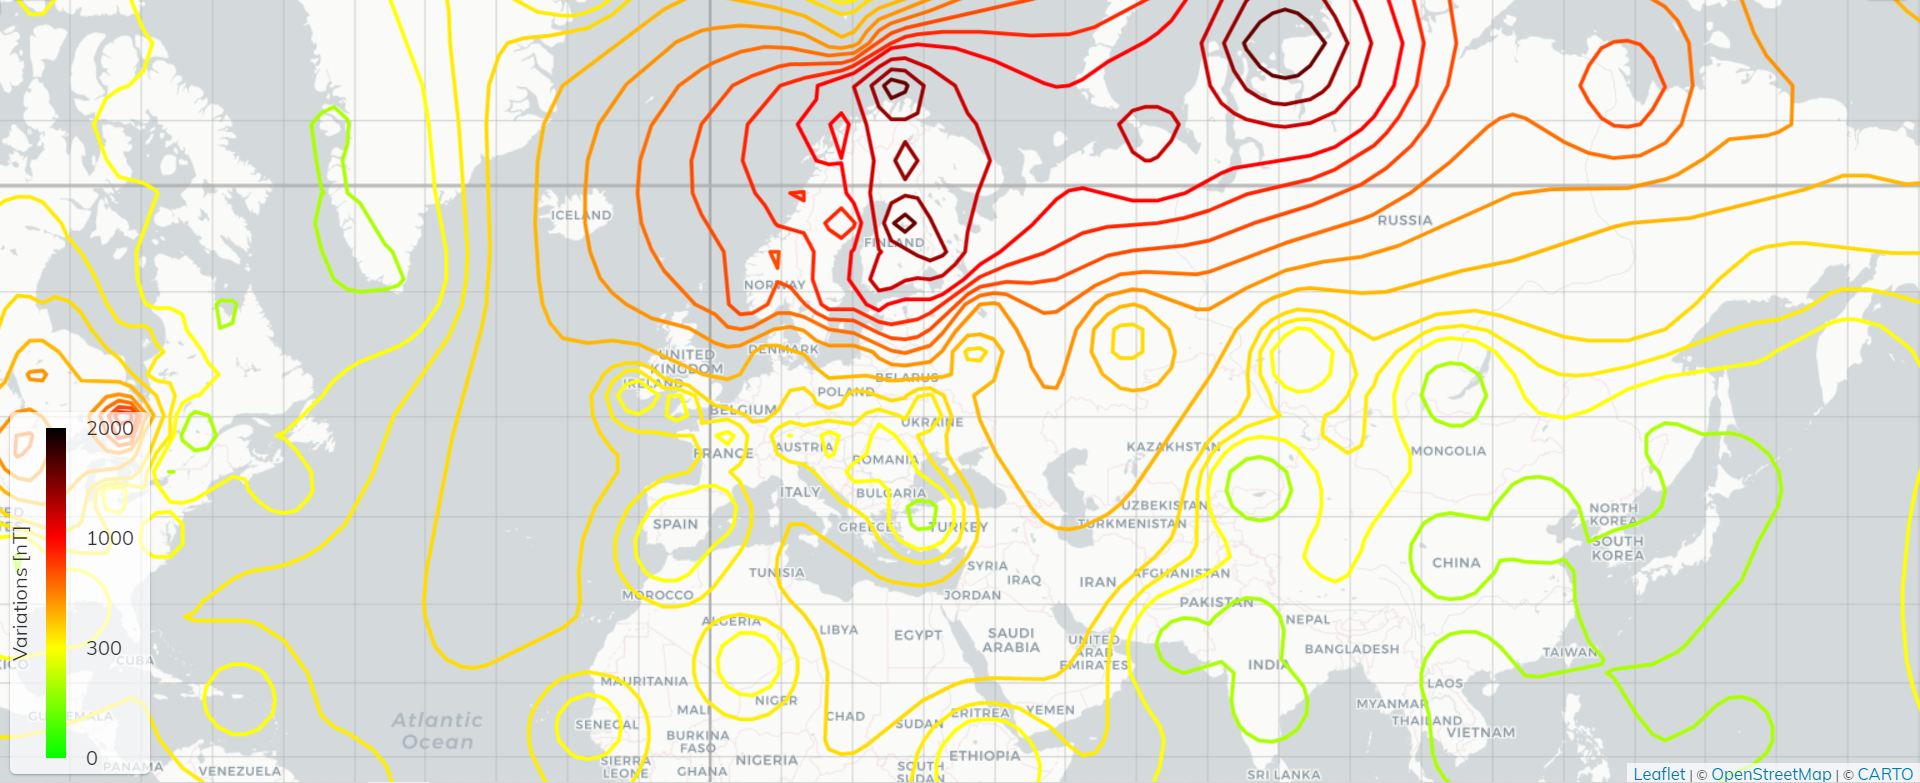
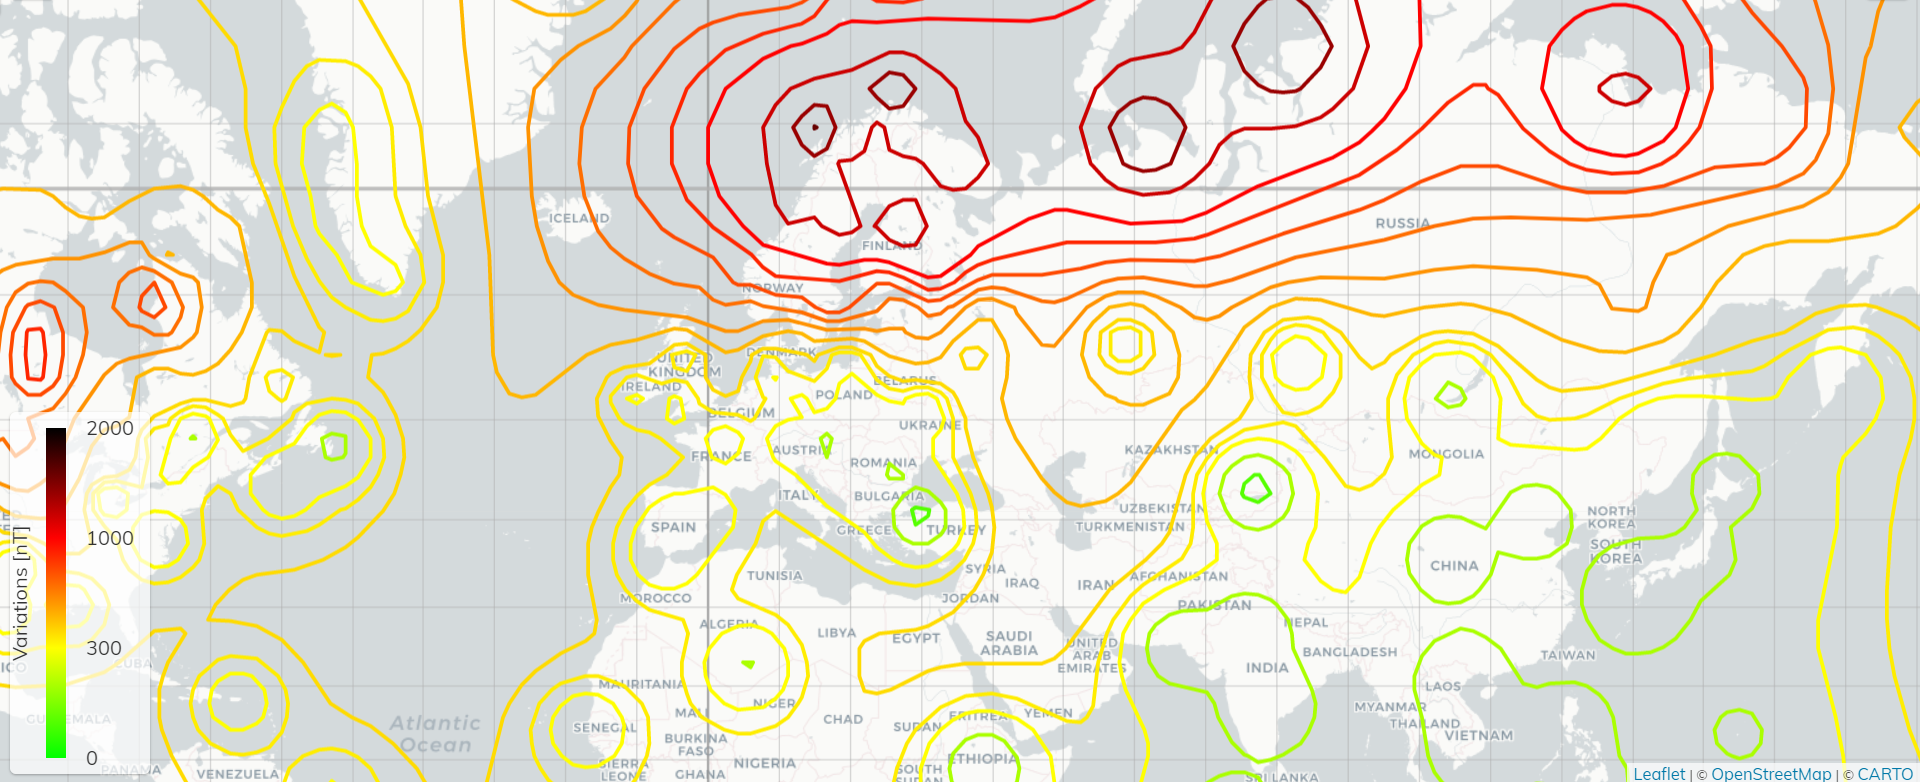
Fig.
6. Frames of dynamic visualization of the spatial distribution of the GMF disturbed
component full vector during the magnetic storm on March 17, 2015: a - 23:05
UT; b - 23:10 UT; c - 23:15 UT; d - 23:30 UT
The
realized ability of the system to work with additional thematic layers (Fig. 7)
allows identifying objects and systems that are most vulnerable in terms of
extreme geomagnetic disturbances impact (high-latitude railways, power lines,
etc.).
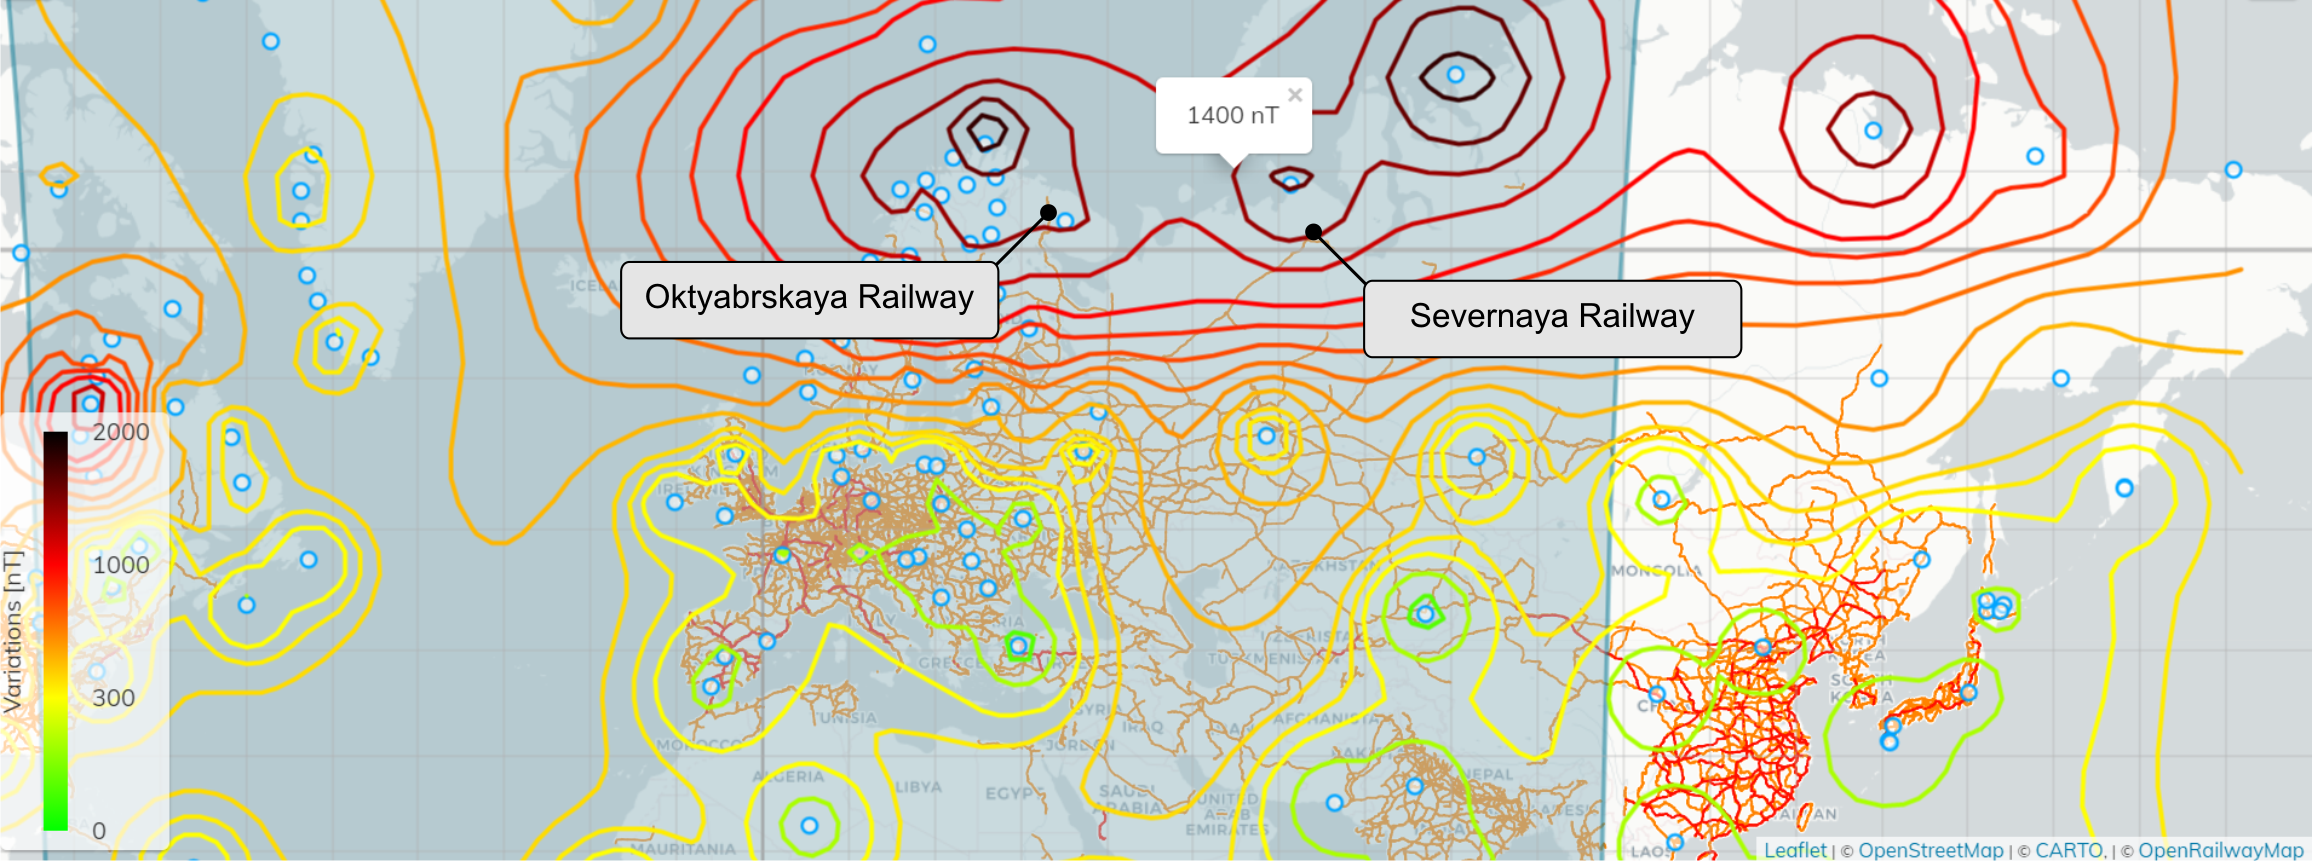
Fig.
7. Comparison of the boundaries of extreme geomagnetic disturbances and the
location of technical objects in the Russian Arctic on the example of
high-latitude railways (Oktyabrskaya and Severnaya railways) 2015-03-17 (23:40
UT)
The
research results published in [21] indicate that the variability of the eastern
component of the GMF (dE / dt) has the greatest correlation with the dynamics
of geoinduced currents (GIC) in the auroral zone. Comparison of the nature of
the spatial distribution of this parameter with the geography of observation of
extreme GIT (Sweden, northern states of the USA, the province of Quebec,
Canada, the Kola Peninsula, the northern region of the Komi Republic (Russia),
etc. [1-5, 7-9]) gives a basis to verify the results obtained (Fig. 8).
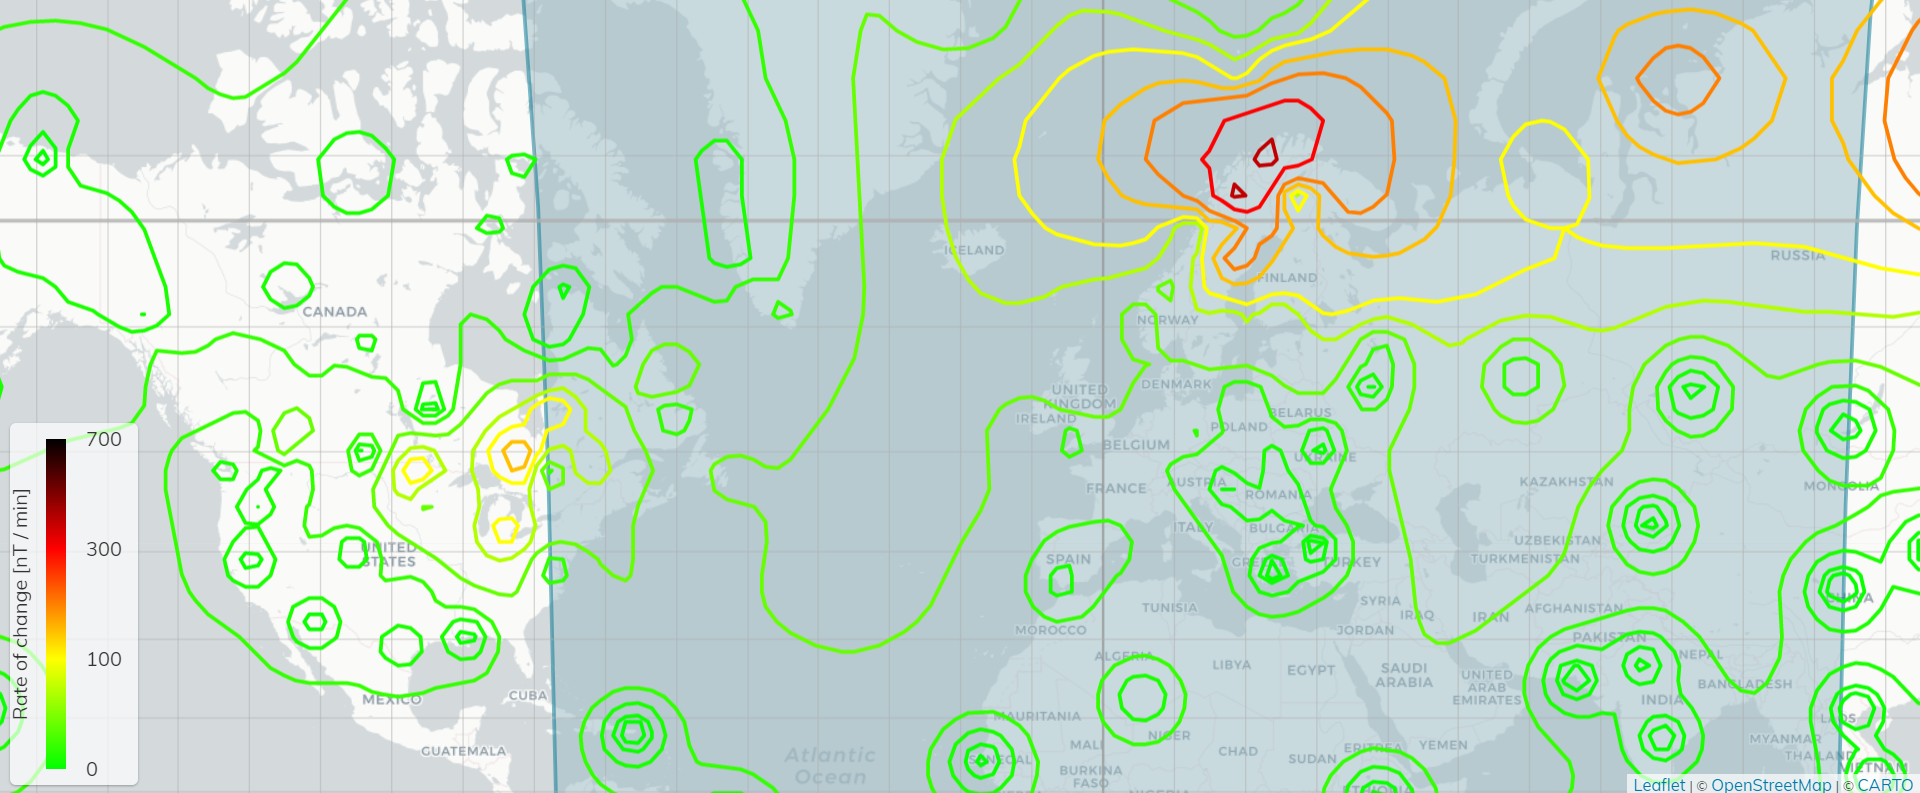
Fig. 8. The
spatial distribution of the parameter dE / dt to the date 2015-03-17 (23:15 UT)
Thus,
using the obtained results, it seems possible to define the geographical
boundaries of regions with a high probability of occurrence of extreme GIT
during periods of magnetic storms and substorm activity. Also, the developed
system provides an estimation of a number of additional parameters, for
example, such as the rate of change in the Earth's surface area
S,
within which the specified parameter of the GMF exceeds (does not exceed) the
specified value
B0:
|
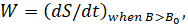
|
(3)
|
where
S
is
Earth surface area, within which the GMF parameter satisfies the condition
B
>
B0;
t
is
a time.
Modernization
and improvement of the efficiency of existing systems for visualization,
monitoring and analytical control of the parameters of the GMF and its
variations in the Russian Arctic is an urgent scientific and technical problem
with an acute applied character, a comprehensive solution of which can provide
an increase in the level of technosphere safety in high-latitude infrastructure
systems.
The
paper is concerned with an approach, an architecture, a model and methods of a
system for visualizing the GMF parameters in both isodynams and a vector field
forms. The system uses the data of ground variation stations provided by
SuperMAG and is based on the Django framework, open-source web-based GIS
platforms and libraries. At the same time, the rendering of the visualized
parameters, depending on the tasks to be solved and user settings, can be
carried out both on the basis of a virtual globe and on the basis of
traditional flat maps in dynamic or static modes.
Currently,
the developed visualization system is at the beta testing stage, i.e. tested by
a wide range of users in order to identify the maximum number of errors in its
work and their subsequent elimination. The proposed system is available at
https://geomagnetic.ru.
It
is assumed that during the operation and development of the system, it will be
possible to identify and predict the geographical boundaries of regions with a
high probability of extreme GIT occurrence during periods of magnetic storms
and substorm activity, which will allow competent individuals and organizations
to make effective decisions in a timely manner and minimize the damage to the
regional economy as a result of the impact of the considered natural factors.
This
work was supported by a grant from the Russian Science Foundation 21-77-30010.
1.
Kataoka
R., Ngwira C. Extreme geomagnetically induced currents // Prog. in Earth and
Planet. Sci., No. 3, 2016, pp. 23.
2.
Danilov
G.A. Povyshenie kachestva fukcionirovanija linij jelektroperedachi: [Improving
the quality of operating power lines]: monograph. Moscow-Berlin, 2015. [in
Russian]
3.
Dobbins
R.W., Schriiver K. Electrical Claims and Space Weather Measuring the visible
effects of an invisible force June 2015 [Electronic resource], URL:
https://static1.squarespace.com/static/57bc8a4a414fb50147550a88/t/57d84e4d1b631b96124f3c69/
1473793614089/2015+Zurich-Electrical+Claims+and+Space+Weather.pdf
4.
Zelenyj
L.M., Petrukovich A.A. Arktika. Kosmicheskaja pogoda [Arctic. Space weather] //
Priroda, No. 9, 2015. P.
31–39.
5.
Kanonidi
H.D., Oraevskij V.N., Belov A.V., Gajdash S.P., Lobkov V.L. Sboi v rabote
zheleznodorozhnoj avtomatiki vo vremja geomagnitnyh bur' [Malfunctions of
railway automation during geomagnetic storms] // Problemy prognozirovanija
chrezvychajnyh situacij: sbornik materialov nauchno-prakticheskoj konferencii,
2002,
P. 41– 42
6.
Afanas'ev
I. B., Baturin Ju. M., Belozjorskij A. G. i dr. Mirovaja pilotiruemaja
kosmonavtika. Istorija. Tehnika. Ljudi [World manned astronautics. History.
Technics. People.]. M.: RTSoft, 2005. 752 p.
7.
Blagoveshhenskij
D. V. Vlijanie geomagnitnyh bur'/subbur' na rasprostranenie kv (obzor)
[Influence of geomagnetic storms / substorms on the propagation of SW] //
Geomagnetizm i ajeronomija, Vol. 53, No. 4, 2013, P. 435–450
8.
Klimenko
M. V., Klimenko V. V., Bessarab F. S. i dr. Vlijanie geomagnitnyh bur' 26–30
sentjabrja 2011 goda na ionosferu i rasprostranenie radiovoln kv-diapazona. i –
ionosfernye jeffekty [Influence of geomagnetic storms on September 26–30, 2011
on the ionosphere and the propagation of radio waves in the sw-range. i -
ionospheric effects] // Geomagnetizm i ajeronomija, T. 55, No. 6, 2015, P.
769–789.
9.
Gvishiani
A.D., Luk'janova R.Ju. Ocenka vlijanija geomagnitnyh vozmushhenij na
traektoriju naklonno-napravlennogo burenija glubokih skvazhin v Arkticheskom
regione [Assessment of the impact of geomagnetic disturbances on the trajectory
of directional drilling of deep wells in the Arctic region] // Fundamental'nyj
bazis innovacionnyh tehnologij neftjanoj i gazovoj promyshlennosti. Materialy
Vserossijskoj nauchnoj konferencii, posvjashhjonnoj 30-letiju IPNG RAN, 2017,
pp. 46. [in Russian]
10.
Vorobev
A.V., Pilipenko V.A., Enikeev T.A., Vorobeva G.R. Geoinformacionnaja sistema
dlja analiza dinamiki jekstremal'nyh geomagnitnyh vozmushhenij po dannym nabljudenij
nazemnyh stancij [Geoinformation system for the analysis of the dynamics of
extreme geomagnetic disturbances based on observations of ground stations] //
Komp'juternaja optika,, Vol. 44, no. 5, 2020, pp. 782-790. [in
Russian]
11.
Decree
of the President of the Russian Federation of October 26, 2020 No. 645 "On
the Strategy for the Development of the Arctic Zone of the Russian Federation
and Ensuring National Security for the Period until 2035" [Electronic
resource], URL: https://www.garant.ru/products/ipo/prime/doc/74710556/. [in
Russian]
12.
Vorobev
A.V., Vorobeva G.R. Web-oriented 2D/3D-visualization of geomagnetic field and
its variations parameters // Scientific Visualization, vol.9, 2017, pp.94-101
13.
Vorobev
A.V., Vorobeva G.R. Visualization of geomagnetic variations in time-frequency
area of information signal // Scientific Visualization, no. 11.2, 2019, pp. 143-155,
doi: 10.26583/sv.11.2.11
14.
Vorobev
A.V. , Pilipenko V.A. , Reshetnikov A.G. , Vorobeva G.R. , Belov M.D. Web-orientirovannaja
vizualizacija geofizicheskih parametrov v oblasti avroral'nogo ovala [Web-based
visualization of geophysical parameters in the area of the auroral oval] // Nauchnaja
vizualizacija, No. 12.3, P. 108–118, DOI: 10.26583/sv.12.3.10.
15.
GOST
25645.126-85 Model' polya vnutrizemnykh istochnikov [Geomagnetic field. Model
of the field of intraterrestrial sources (with Amendment No. 1)] available:
http://docs.cntd.ru/document/gost-25645-126-85 (access mode: 1.03.2021)
16.
Machol
J. L., Green J. C., Redmon R. J., R. [et al.] Evaluation of OVATION Prime as a
forecast model for visible aurora // Space Weather, no. 10, 2012, p. S03005, doi:10.1029/2011SW000746.
17.
Gjerloev
J. W. The SuperMAG data processing technique // J. Geophys. Res., No. 117,
2012, pp. A09213
18.
Newell
P. T., Gjerloev J. W. Evaluation of SuperMAG auroral electrojet indices as
indicators of substorms and auroral power // J. Geophys. Res., no. 116, 2011,
pp. A12211.
19.
Maple
C. Geometric design and space planning using the marching squares and marching
cube algorithms // Proc. 2003 Intl. Conf. Geometric Modeling and Graphics,
2003, pp. 90–95.
20.
Vorobev
A.V., Pilipenko V.A., Krasnoperov R.I., Vorobeva G.R., Lorentzen D.A.
Short-term forecast of the auroral oval position on the basis of the ``virtual
globe'' technology // Russ. J. Earth Sci., no. 20, 2020, pp. ES6001.
21.
Vorobev
A.V., Pilipenko V.A., Saharov Ja.A., Selivanov V.N. Statisticheskie
vzaimosvjazi variacij geomagnitnogo polja, avroral'nogo jelektrodzheta i
geoinducirovannyh tokov [Statistical relationships of variations in the
geomagnetic field, auroral electrojet and geoinduced currents] //
Solnechno-zemnaja fizika, vol.5, no.1, 2020, pp. 48–58. [in Russian]