Consumer transactions analysis is a fundamental component for companies to build strong customer relationships and make good decisions. Visualization can help with such tasks. Existing visualization methods of transaction data analysis often focus on specific purposes, such as abnormal behavior detection and stock analysis. Most of current systems focus on analyzing time-varying transaction pattern and on analyzing web-scrape data. Few of them are used to analyze the shopping behavior of customer clusters in physical stores. In this study, we present a visualization system to facilitate the process of transaction data exploration. Our system focuses on functions of customer clustering and exploration of customer characteristics. A distribution view embedded in our system visually demonstrates consumer clustering generated by a dimensional reduction algorithm. The visual clusters allow analysts to explore the characteristics of customers in different clusters. In addition, the correlation hinting method provided by our system automatically highlights overlapping subsets of consumers. It can guide analysts to explore interesting customer clusters. In sum, our system helps analysts to find customers with similar behaviors, observe characteristics of interesting subsets, and determine the correlation among data attributes. We validate our system with the consumer transaction data from our collaborating department store. Used cases and findings are provided to show the usability of the system.
Consumer
transaction data have been rapidly growing due to the popularity of using
computers in business [12]. Numerous companies have utilized data analysis
technology to improve their services and attract more customers [13]. Compared
with data mining approaches that often only offer final results, visual
analytic systems could better fit analysts' needs, because visual systems allow
analysts to explore data flexibly and then use their domain knowledge to
develop appropriate sales strategies during the exploration process. Many
visual analytic systems for analyzing consumer transaction data have been
proposed [23]. These visualization systems are often designed for special
purposes, such as individual consumption analysis [20], abnormal behavior
detection [27] or customer location analysis [18]. Unlike them, our system is
designed to explore the shopping patterns of different customer clusters.
Although there are some researches also trying to analyze transaction patterns,
most of them focus on analyzing time-varying patterns, not the shopping
patterns of different customer clusters. Analysts need a system that can help
them define different customer clusters, explore the consumer behavior of
different clusters, and then they can develop sales strategies for different
clusters.
In
this study, we introduce a visualization system for the exploration of consumer
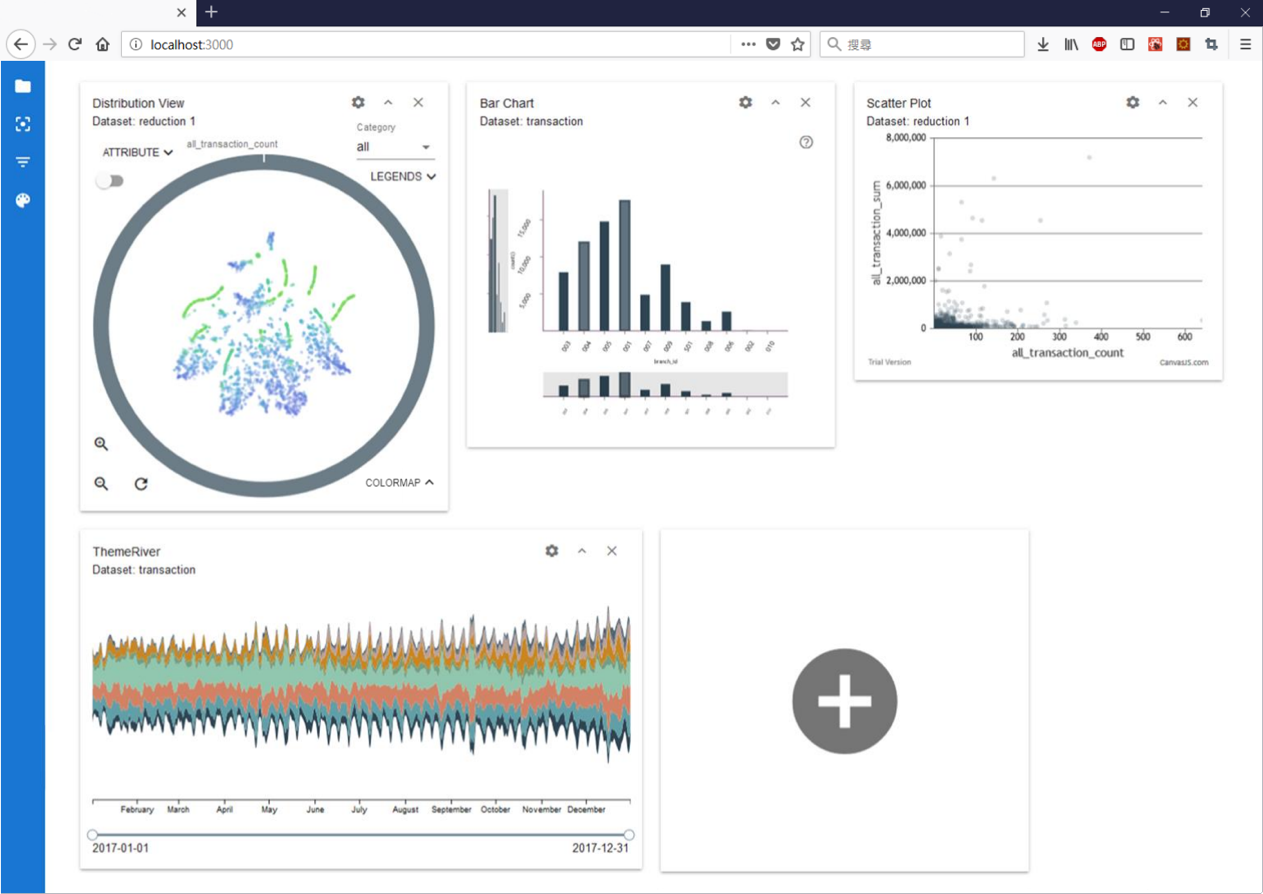
clusters (Figure 1). Specifically, our system provides a
Distribution View,
which allows analysts to conduct dimensional reduction on consumers
high-dimensional data and visualize the results in a 2D scatter plot. This view
assists analysts to visually detect consumer clusters. Also, we develop a
method of
Correlation Hinting, which can automatically highlight
interesting clusters and guide analysts for further exploration. In addition,
our system also provides basic charts that analysts can choose to add to the
interface, such as bar charts and ThemeRiver. Analysts can generate charts by
selecting the attributes they are interested in, perceive and interact with
data via visual representations, and intuitively obtain findings from large
complex datasets. Identifying the relationship among multiple aspects of data
thus becomes easy with the assistance of multiple dimensions of interactivity
combined with coordinated multiple views.
Figure 1. A snapshot of
our system.
This
study intends to make the following contributions: (1) a visual analytic system
that allows analysts to effectively analyze consumer clusters, (2) a
distribution view of data scatters that can show the consumer data points under
the dimensional reduction and visual abstraction of multivariate data, and (3)
a correlation hinting method to guide analysts to explore data.
Useful
surveys on visualization system for financial data can be found in [23] and
[24]. Many visualization systems are designed to detect anomalies and find
frauds as they are the major requirement for existing commerce platforms. Chang
et al. [3] presented a set of coordinated visualizations based on identifying
specific keywords within the wire transactions. Novikova and Kotenko [15]
proposed an interactive multi-view approach to describe money transfer
activities. The proposed visual representation helps to identify anomalous
activities. VAET [17] was a time-series visualization system which can find the
representative transaction patterns in the transaction log and identify false
consumption behaviors. A visualization system EVA [27] was proposed to support
fraud investigation and fine-tune fraud detection algorithms. Didimo et al.
[31] drew graph patterns to convey time-varying information for the visual
analysis of temporal networks in the fiscal domain, aimed to contrast tax
evasion, fiscal frauds, and money laundering. Singh and Best [22] demonstrate
that a multi-view visualization system is able to assist auditors in reviewing
transaction data. Few years later, they proposed a framework for detection of
money laundering activities based on visualization of monetary transactions
[32]. Leite et al. [30] proposed NEVA, a visual exploration environment to
support the analysis of customer networks in order to reduce false negative and
false positive alarms of frauds.
In
addition to anomalous activity detection, financial data visualization is also
used for other tasks. A common task is the analysis of stock data which
contains time series of share prices of companies over a long time, including
trend, pattern, performance, and predictive analysis [11, 25]. Keim et al. [4] used
value cells within bar charts to represent business metrics to assist analysts
in identifying specific areas. Liu et al. [8] designed and implemented
SellTrend based on treemap and timeline to analyze airline travel purchase. Yue
et al. [29] presented BitExTract to explore the evolutionary transaction
patterns of Bitcoin exchanges from two perspectives: exchange versus exchange
and exchange versus client.
Summarizing
the above visualization methods, most visualization systems focus on detecting
abnormal transactions, while the goal of our system to gain insight into
consumer behavior. In addition, previous studies often focus on analyzing
time-varying pattern, whereas our system targets consumer clusters and helps
analysts explore and analyze the consumption behavior of different consumer
clusters.
Roberts
and Laramee [28] provided an excellent review of visualising customer data.
Early literature on customer-centric visualisation focused on presenting
customer feedback. Broadbeck and Girardin [1] presented a visualisation tool
that uses parallel coordinates combined with a tree structure to analyse
customer feedback data. Ziegler et al. [5] presented a system that uses
clustering techniques to analyse textual customer feedback data from an
unspecified online feedback website. Oelke et al. [9] presented a visual
analysis of web scraped customer review data using a matrix grid that compares
multiple products against a range of features. Wu et al. [10] presented
OpinionSeer to visualize customer feedback of hotels. The main focus of this
visualisation is the scatter plots in the opinion triangle and the opinion
wheel.
With the increasing
availability of data from mobile phones, customer-centric visualisation
research was shifted to customer behaviour research. Yaeli et al. [18] analysed
the movement of customers shopping in retail stores. Shi et al. [16] presented
a visual analytics system that tracks user's loyalty of search engine and the
behaviour of users switching between different search engines. Dou et al. [19]
presented, an analytics system that helps analysts with exploring insight into
economic, behavioural and social issues through demographic analysis. Wu et al.
[21] used a contour based treemap and a geospatial heat map to present the
behavioural patterns in potential customers through the data obtained from
China largest telecommunications company.
Our system is also a
study to analyze customer behavior. It is worth noting that most of the
above-mentioned customer behavior data is retrieved from the Internet, while
our customer consumption data comes from physical stores. In addition, above
methods usually use algorithms to group customers into some clusters. Their
grouping algorithms may refer to previous customer behavior. However, the
behavior of customers is always changing, and automatically grouping consumers
may limit the possibilities for analysts to explore. On the contrary, our
system provides a scatter plot to represent every customers using a dimensional
reduction algorithm. Analysts can discover and define consumer clusters on
their own, without being affected by previous data, and can respond to rapid
changes in the market.
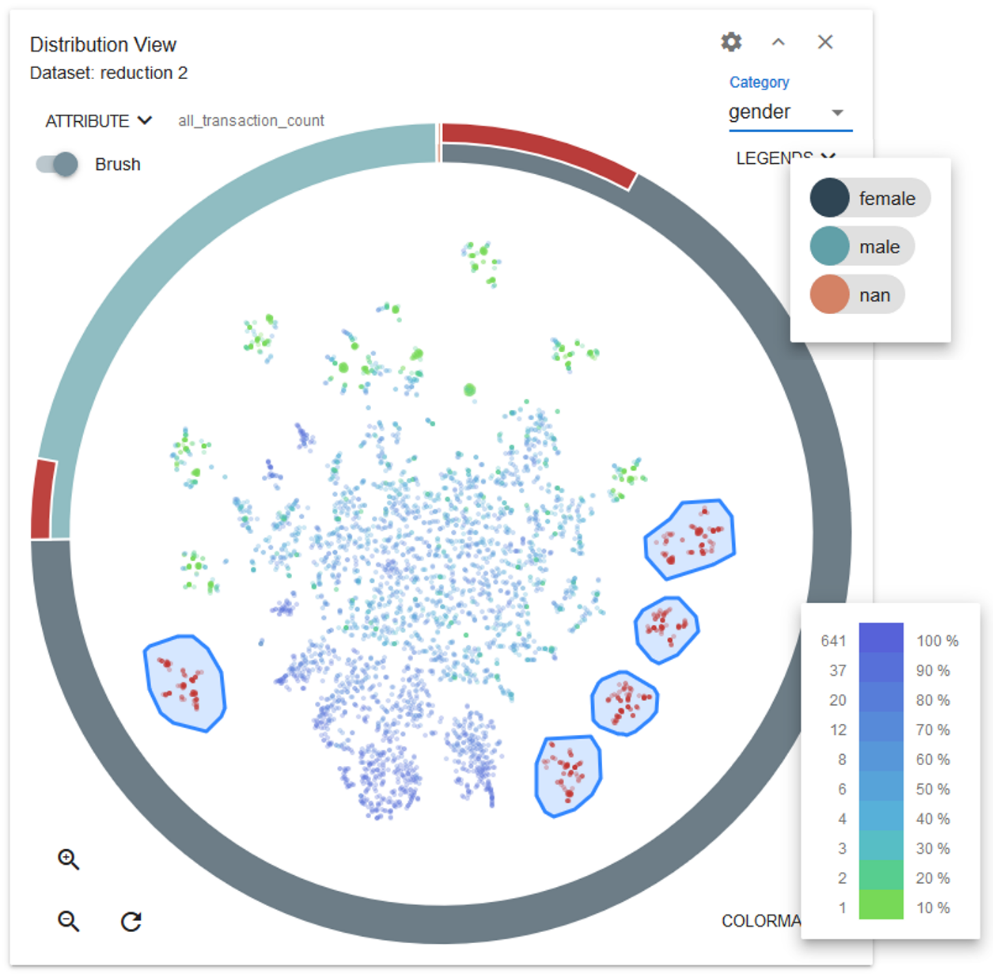
Our
system should allow analysts to display high-dimensional data in an
easy-to-observe manner to provide an efficient way to demonstrate the
characteristics of multivariate data. Therefore, a distribution view is
provided (Figure 2). Dimensional reduction algorithm [26] is utilized to reduce
the high-dimensional attributes of consumers into 2D space. Analysts can thus
discover the relationship of consumer records by observing the visualized
clusters generated from dimensional reduction algorithm. In this study,
t-distributed stochastic neighborhood embedding (t-SNE) is utilized as our
dimensional reduction algorithm, as this algorithm preserves local distances of
high-dimensional data and is particularly suited for visualization.
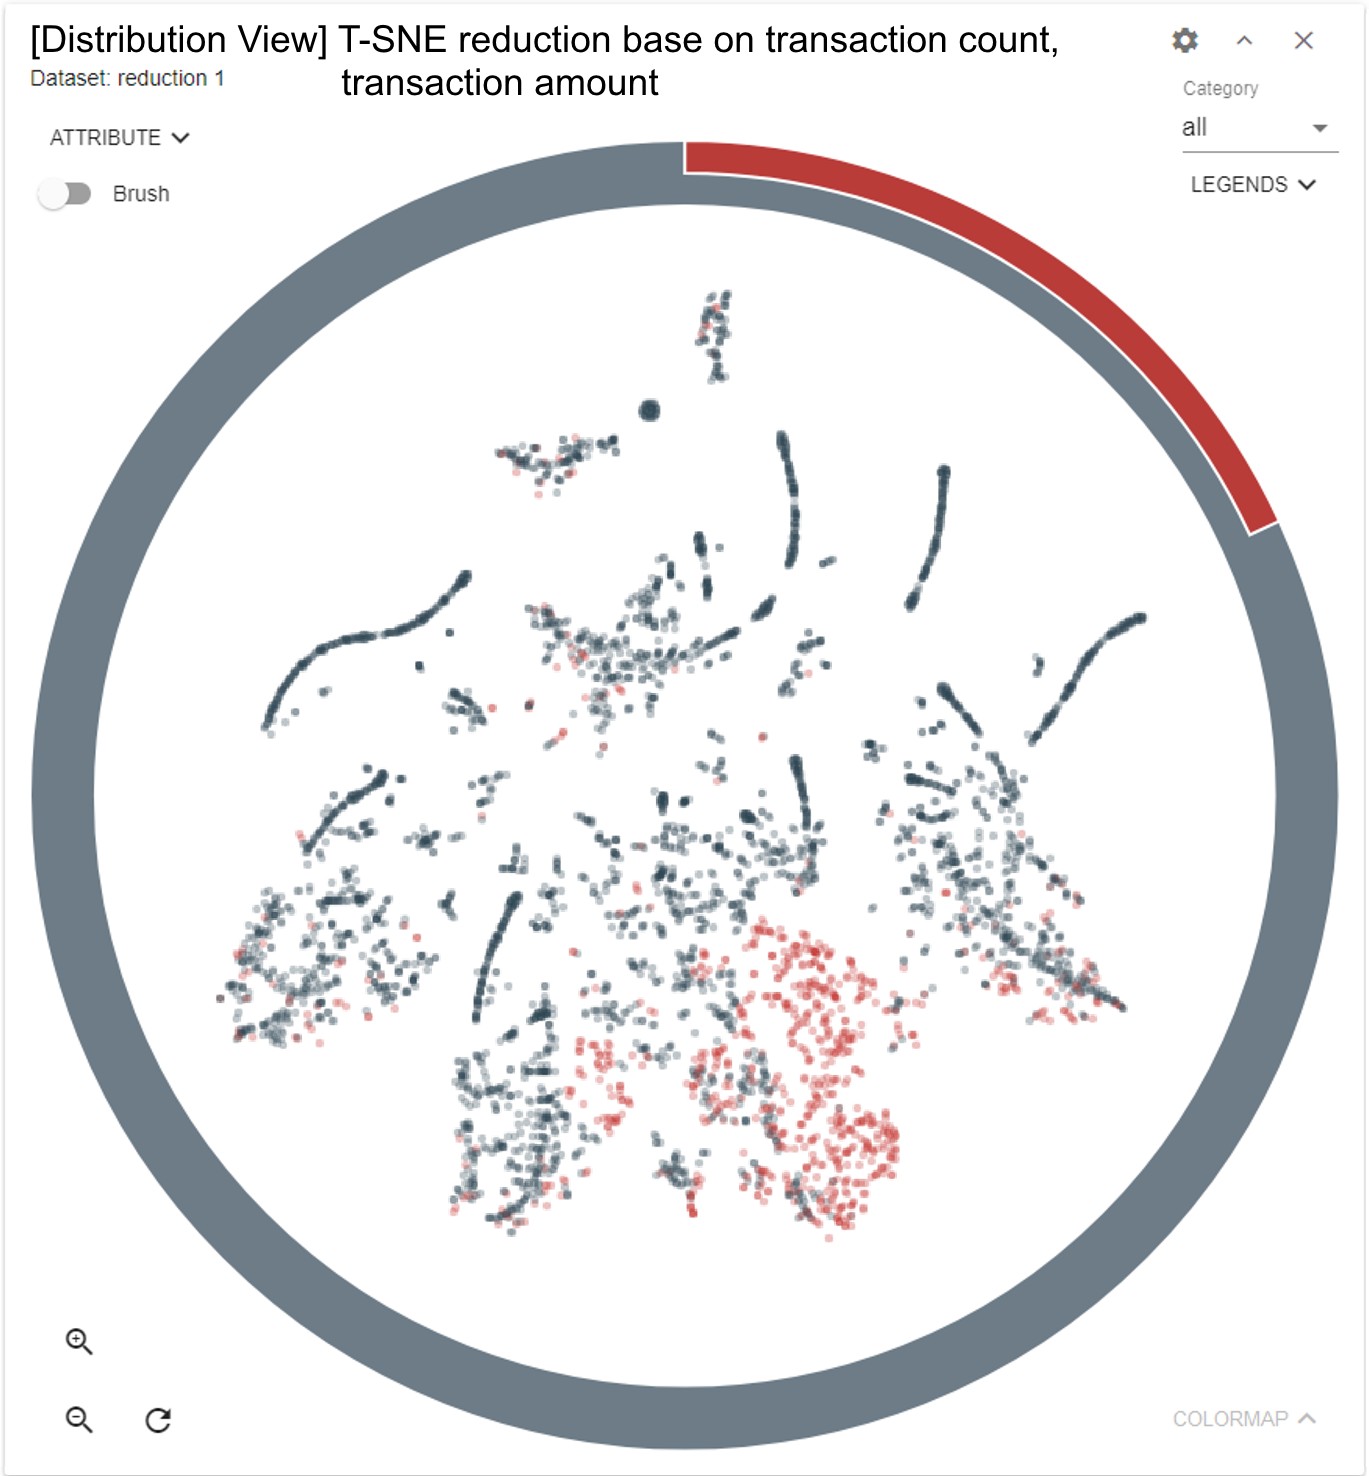
Distribution view consists of two components: scatter and ring.
We
display the reduced-dimensional data in 2D space, considering that 2D scatter
view remains a highly comprehensible way of displaying distribution on a flat
screen [14]. Given the intuitiveness of scattered distribution, we design the
interaction of the distribution view as a map; analysts can drag and zoom in
and out the map. Analysts can brush points on the view and select these points.
The color of the data points can be adjusted as well. Analysts decide the
dimension of the color map. Then the system will compute quantiles of the
values, map each data point to a group, and color data points with
corresponding colors. Figure 2 demonstrates an example of coloring data points.
Toggling the right bottom window shows the percentage and value range represented
by each color. The quantile groups shown in the window can also be clicked and
selected to highlight the consumers in that group.
A ring
is added to surround the scattered distribution as a metaphor for a magnifying
lens on the map. The ring is designed to demonstrate categorical quantitative
information of the data points on the distribution view. We choose ring-like
visualization because it is useful in the examination of multivariate data [14].
The
ring has no arc and shows 100% of the data in the view by default. The ring is
separated by a number of arcs that display the proportion of the count of data
records of specific attributes in raw data with a chosen dimension. An example
is shown in Figure 2. Attribute “Gender” is chosen as the observation target,
and male consumers, representing the cyan arc in the figure, account for
one-fourth in this dataset. We design the outer ring as the quantitative
information of selected data for the thickness of the ring in distribution
view. The ring will show the proportion of the count of correlated selected
data after selecting data records in other views or brushing data points in
distribution view, as shown in Figure 2. The length of the arcs and the outer
arcs also change by interacting with the scattered distribution, as well as by
dragging or zooming in the scattered data records displayed in the range of
ring changes.
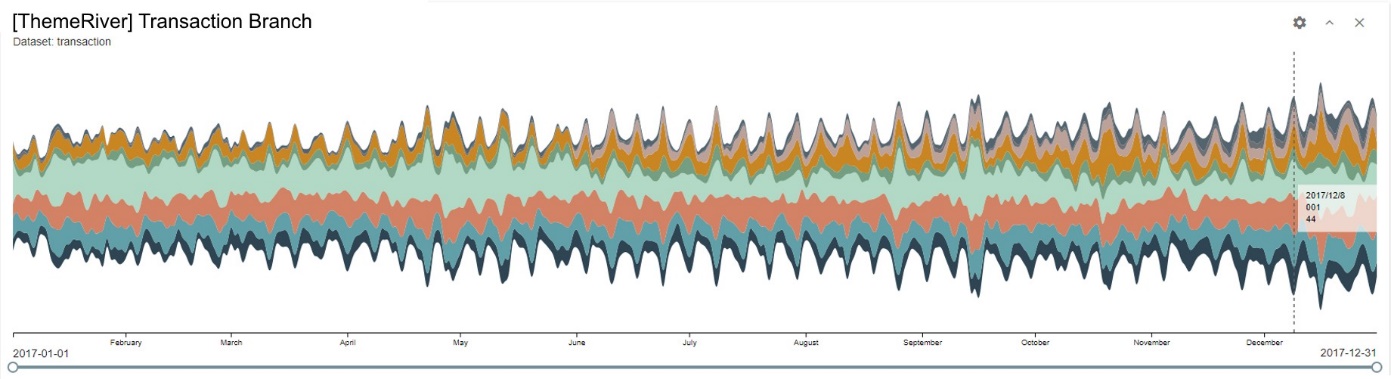
The design of our system should
suit what analysts are familiar with, so we provide some basic charts that
analysts can choose to add to the interface, such as bars. To visualize
temporal data through time series, our system also provides ThemeRiver. Other
types of charts can be easily added to our system. Charts are dynamically and
manually added to avoid cluttering caused by multiple views and fit the needs
of various analysis. Analysts can choose the data attributes they are
interested in and create a relevant chart.
Given that dimensional reduction
data may not be able to display all the dimensions that analysts are curious
about, coordinate multiple view is applied to satisfy the needs of displaying
multivariate data and show their correlation by interaction [7]. Brushing and
linking [6], as well as focus+context visualization [2], are embedded in the
views to support clear visual cognition and intuitive interaction. In addition,
our system provides a filtering function to archive current selected data and
all its correlated records from other datasets to help analysts focus on the
exploration within the part of the data they are interested in.
Our system implements a method
of correlation hinting which can automatically provide some hints to help
analyst find interesting phenomena. When exploring transaction data,
observations of the similarity and dissimilarity of customers is crucial.
Finding similar shopping patterns among different customer clusters helps
formulate sale strategies. Hence, the concept of correlation hinting means
using other charts to map highly correlated consumers. The method is simply
designed to find highly overlapping subsets of consumers by grouped subsets in
other charts. We implement this function by using bar charts in our system. The
method can be easily extended to other charts. Analysts may gain insight into
the relationship between hinted groups and their correspondent consumers by
comparing the hinted groups and the correlated consumers mapped in the distribution
view.
We
implement two scenarios for the correlation hinting method based on whether
analysts have selected several data records. In the case where data are
selected, analysts may select a cluster from distribution view and are eager to
know “Can this cluster be interpreted by any real-world attribute of interest?”
Therefore, we compare the correlated consumer set of selected data and every
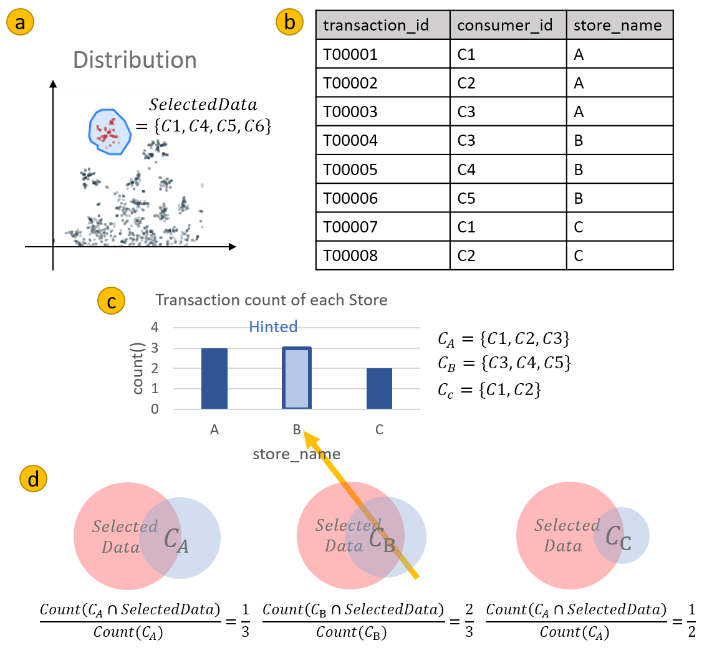
group in the bar chart and hint the group with the highest ratio. An example
computation of correlation linking from a bar chart representing the
transaction count of each store is illustrated in Figure 3. If analysts are
interested in the hinted bar, then they may select the bar itself to observe
the distribution of the selected result and compare the bar with the visual
representation of original selected data to find out where the intersected
consumers are scattered on the distribution view.
Figure 3. Example of
correlation linking method. (a) An analyst selects a cluster he or she is
interested in. (b) The raw data of the selected cluster. (c) The cumulative
transactions for each store. (d) For each bar, we compute the intersection of
selected data and bar set and then hit the bar with the highest overlap ratio.
The result of correlation linking implies that the selected consumers trade the
most in Store B among the three stores.
In cases without selected data,
we compare every two groups in the bar chart and hint the pair with the highest
ratio of overlapped correlated consumer sets, which indicates the high
likelihood that these groups share the same clusters in distribution view.
Analysts may interact with the hinted bars separately to verify their
assumption or observe the distribution difference among different groups of
correlated consumer sets. The system is able to guide analysts to try out some
interactions that may lead to interesting findings via this automatic
correlation hinting function.
We use
a dataset of customer transactions from our collaborating department store in
Taiwan. For privacy and proprietary reasons, private identities have all been
encoded. Thus, the phenomenon and data distribution we demonstrate in case
studies ate true, whereas the data values are resampled. Our dataset contains
the following attributes:
·
Consumer
information
includes the IDs and other information about the consumer who make the
transaction, e.g., gender, zip code, and membership level. Note that only the
transactions of the members of the department store are recorded.
·
Store
information
contains the IDs and categories of the stores, as well as the branches that the
stores belong to. A branch is a large shop containing several different stores,
each of which sells different things.
·
Transaction
information
stores the time stamps, consumer and store IDs, and other information about
transactions, e.g., the payment amount, whether the consumer pre-orders, and
the number of points the consumer gains through this transaction.
We
implement our system as an integrated visualization solution for consumer
transaction data analysis. The system utilizes coordinated multiple views with
dimensional reduction techniques embedded for observing consumer
characteristics, as well as rich interaction, to help data exploration and
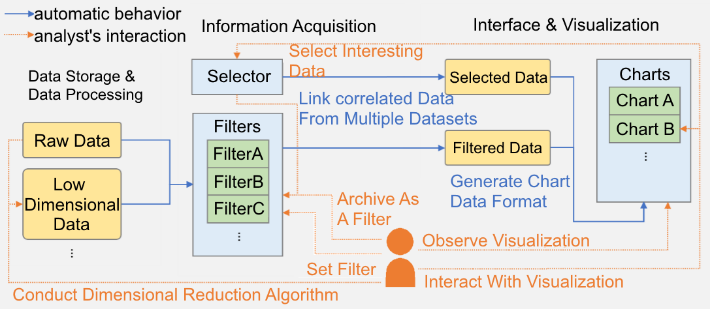
pattern finding. Three main components exist: data storage and processing,
information acquisition, and interface and visualization (Figure 4).
Figure 4. System architecture.
Data Storage and Processing.
This component stores raw data
and the configuration of dataset correlation. Analysts can also generate new
dimensional reduction data by choosing an algorithm and attributes from the user
interface.
Information Acquisition.
Our coordinated multiple-view
system employs selection interaction by brushing and linking techniques to
emphasize the correlation within data attributes of multiple datasets. When a
visual element is selected, all visual elements related to that record will be
synchronized and highlighted at the same time. We define these coordinated data
records as selected data. The relationship among visual elements can be direct
(e.g., different attributes of the same records from the same dataset) or
indirect (i.e., correlated data records from different dataset). The
relationship of datasets must be configured in advance. The analyst can archive
selected data to a filter to further provide the convenience to drill down the
data, and all the views will zoom into the subset of filtered data. Analyst may
toggle the filters in the list on or off to control what data should be
displayed, so that he or she can concentrate on the filtered data.
Interface and Visualization.
Interface and visualization is
the component responsible for user interface, display, and interactions.
Selected and filtered data are passed to each chart to be visualized. The
design of the interface and charts can be adjusted based on analyst's
preference. Selecting interactions is slightly different within each chart.
When an analyst brushes data points from any dataset on view, the brushed data
records pass, and the information acquisition component will then generate
selected data for this component to update every view.
Our
back-end data processing modules are written using Python 2.7 and scikit-learn.
Our server runs via flask. The front-end interface is a single-page web
application built by NodeJS. As to front-end framework, we choose ReactJS as
our system framework. We use material UI as our library for some of the common
components in our user interface, such as grids, tables, and selections. Below
are the reasons why ReactJS fits our visualization design and requirement:
·
Component-based.
Every part in the interface can
be divided into components. Given that our interface is designed as a
coordinated multiple view system with many different charts, splitting every
component apart provides flexibility so that developers can add, modify, or
design each chart independently. This flexibility also makes our system extendable
because adding any newly designed chart into our system is effortless.
·
One-way
Data Binding.
Data
management and real-time updating are also convenient by using ReactJS. Every
time an interaction is completed, information acquisition component needs to
generate updated selected data to synchronize all coordinated views and pass
the data as a state to update every chart. ReactJS will refresh every
coordinated visualization by using the updated data.
The
effectiveness of our system is validated in this section. We synthesize a
dataset, of which distributions are similar to those of the dataset provided by
our collaborating department store, because the data are private and
proprietary. The dataset consists of 73,924 transaction records of 4,912
consumer shopping in 10 branches and 1,097 stores. The goal of the analysis is
to observe the customers and seek hidden patterns. Please refer to our videos
to better understand the operation details of every case.
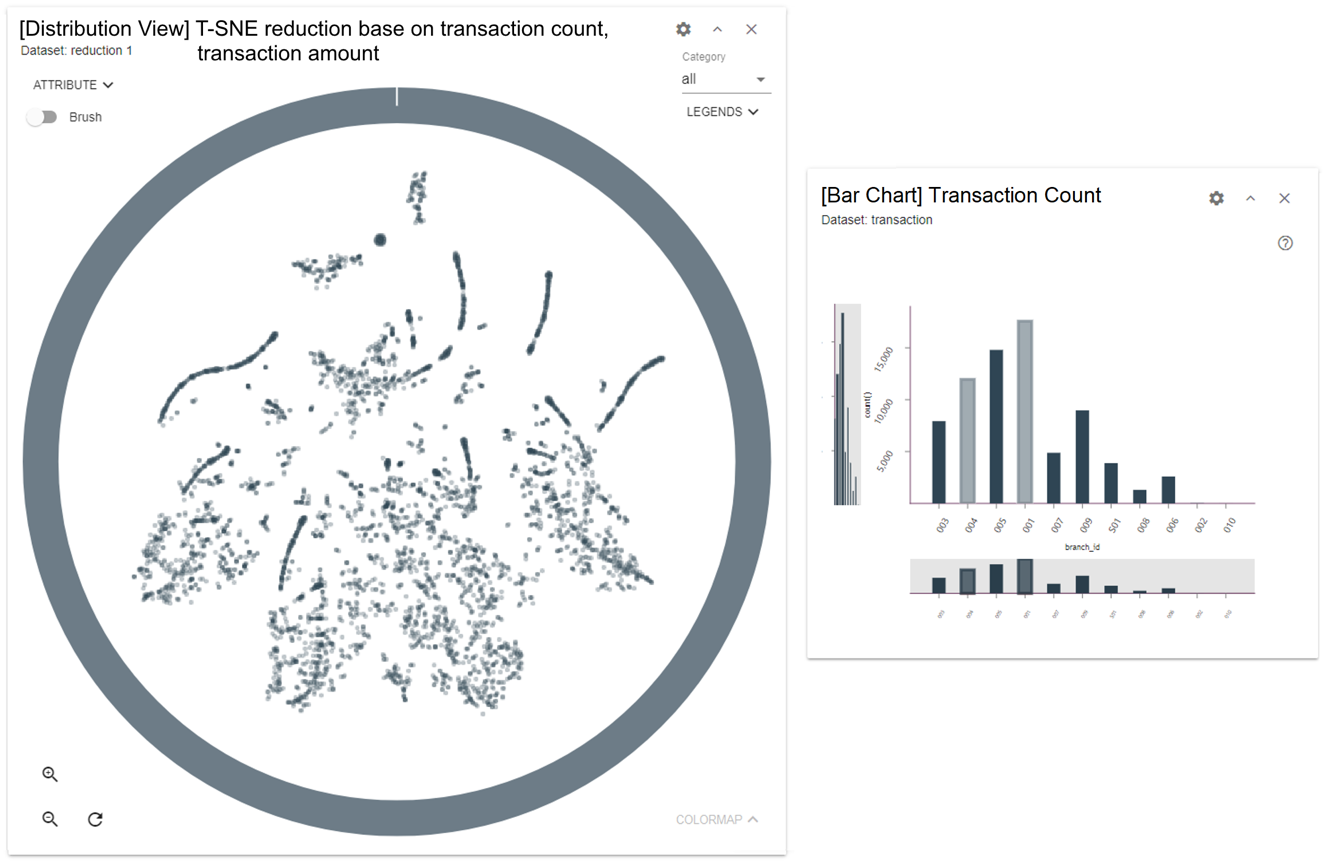
We
start our analysis with the consideration that consumer shopping patterns ought
to differ among various branches. We draw a distribution view that performs
dimensional reduction on the consumer transaction statistics of all branches,
including how many times a customer shopped (transaction count), as well as how
much he or she spent in total (total transaction amount) at each branch. As
Figure 5 shows, several clusters exist in the distribution view. Then, we add a
bar chart showing the transaction count grouped by every branch's ID to infer
the common behaviors of the clusters. As shown in Figure 5, we notice that
Branches
001
and
004
are hinted, which means that the consumer
sets of these two branches have a high ratio of overlapping. A total of 1,425
consumers are revealed to have shopped at both after opening the information
window.
Figure 5. (Left)
Distribution view of all consumers; (Right) Transaction count grouped by every
branch's ID.
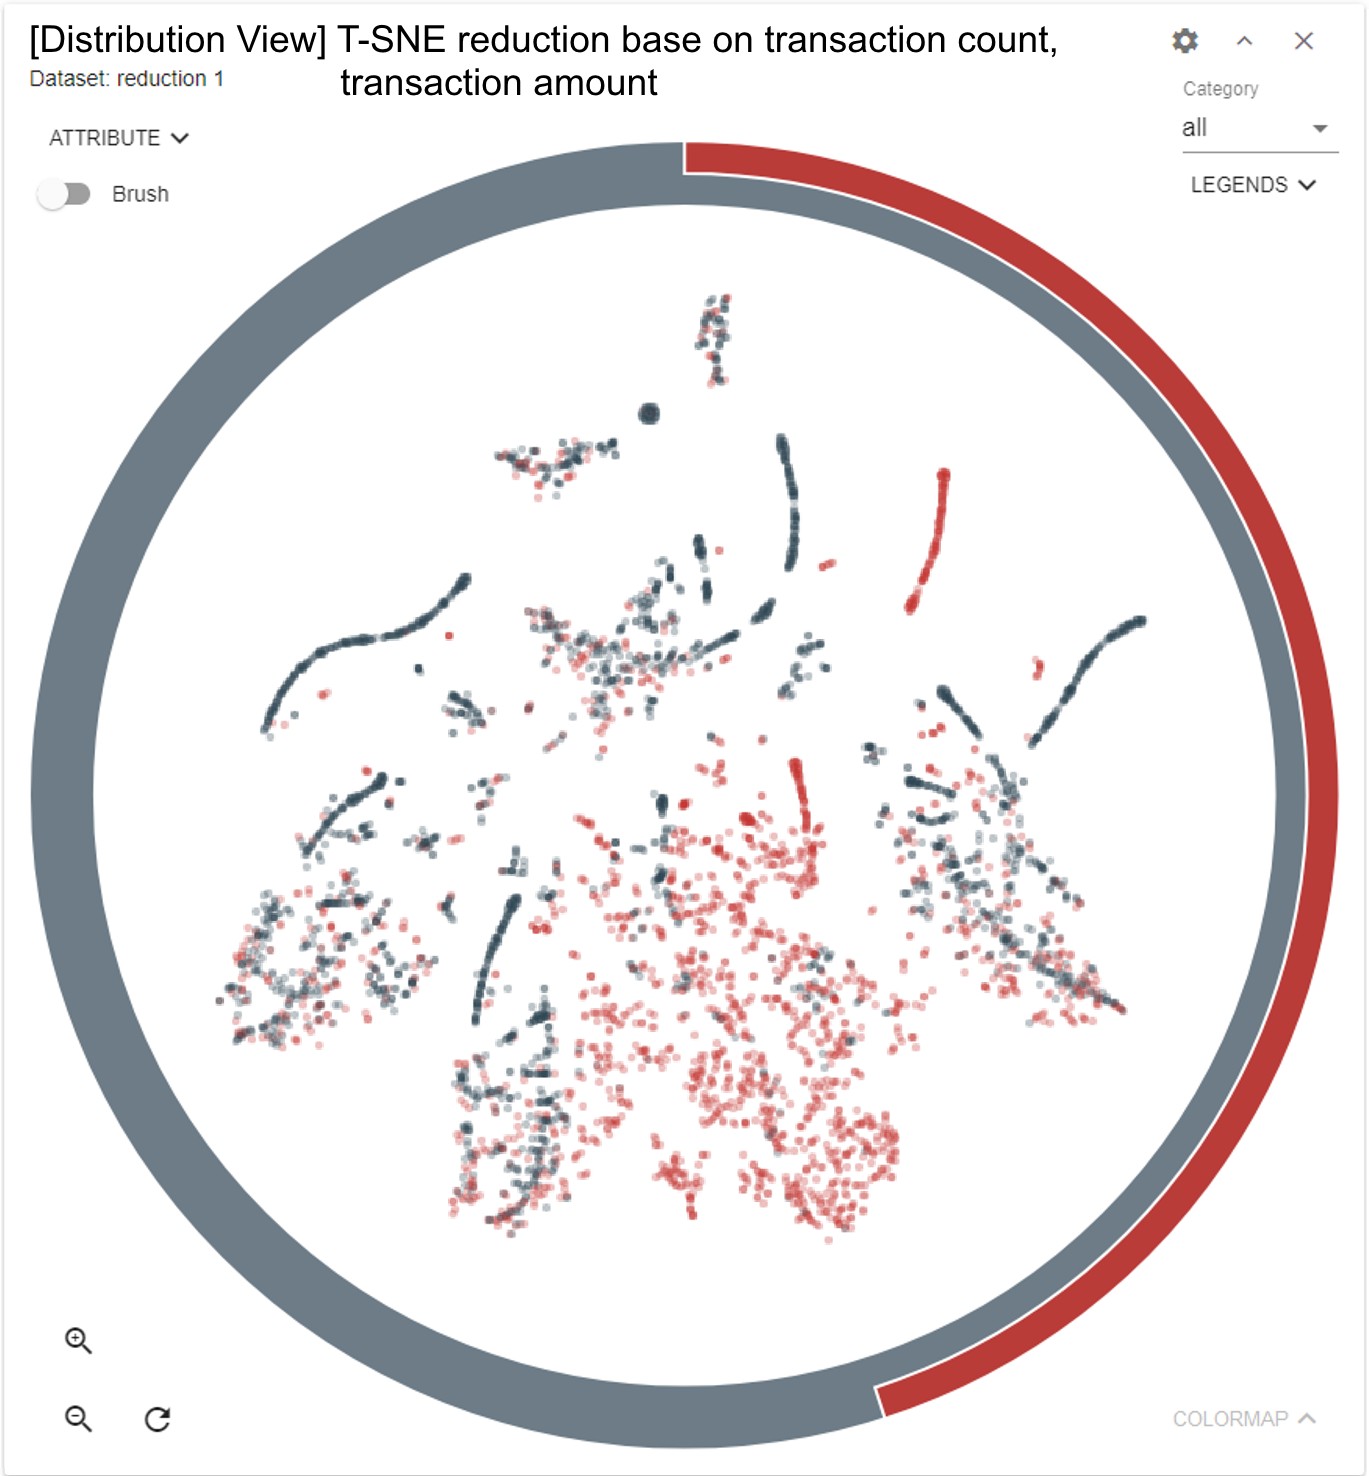
By
selecting the two highlighted bars in the bar chart, the bottom right cluster
of the data map is highlighted in red (Figures 6[a] and 6[b]). We then conclude
that the customers in this cluster tend to shop at
001
and
004.
When selecting bars of Branches
001
and
004, we find that the bar
of Branch
S01
is hinted with a thick border in both. Selecting the bar
of shopping transactions at Branch
S01, we observe the distribution of
consumers who have shopped at Branch
S01
is almost inside the cluster 6[d]).
The results indicate that the customers of Branch
S01
are a subset of
the customers of the cluster.
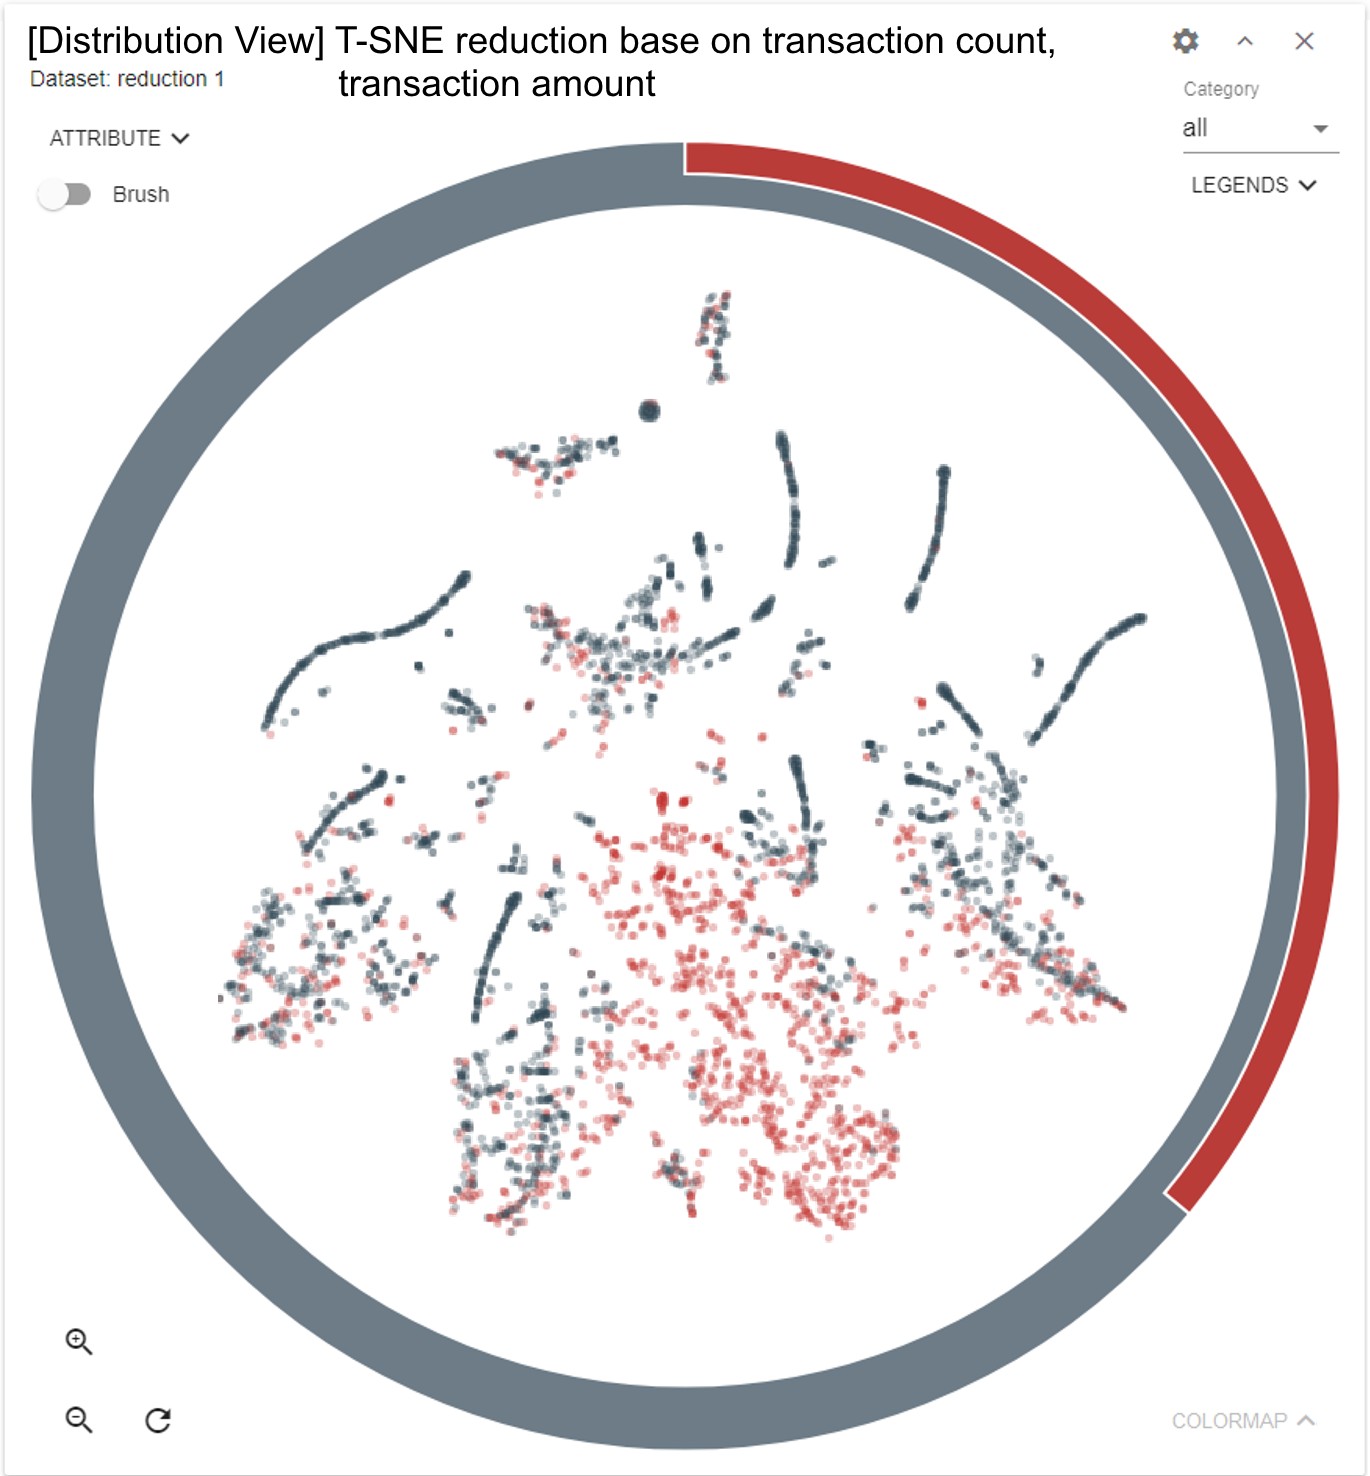
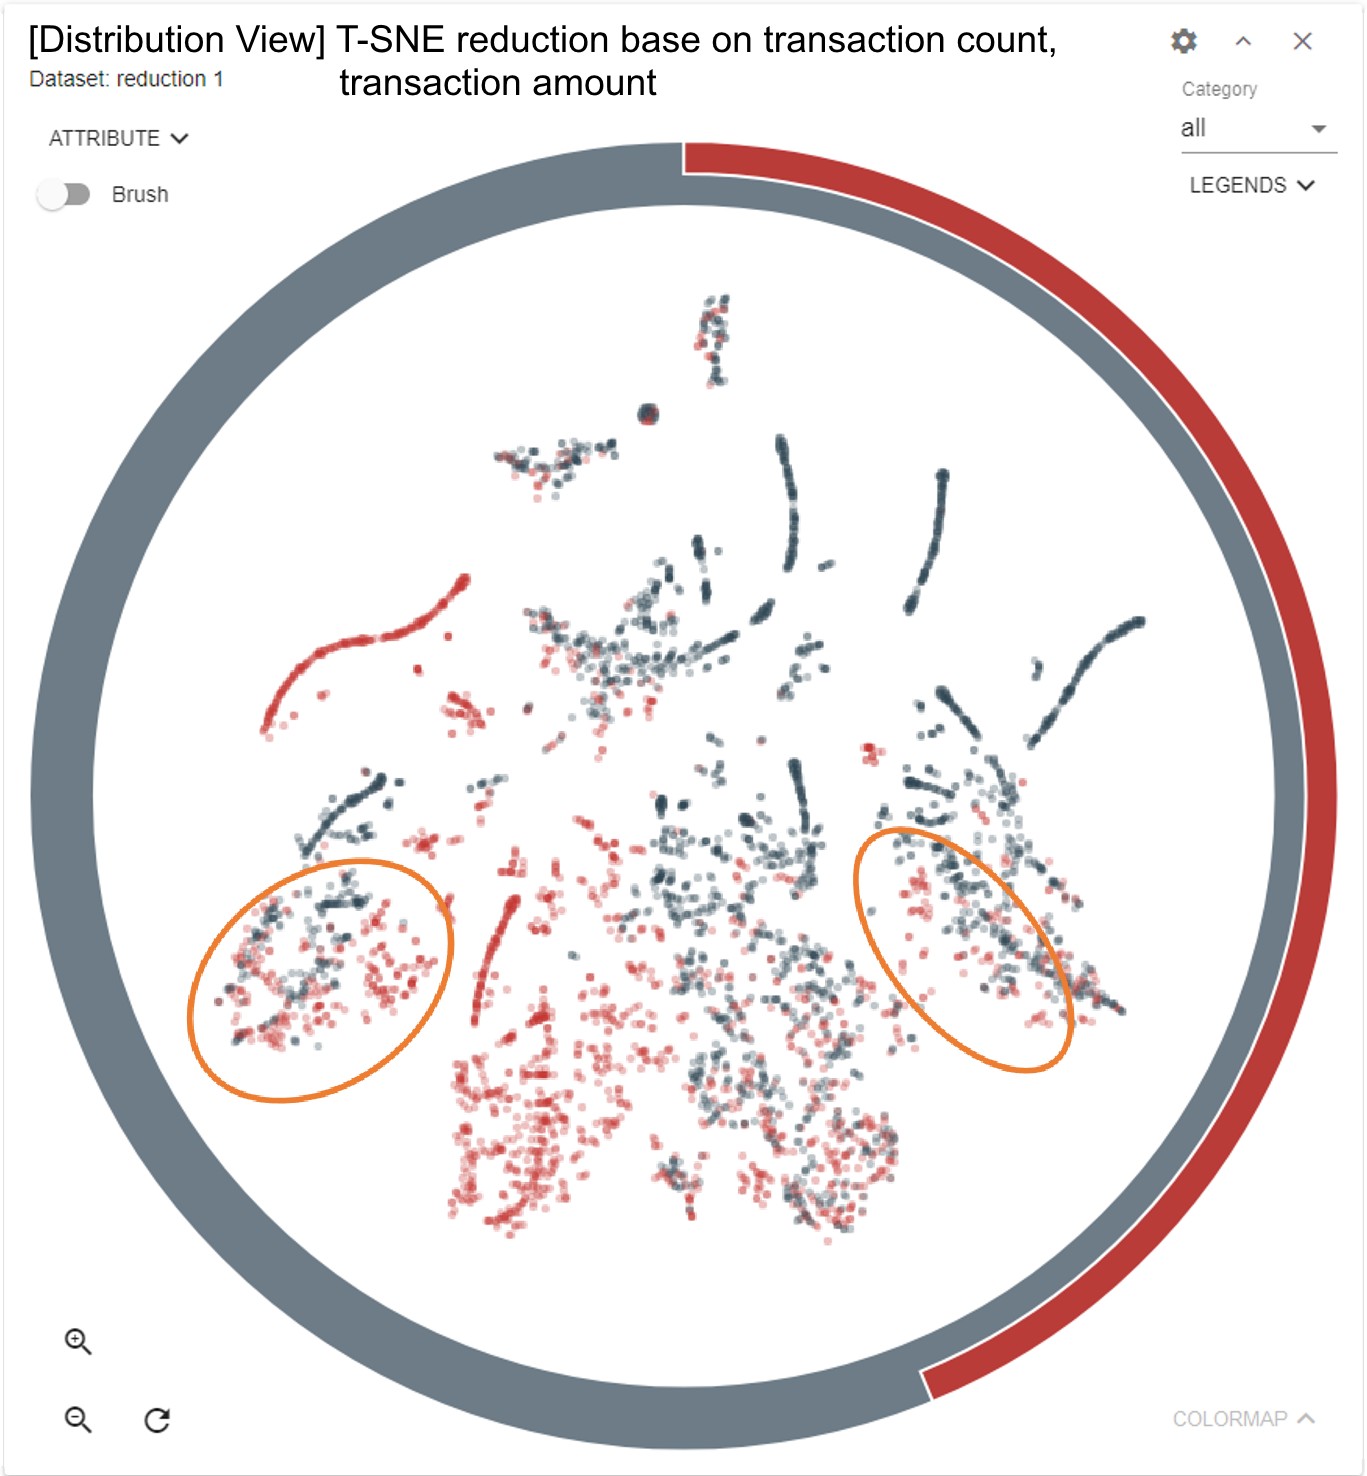
We also check how the
customers at other branches are distributed in the data map by clicking each
bar in the chart. Customers of other branches belong to clusters that are
highly separated. This finding means that most of the customers shop at a
specific branch, except those customers who shop at Branches
001,
004,
and
S01. When selecting the transactions of Branch
009
(Figure 6[c]),
its distribution has partially overlapped with the distributions of several
other branches. For instance, the right half parts of the clusters when
selecting the transactions of Branches
007
and
009
are similar. A
few highlighted data records in the right two clusters also exist, which
represents consumers with higher tendency to shop at
001
or
005.
This finding suggests that the consumers shopping at Branch
009
are more
likely to shop at multiple branches.
(a)
Branch
001
(b)
Branch
004
(c)
Branch
009
(d)
Branch
S01
Figure 6. Select transactions of branch
(a)
001, (b)
004, (c)
009, and (d)
S01.
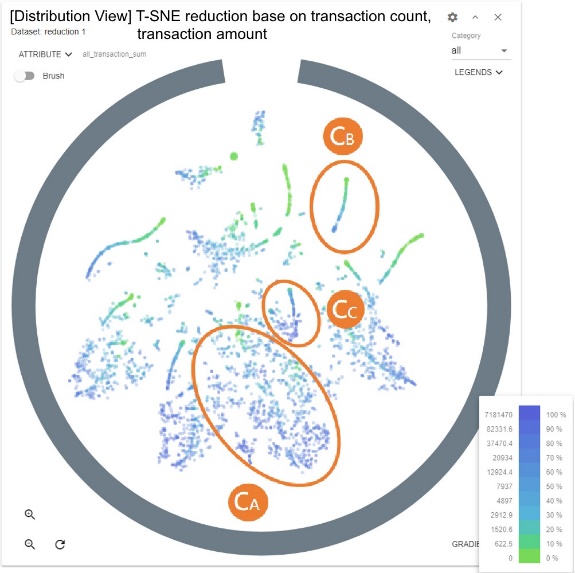
We examine the cluster mentioned
in Case 1, which represents customers who have shopped at Branches
001
and
004
to demonstrate how analysts can use our system to explore data
further. As shown in Figures 7(a) and 7(b), we define the biggest cluster of
intersected customers of Branches
001
and
004
as Cluster
CA,
and two clusters that are correlated with transactions of Branch 001 but not
004 as
CB
and
CC. To analyze the general
pattern of these clusters, we change the color map of distribution view such
that the consumer data points are colored based on how many times they shopped
(transaction count), as well as how much they spent in total (total transaction
amount) through the whole year (Figures 7[a] and 7[b]). The distribution view
shows that the customers in
CA
have a large number of total
transaction count and total transaction amount over the entire year. These
customers shopped more than 12 times in a year with a total transaction amount
more than TWD 10,000. By contrast, the consumers in
CC
have a
low transaction count (less than five times in a year), whereas the consumers
in
CB
only shopped once.
CB
has a large
variation in terms of transaction amount. The exact values of transaction count
and amount are illustrated by the color map in Figures 7(a) and 7(b),
respectively.
(a)
Colored by transaction count
(b)
Colored by transaction amount
Figure 7: Color maps and clusters
CA,
CB, and
CC.
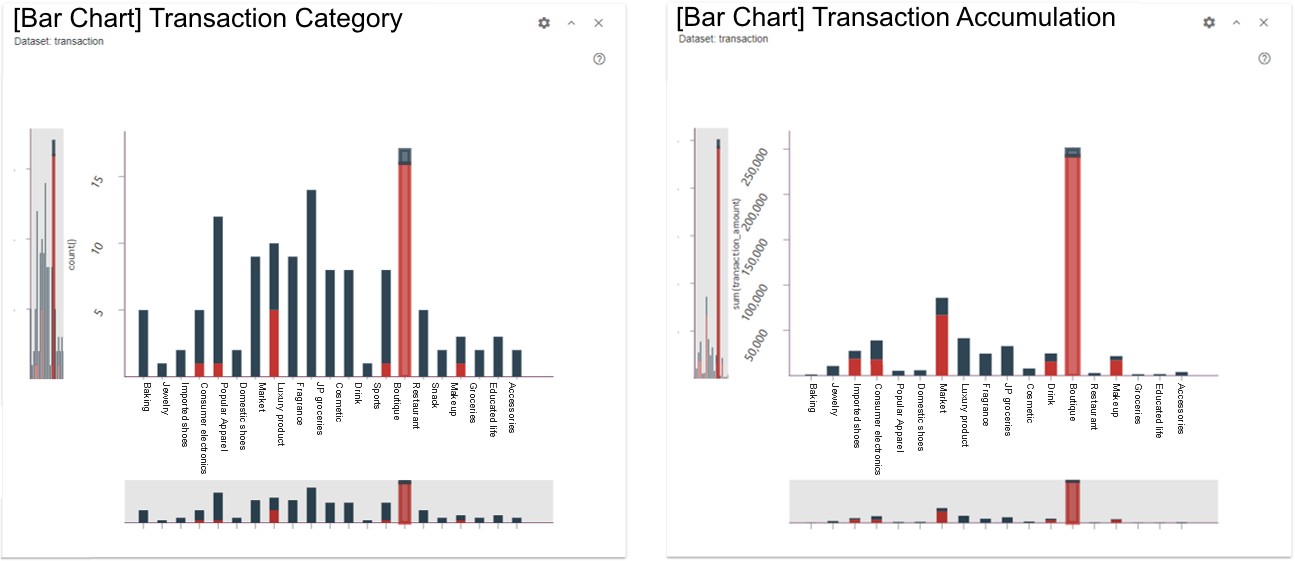
Examine
CB.
We
closely examine the transactions of these consumers by brushing and filtering
CB.
We then add a bar chart to analyze what kinds of products these consumers have
purchased. As shown in Figure 8, those consumers whose total transaction amount
in a year is from TWD 8,000 to TWD 20,000 buy at boutiques or luxury brands,
whereas those consumers whose transaction amount is between TWD 1,000 and TWD
5,000 buy shoes, fragrance, groceries, and skin care products. Although this
cluster represents those consumers who shopped only once or twice at Branch
001,
over 30% of the consumers purchased luxury goods.
Figure 8. In
CB,
selecting consumers spent TWD 8,00020,000. They tended to buy boutiques or
luxury brands.
Examine CC.
We brush and filter
CC
and change the color map to view the transaction count and amount of each
customer in
CC. By observing the distribution view, it shows
that those consumers who shopped the least (only one transaction in a year) in
this cluster surprisingly bought expensive products (more than TWD 50,000).
Being curious about the exact amount these consumers spent, we expand the
selected panel to check the raw data. The price of the products these consumers
bought ranged from TWD 29,800 to TWD 150,000. This finding reveals that these
consumers purchased more high-priced products than those in
CB.
Boutiques, luxury brands, jewelry, and watches form the majority of the
transaction categories.
Examine CA.
The findings in Figure 7 reveal
that
CA
is a cluster with regular customers of Branches
001
and
004. By filtering
CA
and adding a bar chart of
shopping categories, we find that most of the transactions were done at
restaurants and supermarkets, and the categories related to food also accounted
for a high percentage of the transactions. In particular, more transactions
about edible products exist compared with
CB
or
CC.
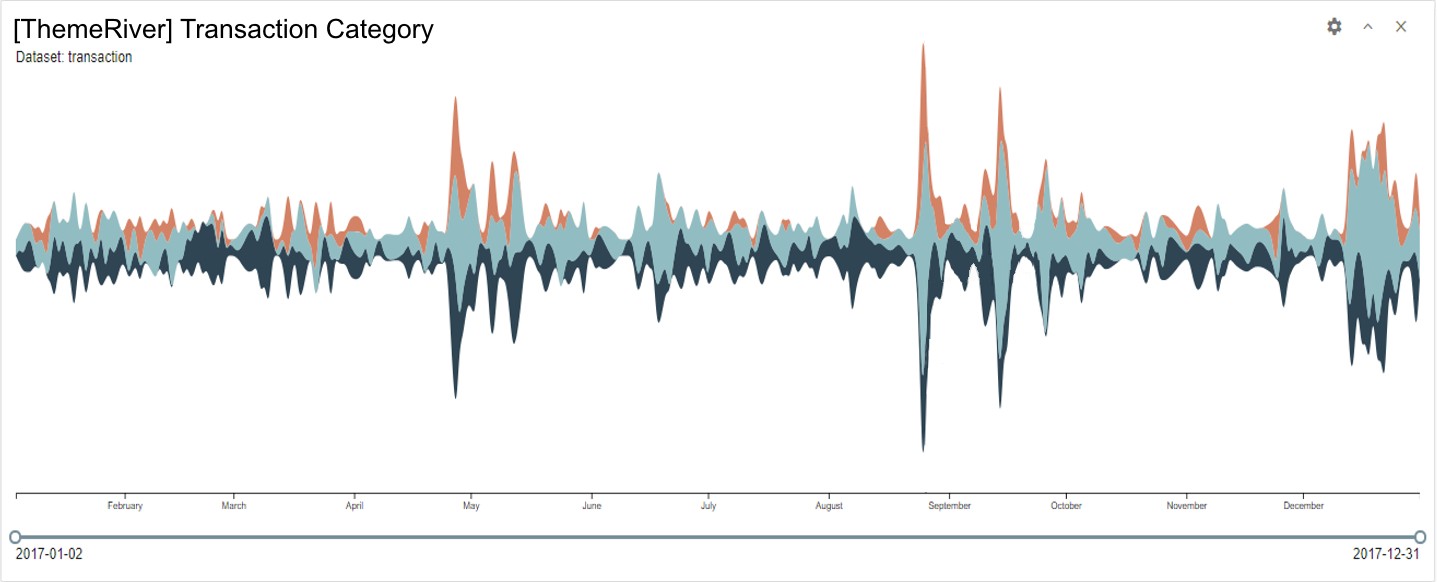
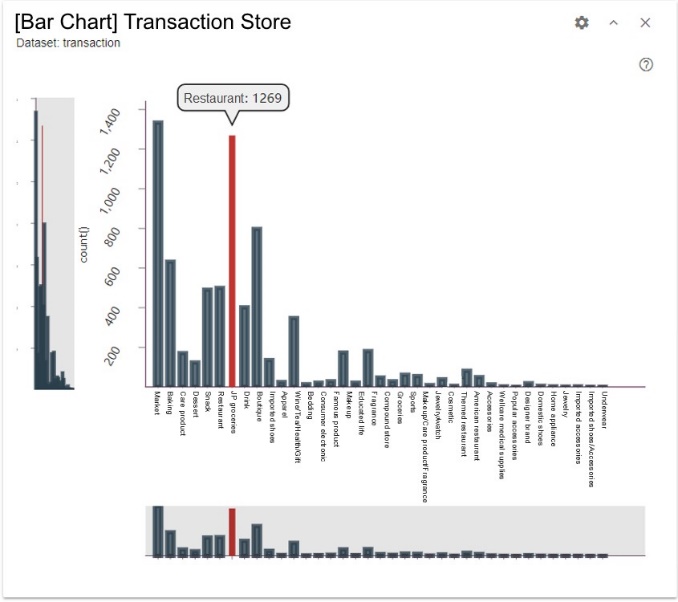
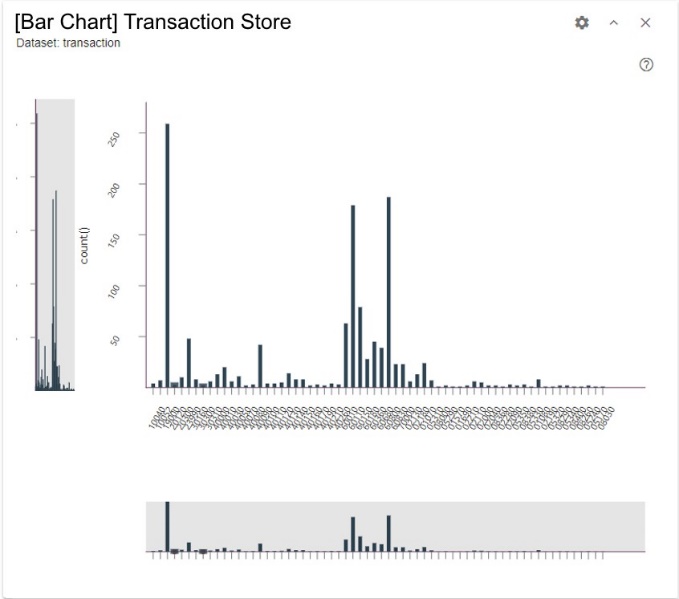
To observe the shopping behavior of the customers in
CA
who
have bought high-priced products, we select and filter the consumers who have
shopped in boutiques and for luxury brands, jewelry, and watches, the
high-priced products that are also bought with a high tendency in
CB
and
CC. Subsequently, we add a ThemeRiver to verify how and
when those transactions were done. As shown in Figure 9(a), although these
customers had bought these products numerous times, these transactions occur in
a specific period of a year, such as anniversary or Christmas sales.
To determine consistent shopping
behavior, we set the color map to observe the transaction count of these
consumers, the ones who have shopped in boutiques and for luxury brands,
jewelry, and watches in
CA. We filter the top 20% of
consumers with high transaction count, who shopped more than 54 times in a
year, and find a total of 69 customers. Checking the filtered data, we select
each bar in the bar chart and examine their distribution on the ring. We find
that almost all of these customers purchased a certain category of products,
such as meals, baked goods, and drinks. We then filter these transactions with
specific category and add a bar chart of the distribution of stores to check which
stores these customers prefer. By choosing the restaurant category, we find
that: (1) All 69 customers in this subset have dined in at least one
restaurant. (2) Figure 9(b) shows that these customers eat at some specific
stores with a pretty high rate within a group of restaurants.
(a)
(b)
(c)
Figure 9: Observation of consumers in
CA
who shopped for highpriced products. (a) ThemeRiver of transactions of
boutiques, luxury brands, jewelry, and watches. (b) Filtered data as regular
consumers in
CA
who shopped for highpriced products; select
transactions of restaurant. (c) Transactions grouped by store ID.
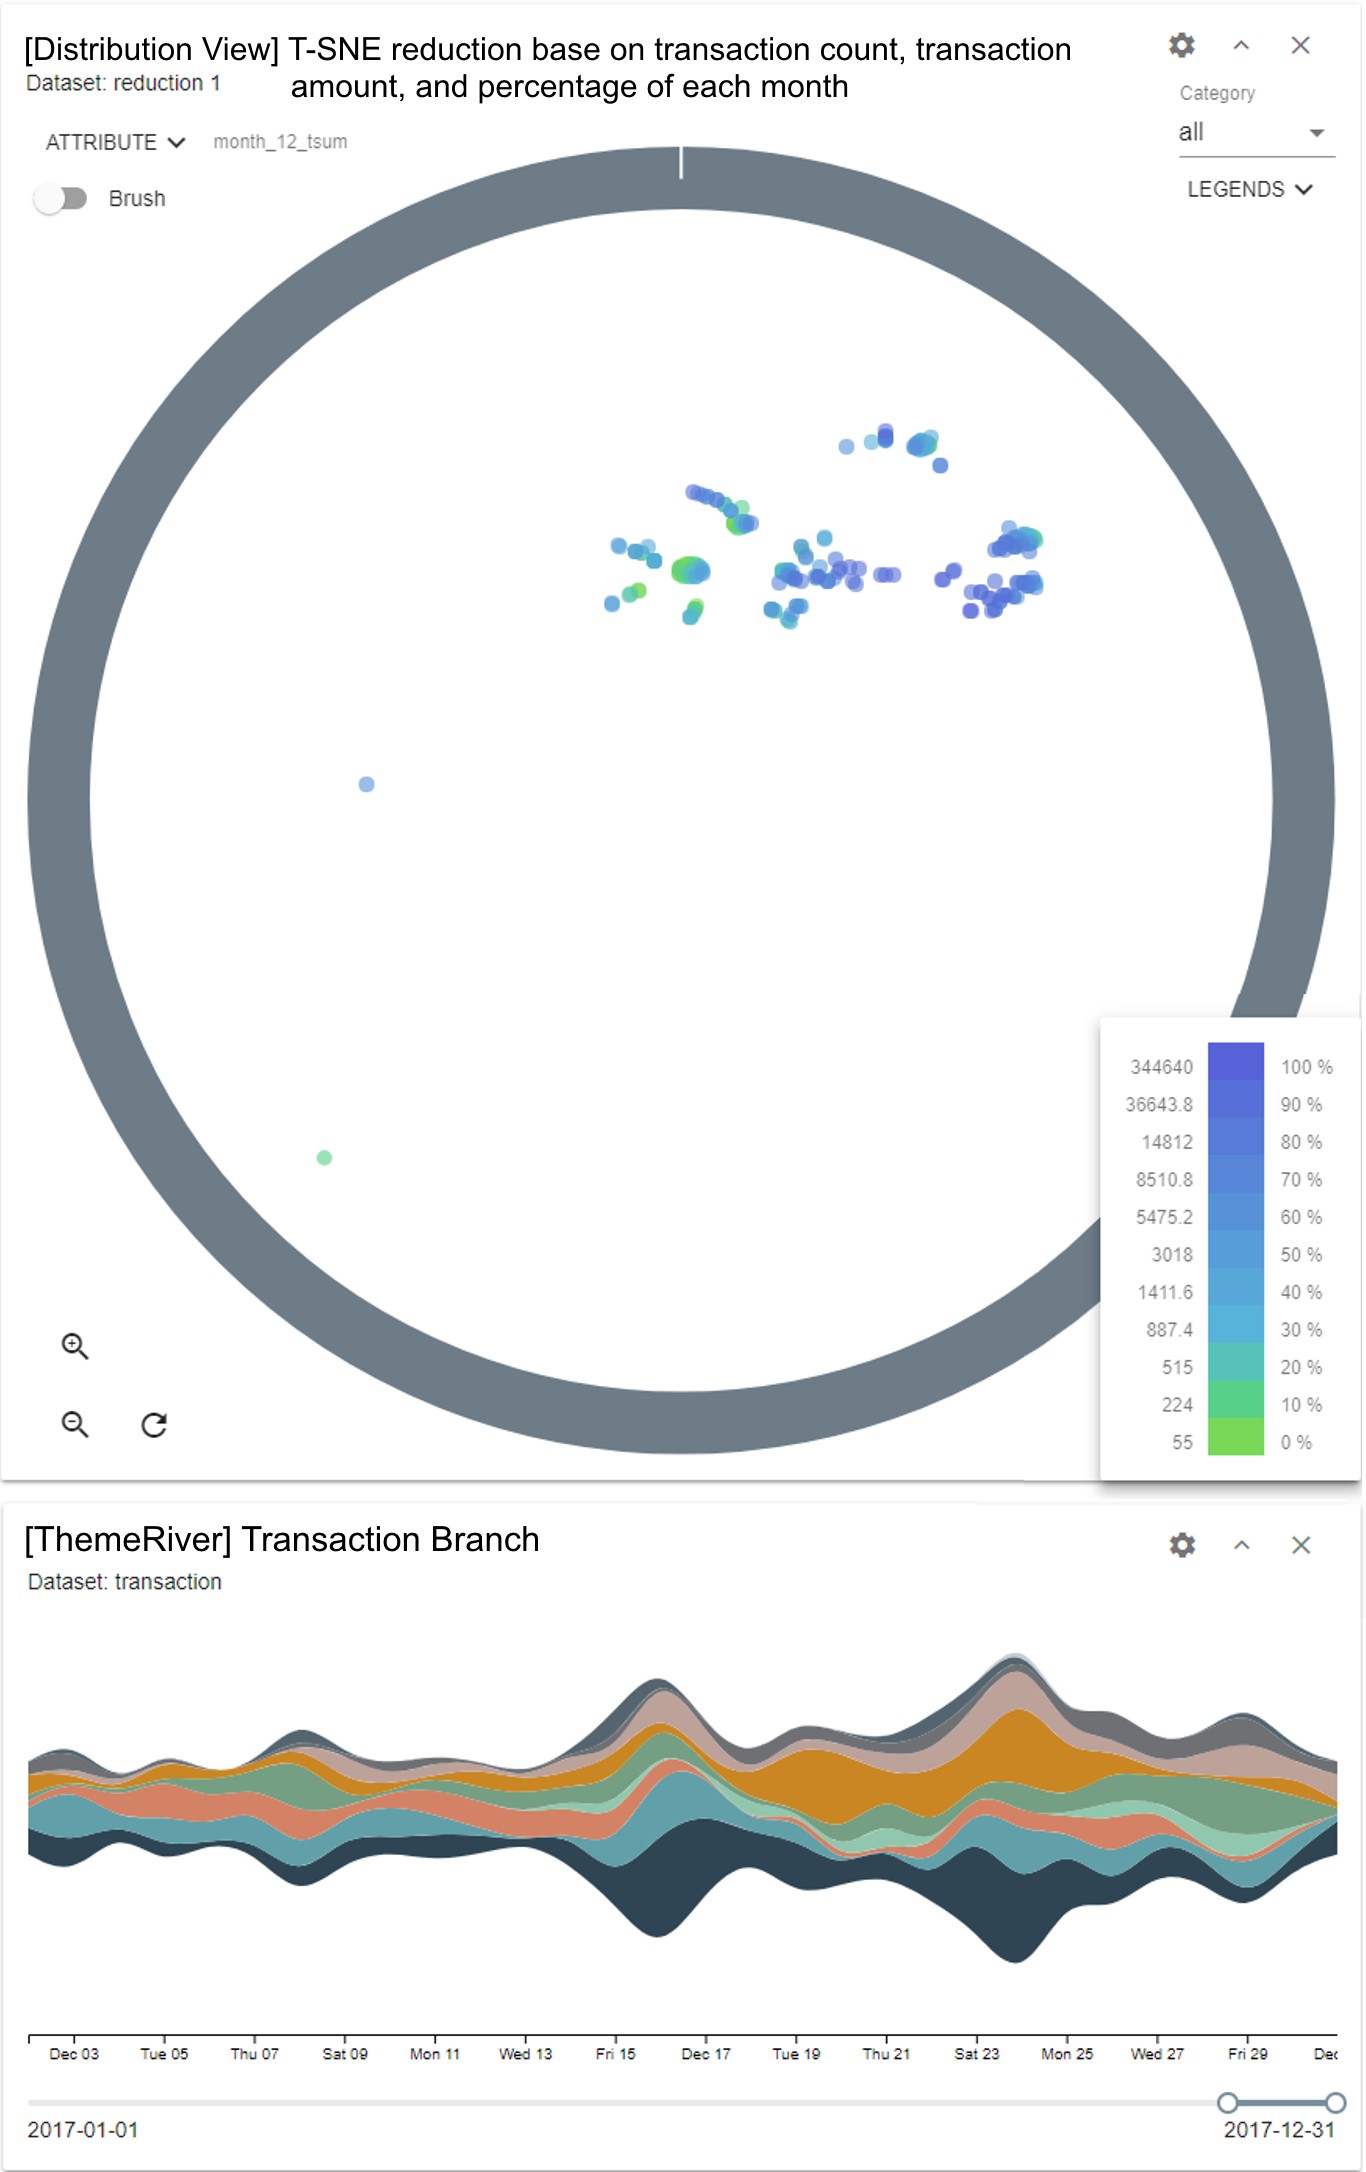
We
suppose that consumers that shopped at different time ranges have varied
preferences or characteristics. To verify our hypothesis, we conduct
dimensional reduction algorithm with consumer attributes, such as total amount
of transactions, transaction count of each branch, and the shopping percentage
of each month. We then demonstrate that our system can assist analysts in
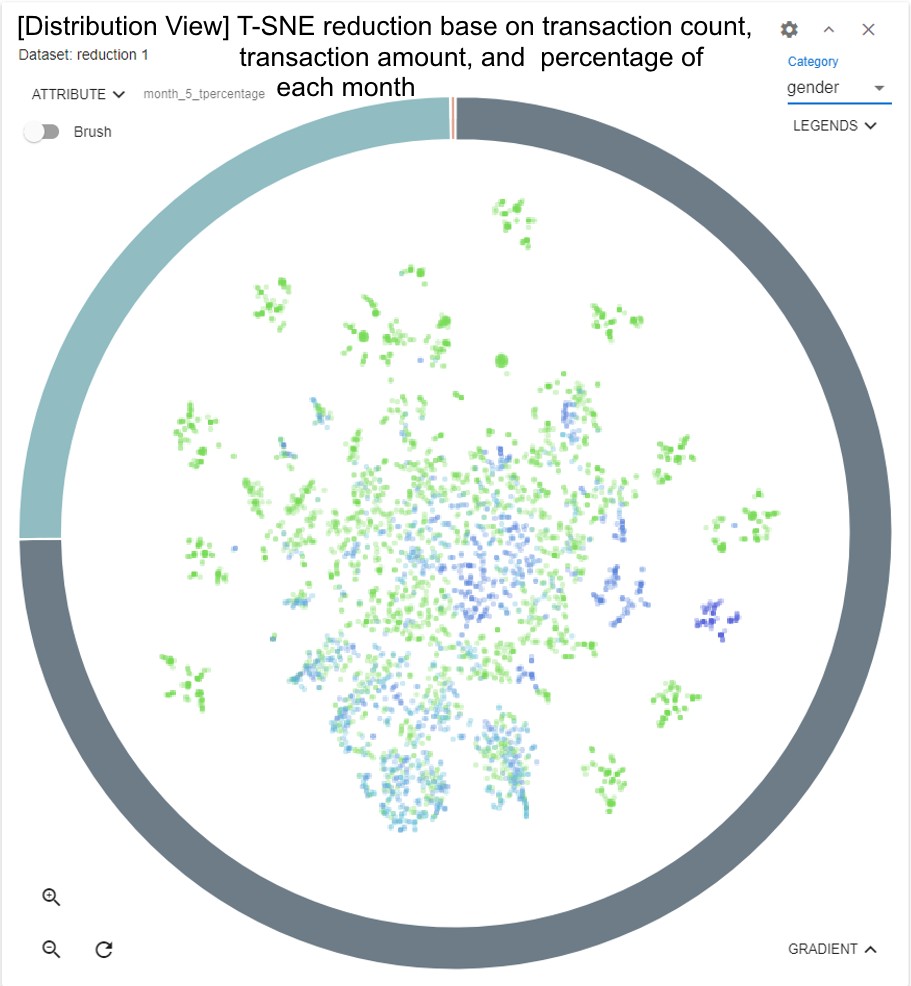
understanding consumer behavior during different time periods. We set the
colormap as the shopping percentage from January to December to observe the
distribution on data map. As presented in Figure 10(a), consumers at the small
clusters allocated at the periphery are those with the highest shopping
percentage for each month. The clusters of 100% usually result from consumers
shopping once or twice.
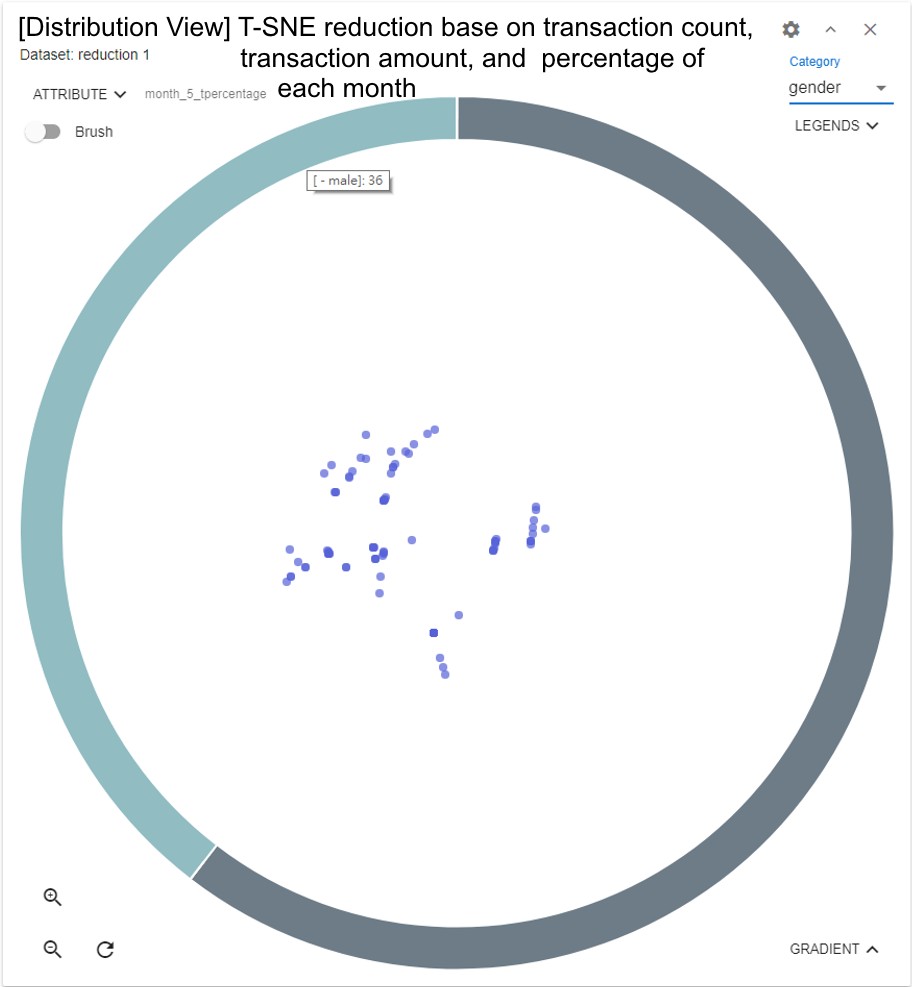
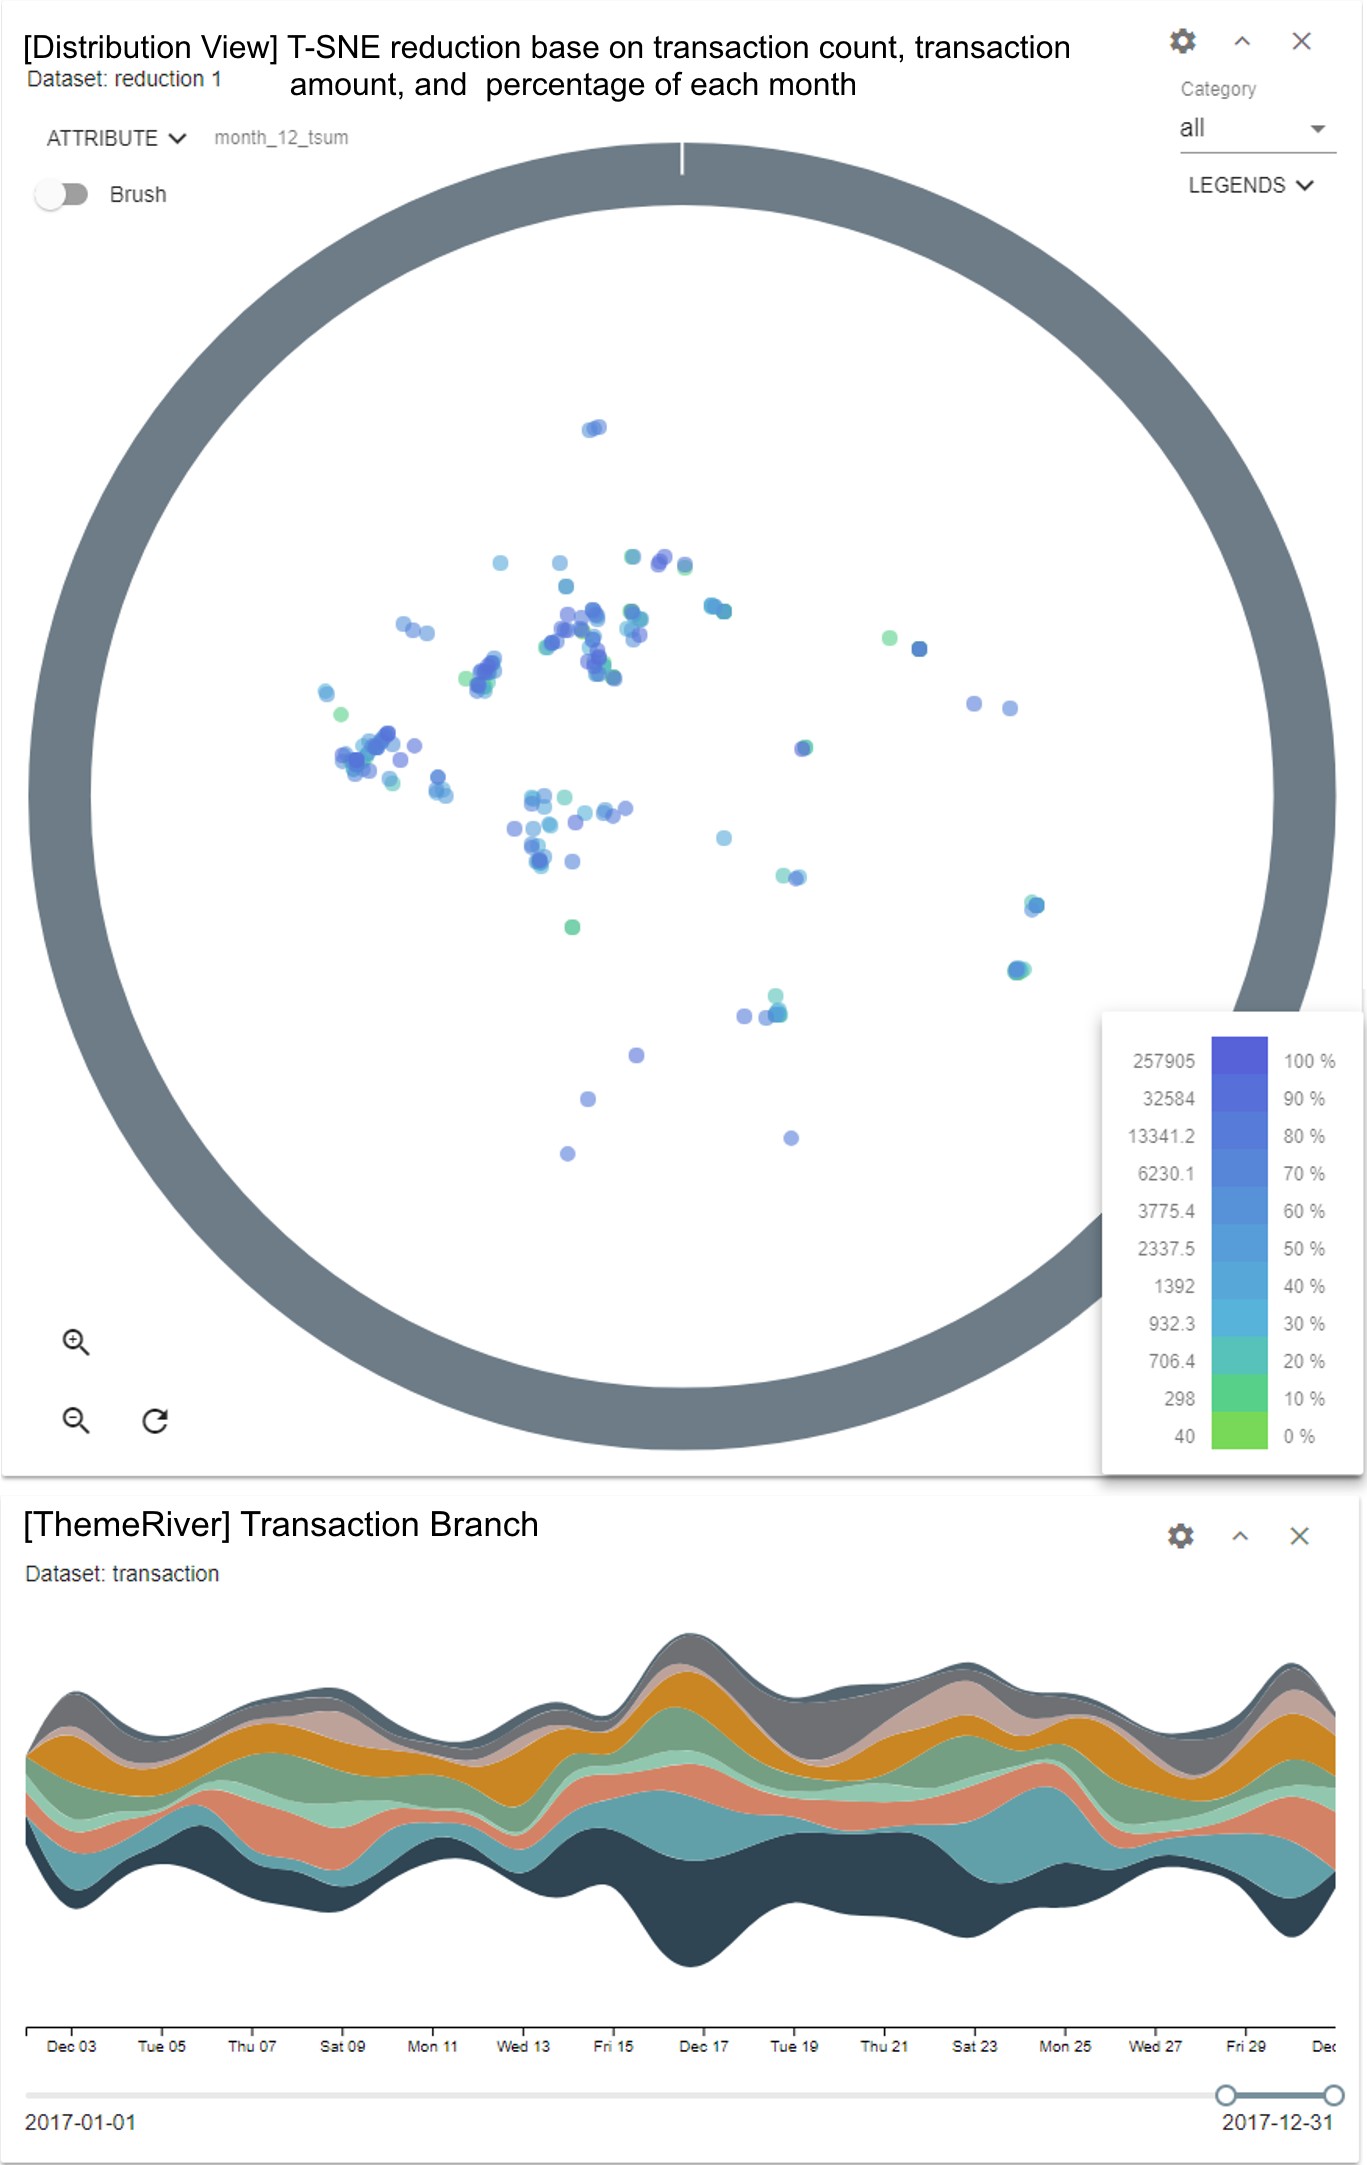
Figure 10(a) shows the shopping
percentage in May. By dragging the data map to the outer cluster, all colored
purple, the ring shows that this cluster has a high percentage of male
customers (Figure 10[b]), which is about 1/3. Customers who only shopped in
August also have the same sex ratio. Given that almost all the other clusters
maintain a stable sex ratio of 1/4, we speculate that this percentage might be
due to the celebration of Mother’s or Father’s Day.
(a) Shopping percentage of May
(b) The consumers who only shopped in May
Figure 10. Dimensional view colored by
shopping percentage of different months.
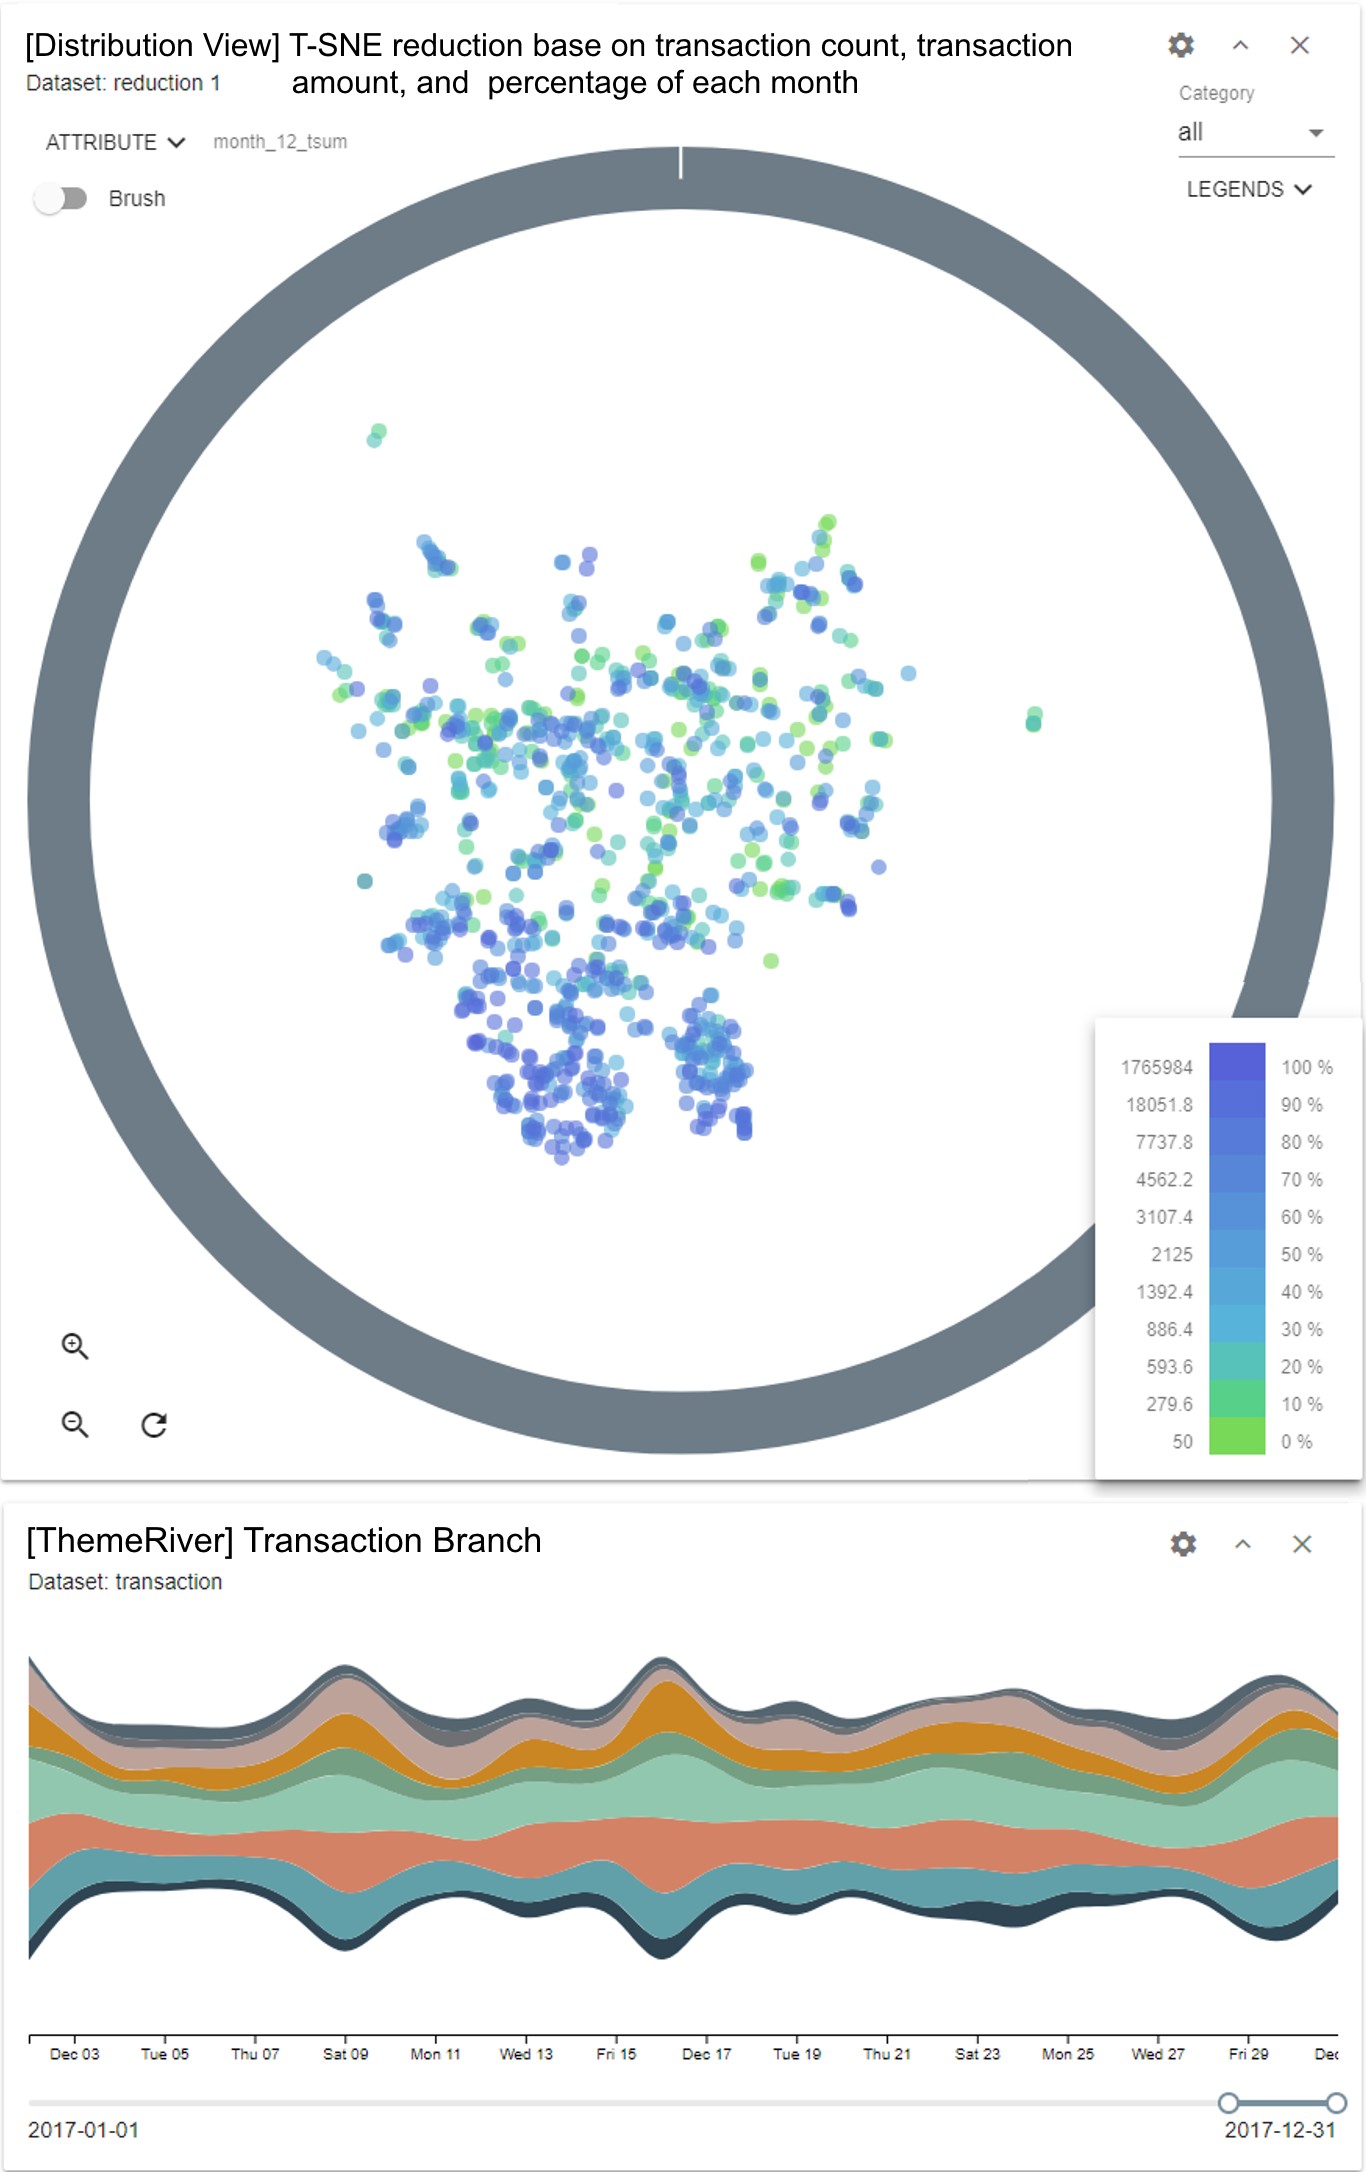
We add
a ThemeRiver chart to check the transaction count of each branch in a year and
determine if any other special temporal behavior exists. As Figure 11(a) shows,
the total amount of transactions made in December is slightly higher than that
in any other month. Therefore, we observe the ones who have shopped in December
and split these customers into three groups based on their shopping percentage.
We define the ones who only shopped in December as
FA, the
ones who shopped more than 40% of his or her transactions in December as
FB,
and the ones who shopped in December but not more than 40% as
FC.
The
data map and ThemeRiver chart that illustrates transaction count in each branch
of these three datasets are displayed in Figures 11(b)(d). The colored data map
and ThemeRiver chart clearly show that the shopping behavior differs among
these datasets. Focusing on the transactions in December, the consumers of
FA
shopped more in the last two weekends, whereas the customers of
FB
liked to shop in the third week (Figures 11[b] and 11[c]). The preference of
branches also differs. The category of the stream and its aggregated value of the
time period (day or hour) is shown by hovering the cursor over the colored
stream of interest. As presented in Figure 11(b), for consumers in
FA,
the yellow stream representing Branch 001 has a boost of transaction count in
the third week of December. Another branch with obvious boost is the dark blue
stream, representing Branch 009. Compared with the rest of the month, the
transaction count increases dramatically in the second and third weekend.
Regarding
FB, the gray stream representing Branch
006,
the transaction count shows a slight improvement in the third week, which is a
phenomenon that is not shown in the other two groups. However, the shopping
behavior of
FC
is almost similar to that in other months
(Figure 11[d]). Moreover, these consumers shopping records decreased in the
third week of December, which is inconsistent with
FA
and
FB.
(a)
Themeriver of count of transaction of
each branch
(b)
FA
(b)
FB
(b)
FC
Figure 11. Trends from different groups of
consumers.
In
this study, we introduce a visualization system for exploring the shopping
behavior of consumer clusters. We design our system with interactive visual
analysis features, such as coordinated multiple views and brushing and linking
to facilitate the data exploration process of gaining knowledge from consumers’
transaction records. Our system also presents the distribution view, a view
displaying dimensional reduction data of consumers, to provide analysts with
different viewpoints to observe the relationship of consumers and their
shopping behaviors. Analysts can observe the correlation among the attributes
and drill down the data with the combination of interactions, visualization
views provided in distribution view, and correlation linking method. We
evaluate the effectiveness and usability of our system using data from a
department store chain in Taiwan. The findings from the used cases demonstrate
the system’s capability of analyzing realworld highdimensional data.
Among
the many topics to be explored in future research, some important ones can be
listed as follows. First, Although we implement dimensional reduction algorithm
to show the visual abstraction of high dimensional data on distribution view,
we did not consider the user scenario and the interactions of other
domainspecific data. The specific features of consumer transaction data have
not been highlighted in this study. Second, the correlation linking method we
proposed has only been used in a bar chart. Given that the concept of hinting
the groups with high ratios of intersection is general and intuitive, this
concept may be expanded to other kinds of visualization used to display grouped
data. More choices might exist to link correlation other than the interaction
of subsets. Moreover, the linking methodology should be verified by a rigorous
evaluation to prove its effectiveness.
1.
Brodbeck, D.
& Girardin, L. Visualization of largescale customer satisfaction surveys
using a parallel coordinate tree in IEEE Symposium on Information Visualization
2003 (IEEE Cat. No. 03TH8714) (2003), 197–201.
2.
Novotny, M.
& Hauser, H. Outlierpreserving focus+ context visualization in parallel
coordinates. IEEE Transactions on Visualization and Computer Graphics 12,
893–900 (2006).
3.
Chang, R. et
al. Wirevis: Visualization of categorical, timevarying data from financial
transactions in IEEE Symposium on Visual Analytics Science and Technology
(VAST) (2007), 155–162.
4.
Keim, D. A.,
Hao, M. C., Dayal, U. & Lyons, M. Valuecell bar charts for visualizing
large transaction data sets. IEEE transactions on visualization and computer
graphics 13, 822–833 (2007).
5.
Ziegler,
C.N., Skubacz, M. & Viermetz, M. Mining and exploring unstructured
customer feedback data using language models and treemap visualizations in 2008
IEEE/WIC/ACM International Conference on Web Intelligence and Intelligent Agent
Technology 1 (2008), 932–937.
6.
Isenberg, P.
& Fisher, D. Collaborative Brushing and Linking for Colocated Visual
Analytics of Document Collections in Computer Graphics Forum 28 (2009),
1031–1038.
7.
Keefe, D.,
Ewert, M., Ribarsky, W. & Chang, R. Interactive coordinated multipleview
visualization of biomechanical motion data. IEEE transactions on visualization
and computer graphics 15, 1383–1390 (2009).
8.
Liu, Z.,
Stasko, J. & Sullivan, T. Selltrend: Interattribute visual analysis of
temporal transaction data. IEEE Transactions on Visualization and Computer
Graphics 15, 1025–1032 (2009).
9.
Oelke, D. et
al. Visual opinion analysis of customer feedback data in 2009 IEEE Symposium on
Visual Analytics Science and Technology (2009), 187– 194.
10.
Wu, Y. et
al. OpinionSeer: interactive visualization of hotel customer feedback. IEEE
transactions on visualization and computer graphics 16, 1109– 1118 (2010).
11.
Brath, R. & Macmurchy, P.
Spherebased
information visualization: Challenges and benefits
in
2012 16th
International Conference on
Information
Visualisation
(2012),
1–6.
12.
Chen,
H.,
Chiang,
R.
H.
&
Storey,
V. C. Business intelligence and analytics: From big data to big impact.
MIS
quarterly,
1165–1188 (2012).
13.
Wang,
Y.
&
Feng,
H.
Customer
relationship management capabilities.
Management
Decision
(2012).
14.
Munzner, T.
Visualization
Analysis and Design
(AK Peters/CRC
Press,
2014).
15.
Novikova, E. & Kotenko, I.
Visual
analytics for detecting anomalous activity in mobile money transfer services
in
International Conference on Availability, Reliability, and Security
(2014),
63–78.
16.
Shi, C., Wu,
Y., Liu, S., Zhou, H. &
Qu, H.
Loyaltracker:
Visualizing
loyalty
dynamics in search engines.
IEEE
transactions on visualization and
computer
graphics
20,
1733–1742
(2014).
17.
Xie, C.
et al.
VAET: A
visual analyt ics approach for etransactions timeseries.
IEEE Transactions
on Visualization and Computer Graphics
20,
1743–1752
(2014).
18.
Yaeli,
A.
et
al.
Understanding
customer behavior using indoor location
analysis and visualization.
IBM Journal of Research and Development
58,
3–1
(2014).
19.
Dou, W.
et al.
DemographicVis:
An
alyzing
demographic information based on user generated content
in
2015 IEEE
Conference on Visual Analytics Science and Technology (VAST)
(2015),
57–64.
20.
Hayashi, A., Kohjima, M.,
Matsubayashi, T. & Sawada, H.
Regularity Measure and Influence Weight
for Analysis and Visualization of Consumer’s Attitude
in
International
Conference on Information Visualisation (July
2015),
290–299.
21.
Wu, W.
et
al.
Telcovis: Visual exploration of cooccurrence in urban human mobility
based on telco data.
IEEE transactions on visualization and computer
graphics
22,
935–944 (2015).
22.
Gal, G., Singh,
K. & Best, P.
Interactive visual
analysis of anomalous accounts payable transactions in SAP enterprise systems.
Managerial
Auditing
Journal
(2016).
23.
Ko,
S.
et
al.
A
survey
on
visual
analysis approaches for financial data
in
Computer
Graphics
Forum
35
(2016),
599–
617.
24.
Rodriguez, J.,
Kaczmarek, P. &
Depew, D.
Visualizing
financial data
(Wiley Online Library, 2016).
25.
Wanner,
F.
et
al.
Integrated
visual
analysis of patterns in time series and text dataworkflow and
application to financial data analysis.
Information
Vi
sualization
15,
75–90
(2016).
26.
Linderman, G.
C., Rachh, M.,
Hoskins, J. G.,
Steinerberger, S. & Kluger, Y. Efficient algorithms for tdistributed
stochastic neighborhood embedding.
arXiv preprint arXiv:1712.09005
(2017).
27.
Leite, R. A.
et
al.
EVA: Visual analytics to identify fraudulent events.
IEEE
Transactions on Visualization and Computer Graphics
24,
330–339
(2018).
28.
Roberts, R. C.
& Laramee, R. S.
Visualising
business
data:
A
survey.
Information
9,
285
(2018).
29.
Yue, X.
et
al.
Bitextract: Interactive visualization for extracting bitcoin exchange
intelligence.
IEEE
transactions
on visualization and computer graphics
25,
162–171
(2018).
30.
A.
Leite,
R.,
Gschwandtner,
T.,
Miksch,
S., Gstrein, E. & Kuntner, J.
Neva: Visual analytics to identify
fraudulent networks
in
Computer Graphics Forum
(2019).
31.
Didimo, W.,
Grilli, L., Liotta, G., Montecchiani, F. & Pagliuca, D. Visual querying and
analysis of temporal
fiscal networks.
Information Sciences
505,
406–421 (2019).
32.
Singh, K.
& Best, P. AntiMoney Laundering: Using data visualization to identify
suspicious activity.
International
Journal
of
Accounting
Information Systems
34,
100418
(2019).
RUSCOMNADZOR Reg. Number El. № ФС77-37344 INFORMREGISTR Reg. Number № 0421100125
Copyright http://sv-journal.org