In the
modern world there is a large amount of information that can be represented as
objects and the relationship between them. For example, objects can be
individuals, whose relationship is described by a certain
characteristic. In this case, analysis can be conducted in various ways:
elastic map method, cluster analysis, graphs plotting, etc. The paper presents
graph representation of an individual. The reason for choosing this method is specified
below [1].
Political
forces often play an important role for the development of scientific and
social activities within individual states and the world community. Decisions
made by political forces may depend on the individual characteristics of the
person (gender, age, fraction) and the relationship between them.
Information
about political figures is also posted on the Internet. It enables to obtain
data in sufficient quantities. It is unreasonable to collect data on
politicians manually, since there is a lot of information. Therefore,
algorithms are being developed that enable to collect data from Internet information
sources.
To build
graphs for political leaders, it is necessary to determine the nodes of the
graphs and describe the relationship between them.
Graph
plotting is an unnatural process for the computer. With existing software it is
rarely possible to construct large graphs or have the ability to interact.
However, with the correct construction,
graphs enable
a qualitative data analysis and identify both explicit and hidden relationships
[2-4].
Theasiest way for a person to perceive data is as 2D objects, but often data has a larger dimension (number of fields/attributes can reach hundreds of orders). This raises two main questions:
•
How to bring the data
to the form suitable for visualization?
•
How to represent
multidimensional objects in a space of lower dimensions?
The fact is
that it is good to have a two-dimensional picture in front of you, which would
reflect the data patterns: cluster structure, the presence of dependencies
between objects, etc.
The problem
of displaying multidimensional data in a 2D measurement is currently well
studied - various approaches can be used for visualization [5, 6]:
•
elastic map,
•
cluster analysis,
•
neural
network,
•
data analysis on graphs,
•
others.
The choice
of how to visualize data is paramount and often depends on the data itself.
If all
attributes are numeric,
boolean
,
or convertible, the first three methods can be used. In this case, it is
necessary to determine the choice of the projection plane (for example, the
plane of the first two main components) and the principle of projection (some
extreme functional).
If the
researcher is more interested not in data, but in the relationships, data
analysis on graphs is more often used.
The initial
data on politicians have the following characteristics:
•
most
of the fields are of the text data
type,
•
fields
can be nested and/or have a list
view (consists of several elements of the same type).
•
objects
can be linked based on several
fields - all links must be identified.
According
to the peculiarities of the data and the formulation of the problem (study of
the relationships between objects), we consider the data using graphs.
At the same
time, we divide the process of collecting and analyzing data into the following
components:
•
Data collection (Extract)
•
Data processing (Transform)
•
Loading data into some
storage (Load)
•
Visualization and analysis.
One of the
main methods of data collecting on the Internet is web scraping. The general
principle of web scraping can be represented as follows: the program code sends
a request to the target source and receives a response in the form of HTML
code, after which it searches for the required information using the XPath
query language.
Requests
are most often generated using the HTTP protocol; they use the GET request
method to receive data.
The
response is an object that is predisposed to receive any data. In data
processing, an HTML document is extracted from the response, after which a
search is performed, and the result is converted to the required format. This
process is called parsing.
Web
scraping can be done in two ways:
•
development of software;
•
use
of third-party software (including API).
If it is
necessary to use several information sources at the same time for data
extraction, the second method is usually not used. Automate data collection
during the development of
software
can be
through the use of agent technologies (software agents) [7, 8]. Software
agent is a computer program that acts on behalf of a user on demand or
according to a schedule. Additional software packages can be also used to
interact with the browser. When developing software to solve this problem, the
programming languages Python and JavaScript are most often used.
Information
about politicians is available on various Internet sources. As an exam-
ple
, information from such sources as
VoteSmart
and
Govtrack
is considered [7, 8]. They have a
complex structure, so it is impossible to use third-party software. For the
development, we used the Python programming language and software packages of
the language, such as selenium, lxml.
The data
collection algorithm is divided into three subtasks:
•
GET request to an
information source;
•
extracting data from
the response body (HTML document) using Xpath;
•
saving the received
data with the possibility of further visualization.
Thus, the
algorithm is as follows (see Fig. 1).
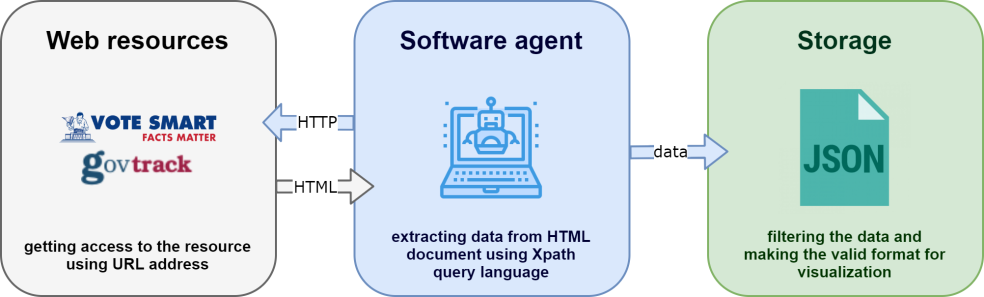
Fig.
1.
Data collection algorithm
JSON is selected as the data
presentation format. The choice is due to the complex nested structure of the
initial data, which is difficult to process when stored in CSV format.
Meanwhile, the XML format is redundant [11].
For the analysis of interrelated objects
graphical representation of the data are used. A graph consists of vertices
(nodes) and edges that form a connection between vertices. In order to
determine the nodes and edges, we select the characteristics of the person
obtained during data collection:
•
name
•
party
•
district
•
ratings
•
bills
•
religion
•
education
•
political experience
•
current legislative committees
•
former committees
•
professional experience
•
other organizations
•
additional
information (awards, favorite
quotes, etc.)
The figure
shows an example of the data collected by a politician in JSON (see Fig. 2).
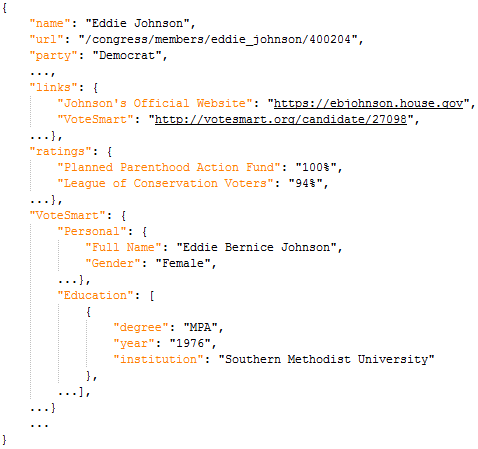
Fig.
2.
Example of politician data
Due to the
fact that a person has many properties, when constructing a graph for
politicians, two approaches arise:
•
the
node of the graph is the person, an
edge - some of the properties;
•
several
types of nodes are distinguished
from the properties of the person, in this case the edges reflect the
correspondence of nodes in the initial data.
In the
first approach, for the trivial case, nodes can be connected by an edge of the
same type (for example, by belonging to the same party). In this case, between
the nodes either there is or there is no a node. The approach can be expanded
by introducing edges for each of the considered properties and introducing
markers (color, weight) to distinguish between the edges. For clarity, there should be no more than 5
different types of edges.
For the
second approach, the nodes are unique values of characteristics; edges are the
relationship between these characteristics in the initial data. To construct
such a graph, it is required to consider in what form the information is
presented.
The initial
data are separate JSON files, which contain information about representatives
of some of the largest US states: Texas, California and Florida. To construct a
graph it is necessary to explicitly distinguish nodes and edges. We divide the
nodes into categories, while all nodes can be connected by edges only through
the node identity.
In the
typical case a graph is defined by an adjacency matrix, but other methods are
often used. In particular, if there are many “zeros” in the adjacency matrix,
which indicate that there is no connection between
nodes, the graph is specified with a list.
The
list
consists
of
entries
of
the
following
form
(1):
|
|
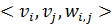 , where
|
(1)
|

In this case the graph will be
undirected. The edge only indicates the connection between the nodes, not the
nature of the connection. We distinguish the following categories of nodes:
•
Person
•
Educational institution
•
Religion
•
Membership in a civil
organization
•
Party
Because of
the initial data representation one of the nodes of each edge will be a
‘person’ node.
The graph
may be weighted and unweighted. Weight can be introduced if there is a
one-to-many relationship between objects. In particular, such a relationship is
formed in such node as ‘person – university’ and ‘person - membership in a
civil organization’. In this case, the weight of the edge will be specified and
show the relative share of the university/organization for a particular
person.
Mathematically
this
is
represented
as the following formula
(2):
|
|
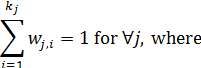
|
(2)
|

To get a
graph structure (the Transform step in the previously described data collection
and analysis scheme), two factors should be taken into account:
•
it
is necessary to manually
(algorithmically) select nodes of various types and relationships between them,
•
it
is necessary to take into account
that nodes can be repeated in the initial data.
There are
two main approaches to take into account the second factor:
•
maintenance of
uniqueness of data when creating/adding - if at some stage a node is
encountered that is already in the graph, a new node is not created, but only
its relationships are added,
•
maintenance of
uniqueness of data due to queries - if, when creating/adding, a node is
encountered that is already in the graph, then this node is first created, but
then a MERGE-type query occurs, which combines identical nodes with each other.
The Python programming
language is used to obtain the graph structure. The developed algorithm
converts the initial JSON data into nodes and edges, which are stored in
separate CSV files.
There is no
unified tool for constructing graphs. Some solutions can build graphs limited
by the number of nodes, while others do not visually display data [12, 13]. One
commonly used application is
Gephi
[14].
Gephi
is a free, open-source data visualization product. It
is
a user
interactive software and can be applied for
constructing complex systems.
When
constructing a graph, we hypothesize that connected nodes are close to each
other,
and unconnected or opposite nodes are located at a
great distance from each other.
To test
this hypothesis, we choose the Force Atlas layout algorithm, having previously
colored the nodes depending on the type of characteristic. The algorithm is
based on minimizing ‘energy’ (the nodes are iteratively attracted or repelled
from each other in the visualization space, depending on their relative
position and the presence of relationships). Thus, the algorithm will be
sensitive to the chosen hypothesis.
We build a
graph with the initial data by customizing the display of the output. The graph
takes the following form (see Fig. 3) and contains 4601 nodes and 5993
edges.
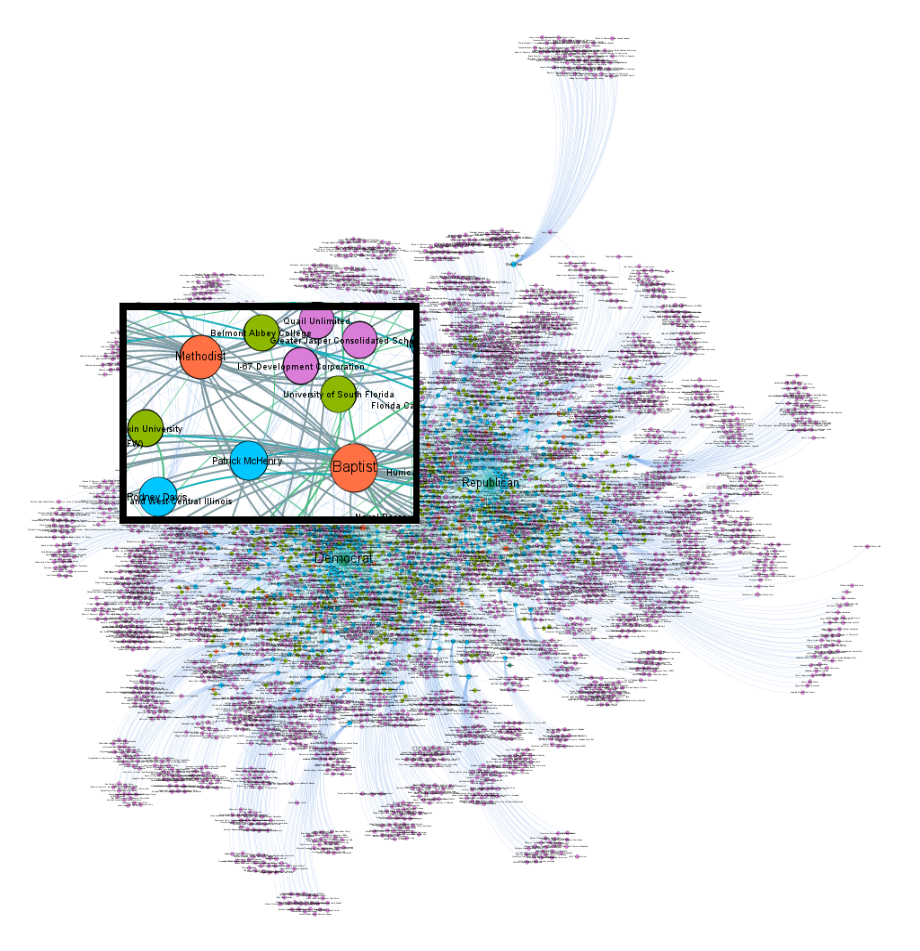
Fig.
3.
Graph
In the figure, the size of a vertex
is directly related to the number of edges adjacent to it, and the thickness
of an edge is directly related to its weight. The following colors are used in
the figure:
•
orange – religion;
•
blue-green – party;
•
green – educational institution;
•
blue – politician;
•
purple – organization.
Due to the
layout method, the graphs were divided into two clusters: Democrats and
Republicans, but due to the large number of nodes, the data cannot be analyzed
in detail.
Filters can
be used to refine the information. For example, the following fragment of the
graph shows
which
university
representatives
of
the
states
most
often
graduate
from (see Fig. 4).
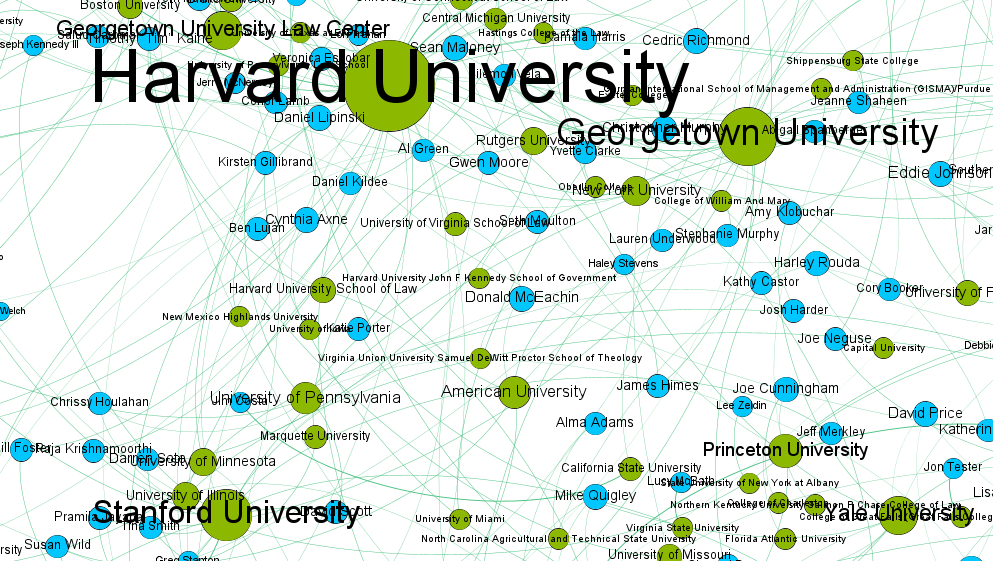
Fig.
4.
Connection between politicians and educational institutions
Harward,
Georgetown and Stanford are seen to be the leading educational institution on
the number of graduates.
We can also
view information about the relationship of an individual object or group of
objects. To do this we build a new graph (see Fig. 5), leaving the politicians
of the states of Texas, California and Florida in it. The choice of states is
due to the fact that they have more representatives than other states. In the
new graph, the color scheme has been
changed,
a
division by color between states has been added: representatives of Texas are
highlighted in green, Florida – in red, California – in blue.
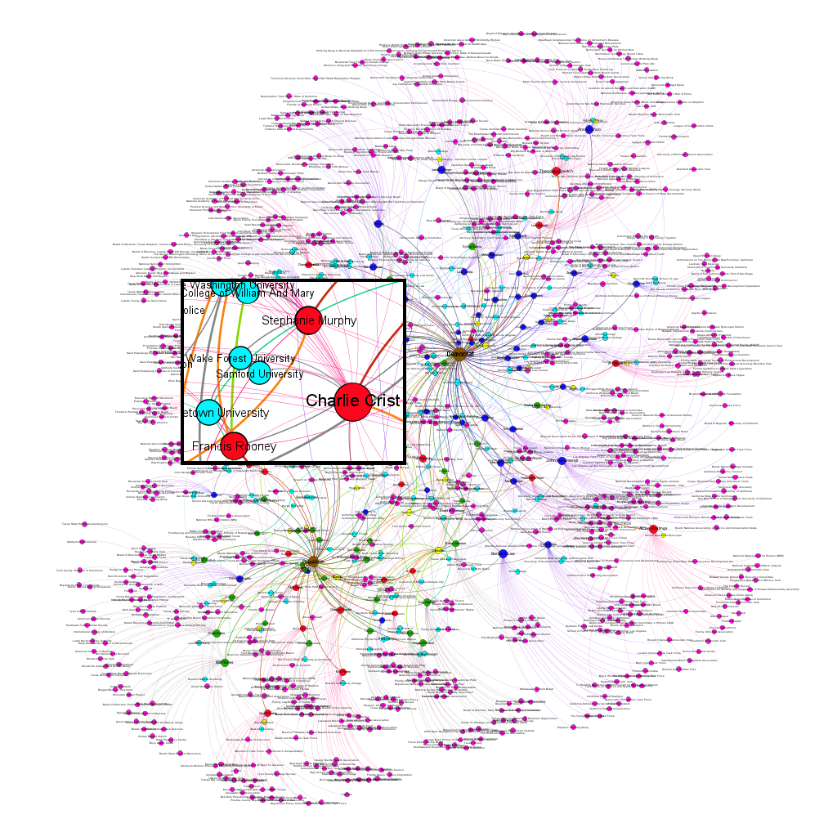
Fig.
5.
Graph with representatives of three states
We check if
representatives of different states can coexist with each other. To do this, we
consider the subgraph, which we get after filtering of the original graph by
area (see Fig. 6).
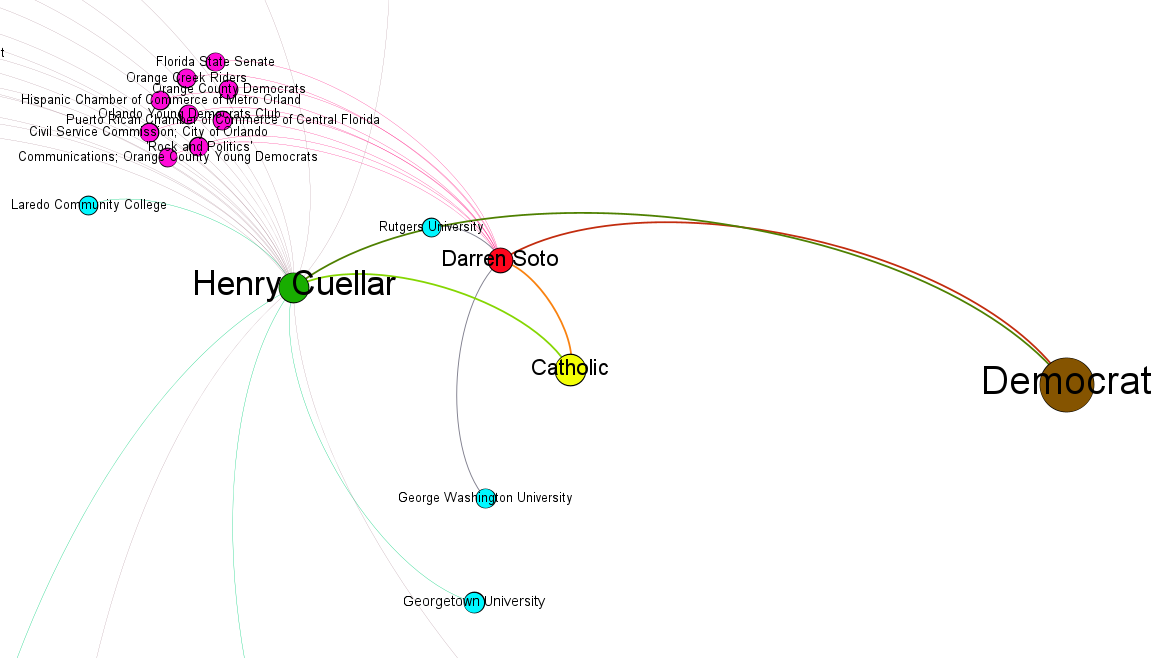
Fig.
6.
Subgraph after filtering
The figure
shows that Henry Cuellar, a representative from Texas, and Darren Soto, a
representative from Florida, are close to each other and it can be assumed that
their views are similar. As we can see, despite the fact that they are from
different states, they have relationships with the same organizations. Both are
Catholic, and belong to the Democratic Party. It tells us that the chosen Force
Atlas layout method confirms the main hypothesis.
Generally
speaking, it is impossible to ensure that these representatives will be close
to each other if we distribute the weights of the edges in a different way.
For example, remove the normalization of the edges of the form
“person-educational institution” or make some type of relationship less
significant. Ultimately, the constructed graph will largely depend on how the
edges are weighted and how the graph is laid. This, in turn, will affect what
conclusions will be drawn from the results of the graph analysis.
The task of
visualizing linked multidimensional objects is relevant in the field of data
analysis. The described technology offers a working approach to constructing
graphs for an object such as a ‘politician’.
Isolation
of internal entities of various
nature
from a complex
object allows you to build relationships between these entities and draw
certain conclusions about them. In particular, the most graduating educational
institution is Harvard University. The construction of several graphs allows us
to analyze in more detail and find internal
relationships
– for
this,
Gephi
provides a wide range of filtering functionality.
The existing
graph can be supplemented for completeness. For example, you can add the node
of the ‘state’ type and check if representatives of one state are located
around such node. It will confirm or refute the main hypothesis that objects
close in a multidimensional volume of data should be located close to each
other on the graph. Any such addition increases the number of relationships and
complicates visual perception, but allows you to identify additional
relationships.
An
alternative way to analyze related objects is to use a graph database. For
example, using neo4j database it becomes possible to conduct queries that
cannot be implemented using Gephi.
In future
it is planned to consider the graph in respect to solving practical problems,
whether it
be
an analysis of educational institutions
or lobbying organizations, or religions depending on the states, etc.
The use of
such graph models seems extremely promising from the point of view of analyzing
a large amount of information not only on such a complex object as a person,
but also on organization technology, etc.
The study
was carried out at the expense of the Russian Science Foundation grant (project
No. 19-71-30008).
1.
Kulik,
S.,
Shtanko,
A.: Using
convolutional neural networks for recognition of objects varied in appearance
in computer vision for intellectual robots. Procedia Computer Science 169,
164-167 (2020).
2.
Onykiy,
B.,
Artamonov,
A.A.,
Tretyakov,
E.S.
Ionkina,
K.V.: Visualization of large samples of unstructured information on the basis
of specialized thesauruses. Scientific Visualization 9(5), 54-58 (2017).
3.
Tretyakov,
E.S.,
Tukumbetova,
R.R.,
Artamonov,
A.A.: Methodology of Analysis of
Similar Objects with the Use of Modern Visualization Tools. Mechanisms and
Machine Science 80, 113-119 (2020).
4.
Artamonov,
A.A.,
Leonov,
D.V.,
Nikolaev,
V.S.,
Onykiy,
B.N.,
Pronicheva,
L.V.,
Sokolina,
K.A.,
Ushmarov
, I.A.: Visualization of semantic
relations in multi-agent systems. Scientific Visualization, 6 (3), 68-76
(2014).
5.
Zinoviev,
A. Y. Visualization of multidimensional data. — Krasnoyarsk State Technical
University, 2000. — 180 p.
6.
Bondatev
A.E.,
Bondarenko
A.V.,
Galaktionov
V.A.,
Klyshinsky
E.S. Visual analysis of clusters for a multidimensional textual
dataset /
Scientific
visualization,
Т.
8, № 3, 2016, pp. 1-24.
7.
Kulik,
S.D.,
Shtanko,
A.N.: Experiments with Neural Net Object Detection System YOLO on Small
Training Datasets for Intelligent Robotics. Mechanisms and Machine Science 80,
157-162 (2020).
8.
Kulik,
S.D.: Neural network model of artificial
intelligence for handwriting recognition. Journal of Theoretical and Applied
Information Technology 73(2), 202-211 (2015).
9.
Votesmart,
https://justfacts.votesmart.org, last
accessed 2020/06/10.
10.
Govtrack,
https://www.govtrack.us, last accessed
2020/06/10.
11.
Grigorieva,
M.A.,
Aulov,
V.A.,
Golosova,
M.V.,
Gubin,
M.Y.,
Klimentov,
A.A.: Data knowledge base prototype for modern
scientific collaborations. In: Selected Papers of the 7th International
Conference Distributed Computing and Grid-technologies in Science and
Education, pp. 26-33. CEUR,
Dubna
(2016).
12.
Galkin,
T., Popov, D.,
Pilyugin,
V.,
Grigorieva,
M.: The visualization method pipeline
for the application to dynamic data analysis. In: Proceedings of the 27th
Symposium on Nuclear Electronics and Computing, pp. 295-299. CEUR,
Budva
(2019).
13.
Galkin,
T.P.,
Grigorieva,
M.A.,
Klimentov,
A.A.,
Korchuganova,
T.A.,
Milman,
I.E.,
Pilyugin,
V.V.,
Titov,
M.A.: Visual cluster analysis for
computing tasks at workflow man-
agement
system of the
ATLAS experiment at the LHC. In:
GraphiCon
2018 - 28th
Interna-tional
Conference on Computer Graphics and
Vision, pp. 111-114.
GraphiCon
Scientific Society,
Tomsk (2018).
14.
Gephi,
https://gephi.org, last accessed 2020/06/28.
