Clustering
is one of the main development directions of state industrial policy in
Russia. At the beginning of 2018, there were 115 clusters in Russia on the
territory of 43 entities. They include about 3,500 enterprises with more than
1,400 thousand employees [1]. For the period 2013–2018 the total amount of
subsidies exceeded 12 billion rubles [2].
The active support of the
clusters by the authorities has influenced the emergence of a significant
amount of research and publications in this area. Scientists use various
visualization methods to simplify the understanding of the studied
relationships between cluster components. At the same time, visualization in
this particular case is necessary not so much for convenient perception of the
information being studied as for simplifying its analysis, further processing
and making forecasts.
In
this regard, we note that the cluster policy of the state is directly related
to the development of individual industries in specific regions of the country.
The limitations of both budgetary and extra-budgetary financing necessitates an
adequate quantitative justification for the selection of priority sectors and
regions, investments in which are able to provide maximum utility. At the same
time, given the scale of the national economy and the high diversification of
its sectoral structure, the ability to obtain a holistic visual representation
of the relevant statistical data is of particular importance when implementing
cluster policy. Moreover, it is not just about providing options for the
perception, assessment and analysis of available information. First of all, the
goal of visual presentation of data on economic clustering is to provide the
ability to model and predict the behavior of the clustered industry.
Thus,
on the basis of the foregoing, it can be summarized that the visualization of
the task of identifying industrial clusters is the core feature for
constructing plans, forecasts and development strategies for both individual industries
and regions, and the national economy as a whole.
The use of visual methods for displaying the results of modeling
the interactions of cluster relations subjects is designed to simplify the
implementation of planning, forecasting, programming, and strategy tasks. A
review of the scientific literature on the problems of clustering the economy
revealed that existing works in this field from the point of visualization can
be divided into three groups. Let's consider them in more detail.
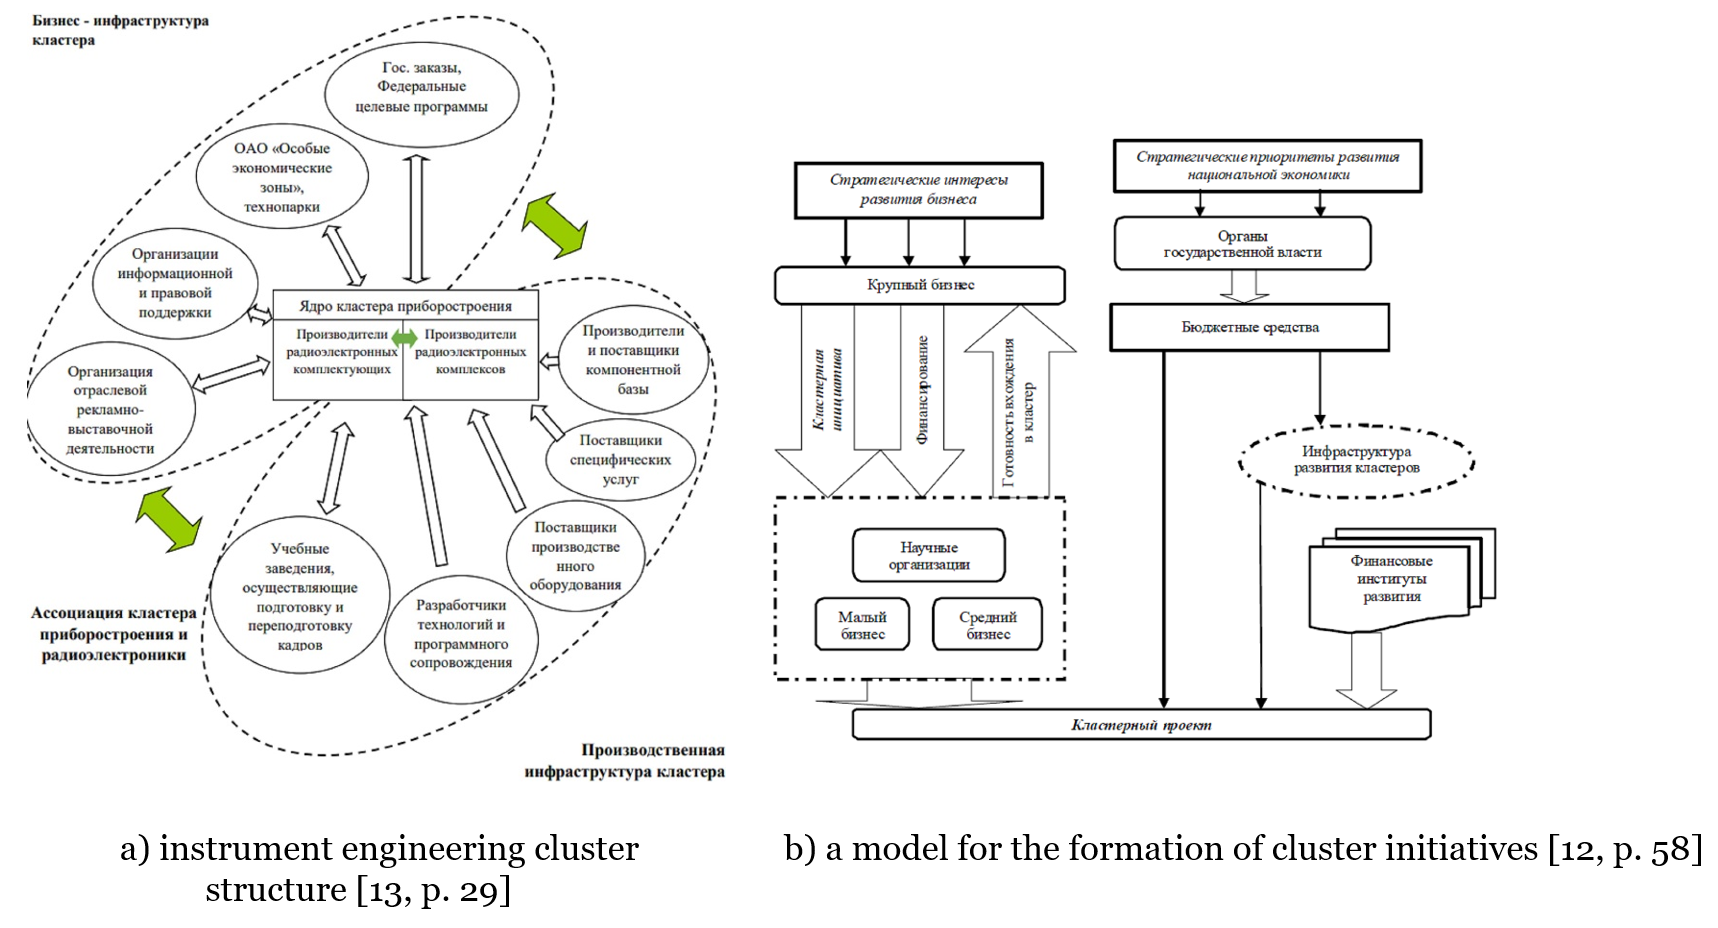
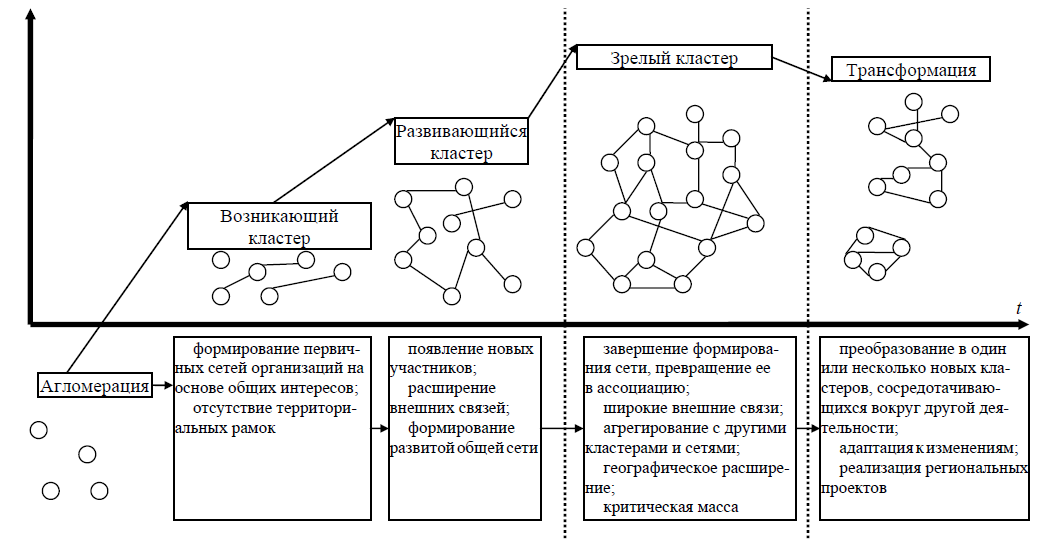
To the first group we refer works in which researchers attempted
to systematize the essential properties and attributes of clusters. These works
contain models formulated at the verbal level and based on certain theoretical
concepts. As a rule, the models of the first group reflect the relations
between the subjects of the clusters [3, p. 25; 4, p. 6; 5, p. 31; 6, p. 13];
stages of their formation (life cycles of clusters) [7, p. 9; 8, p. 17; 9, p.
27]; cluster creation conditions [10, p. 3; 11, p. eighteen]; features of the
formation of cluster initiatives [12, p. 58; 7, p. 9]; structures and types of
clusters [8, p. 85; 11, p. 191]. Examples of models visualizing the theoretical
concepts of cluster development are presented in Figure 1.
c) cluster
life cycle [8, p. 27]
Fig. 1. Examples of theoretical concepts visualization for cluster
development
The main advantage of the models in this group is the availability
of understanding for the theoretical foundations of clustering; as a drawback,
we note the low adaptability of the model information use to build forecasts
and development strategies for both specific clusters and their localization
territories.
In the second group we included works containing a visual
representation of actual statistical information regarding various
characteristics of clusters at a specific date and for specific territories:
the number of clusters and their types [14, p. 22; 15, p. 52; 16, p. 188];
cluster development parameters [15, p. 49-51; 17, p. one hundred]; sources of
cluster financing [18, p. 46] and others. Examples of models visualizing the
quantitative characteristics of clusters are presented in Figure 2.
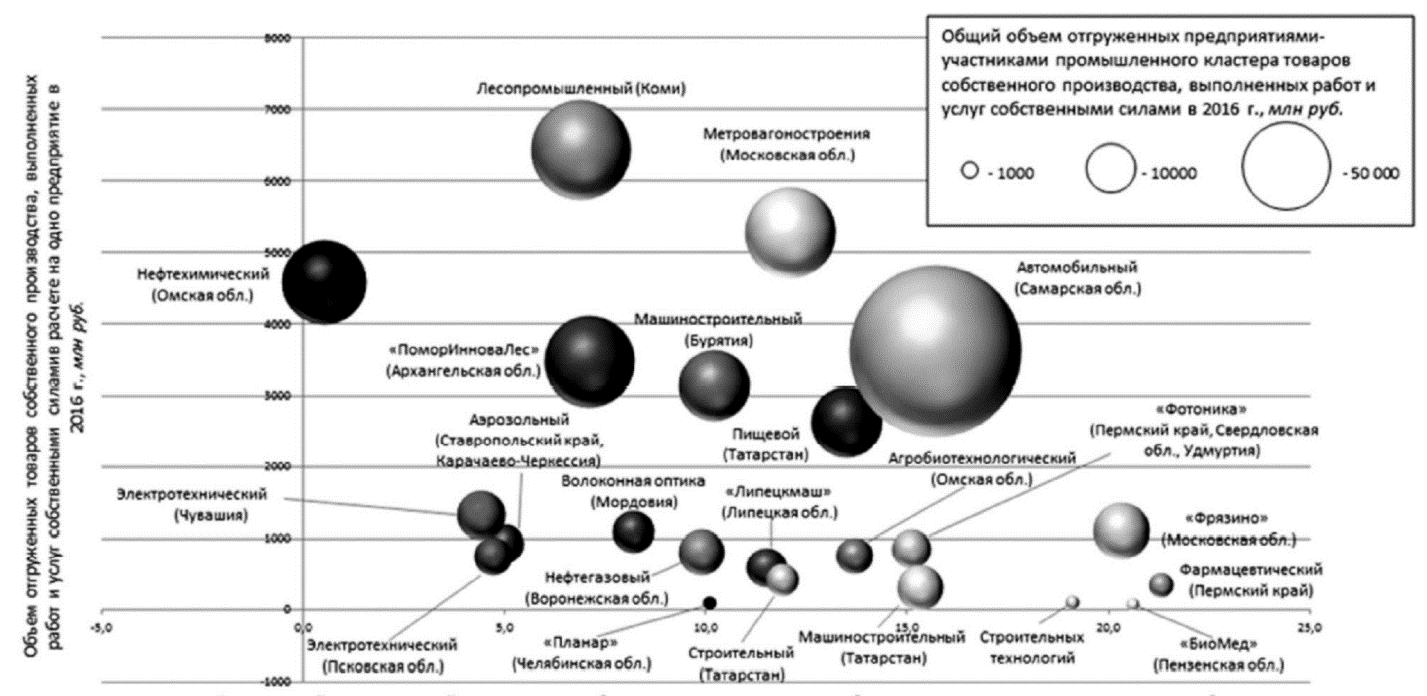
а) indicators of the volume of goods shipped
by enterprises participating in industrial clusters of goods of own production
[15, p. 51]
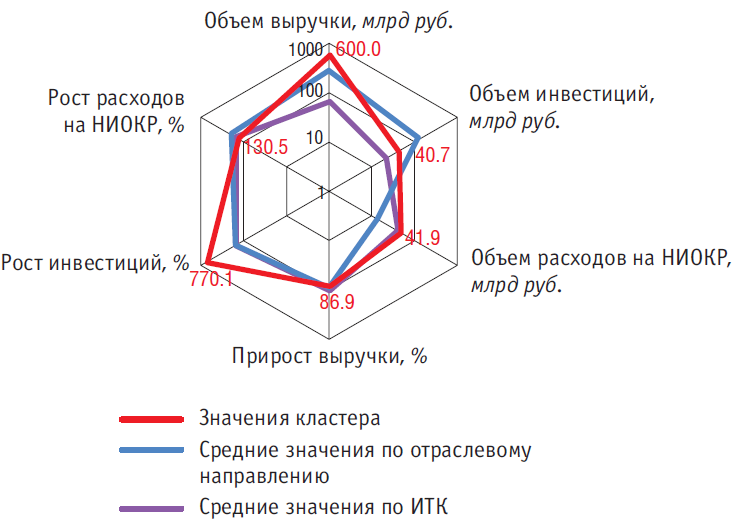
b) development parameters of the Kama innovative
territorial-production cluster of the Republic of Tatarstan [17, p. 101]
Fig. 2. Examples of clusters quantitative characteristics
visualization
As a rule, scientists use graphical methods when constructing
these models, including, most widely, the mapping method. This is due to the
need to correlate spatial characteristics with attributive ones.
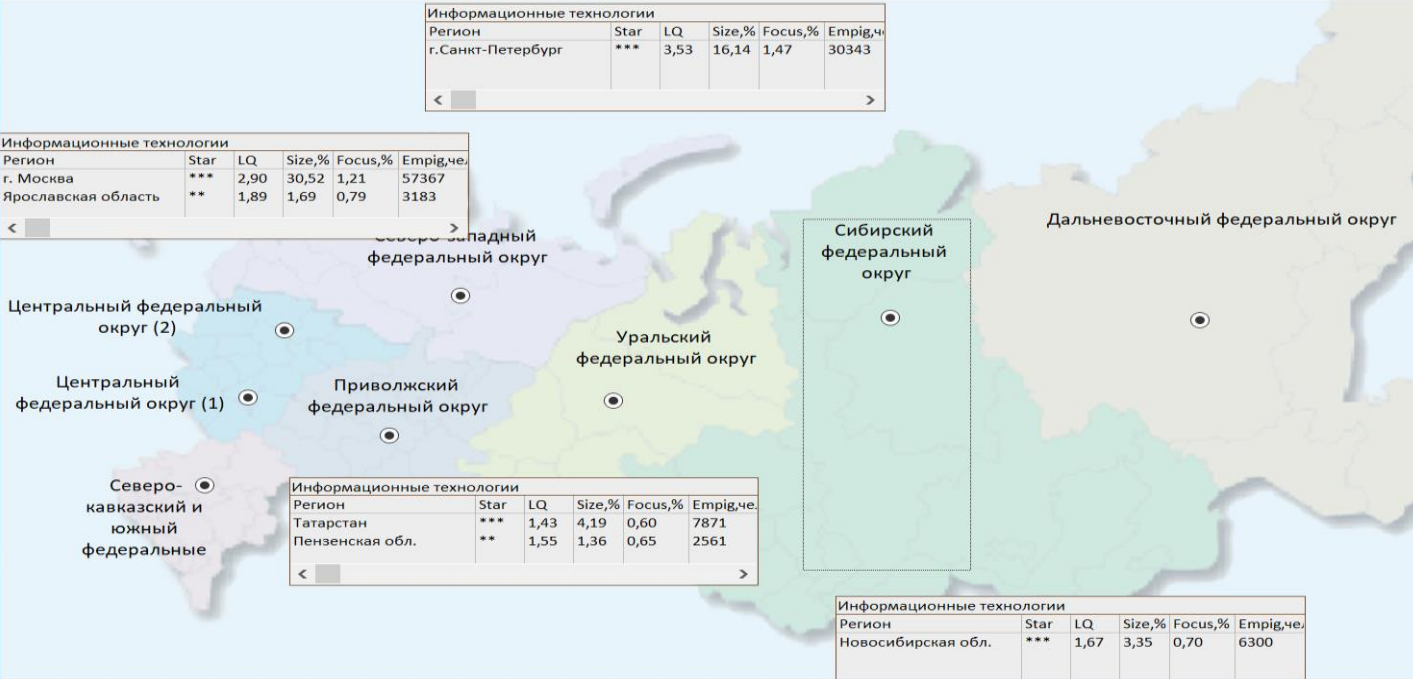
We would like to note that the specialists of the Russian Cluster
Observatory of the ISSEK NRU HSE initiated and developed the project “Map of
Russian Clusters” [2]. The aim of the project is to create an open, relevant,
interactive database of clusters in the regions of Russia. The tool contains
data on the number, scale of activity, industry focus, maturity and other
important characteristics of Russian clusters. A fragment of the map is shown
in Figure 3.
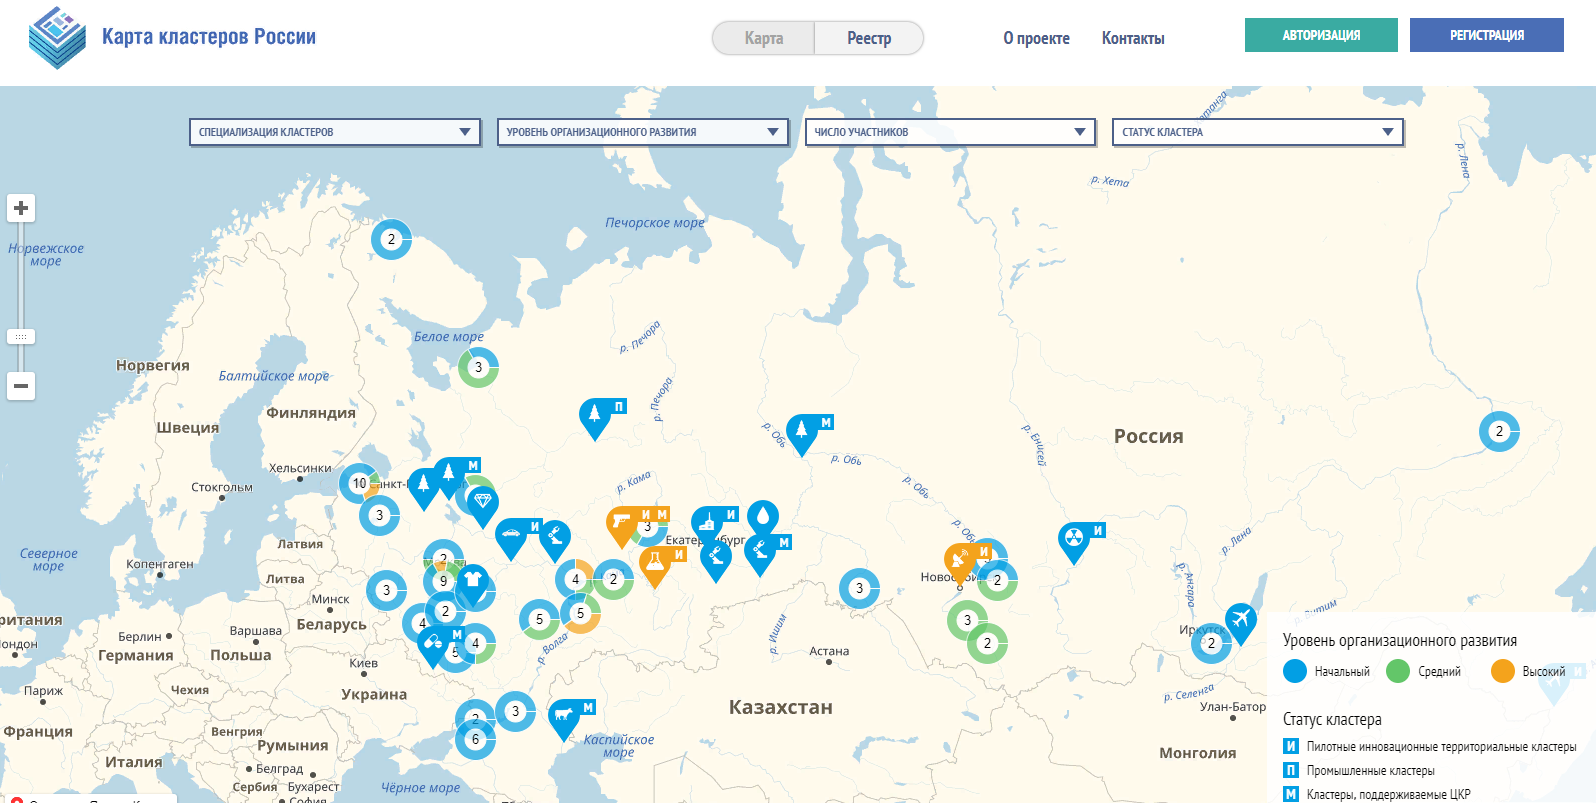
Fig. 3. Map of Russian clusters [2]
The described methods of visualization within the framework of the
models of the second group fully allow to perceive, evaluate and analyze the
relevant information. But, like the models of the first group, they do not
provide fully the capabilities of forecasting and strategic planning.
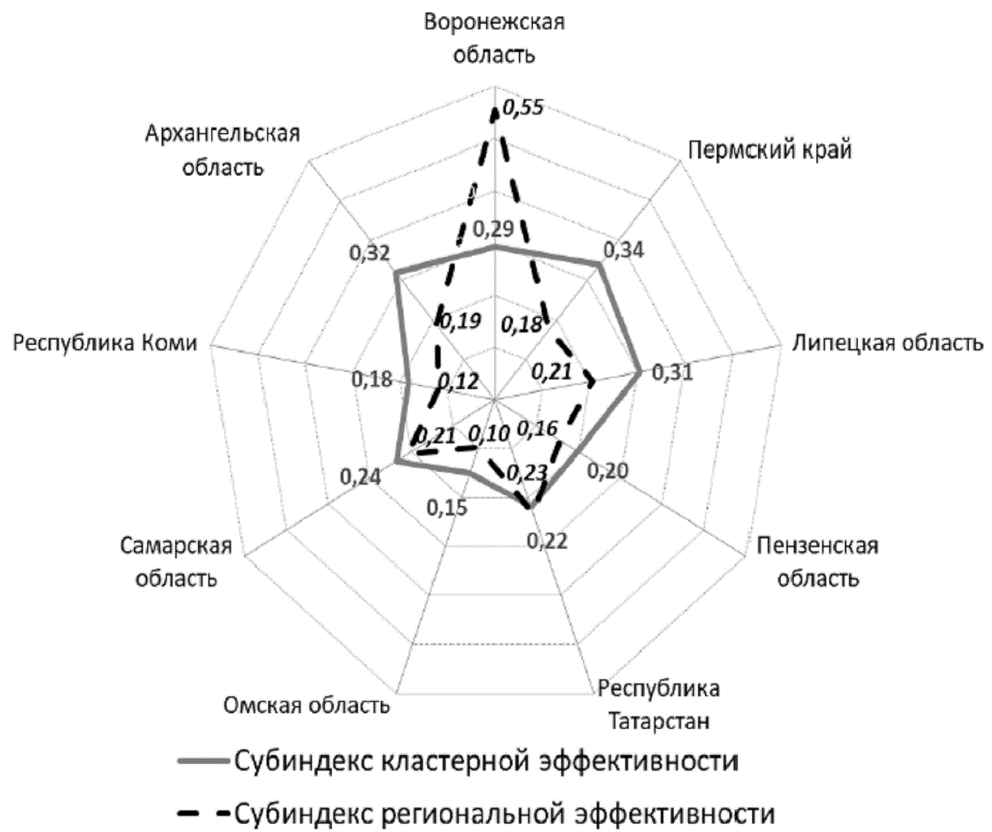
In the third group, we included works with a visual representation
of author's calculations in the field of quality and prospects for clustering.
As a rule, the quality of clusters is assessed by calculating the integral
clustering indices, including indicators of management quality and indicators
of interaction (integration) of participants [19, p. 32-33; 15, p. 49] levels
of development and scale of clusters [20, p. 158; 21, p. 175; 22, p. 152].
Examples of models visualizing author's calculations of cluster quality
indicators are presented in Figure 4.
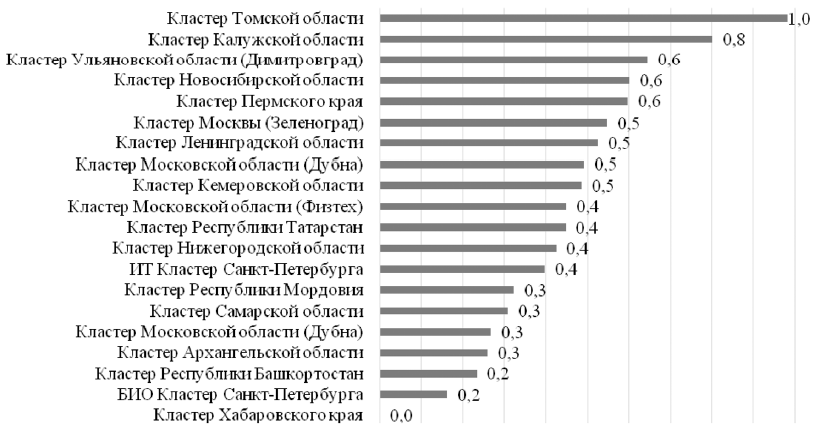
a)
cluster
management quality index [19, p. 33]
b)
subindexes of cluster and regional effectiveness of the Russian Federation
constituent entities [21, p. 175]
Fig.
4. Examples of visualization of author's calculations for cluster quality
indicators
Speaking of examples of models that visualize the author’s
calculations of the prospects for clustering, let us explain what is meant by
the assessment of territories, industries, or types of economic activity for
their readiness for clustering. In fact, such an assessment involves the
identification of territories, industries, or types of economic activity that
could potentially provide the maximum return on investment. Based on the
results obtained, decisions are made to support specific cluster development
programs.
As a rule, the assessment of the clustering prospects, and
accordingly, the construction of development forecasts on this basis, are carried
out by analyzing the concentration of activity in space by calculating various
indices and coefficients: Gini coefficient [23]; the Ellison – Glazer index
[24]; Marel – Sedilott index [25], Duranton – Overman index [26]; localization
coefficient [22, 27-34].
Examples of models visualizing the clustering prospects assessments
are presented in Figure 5.
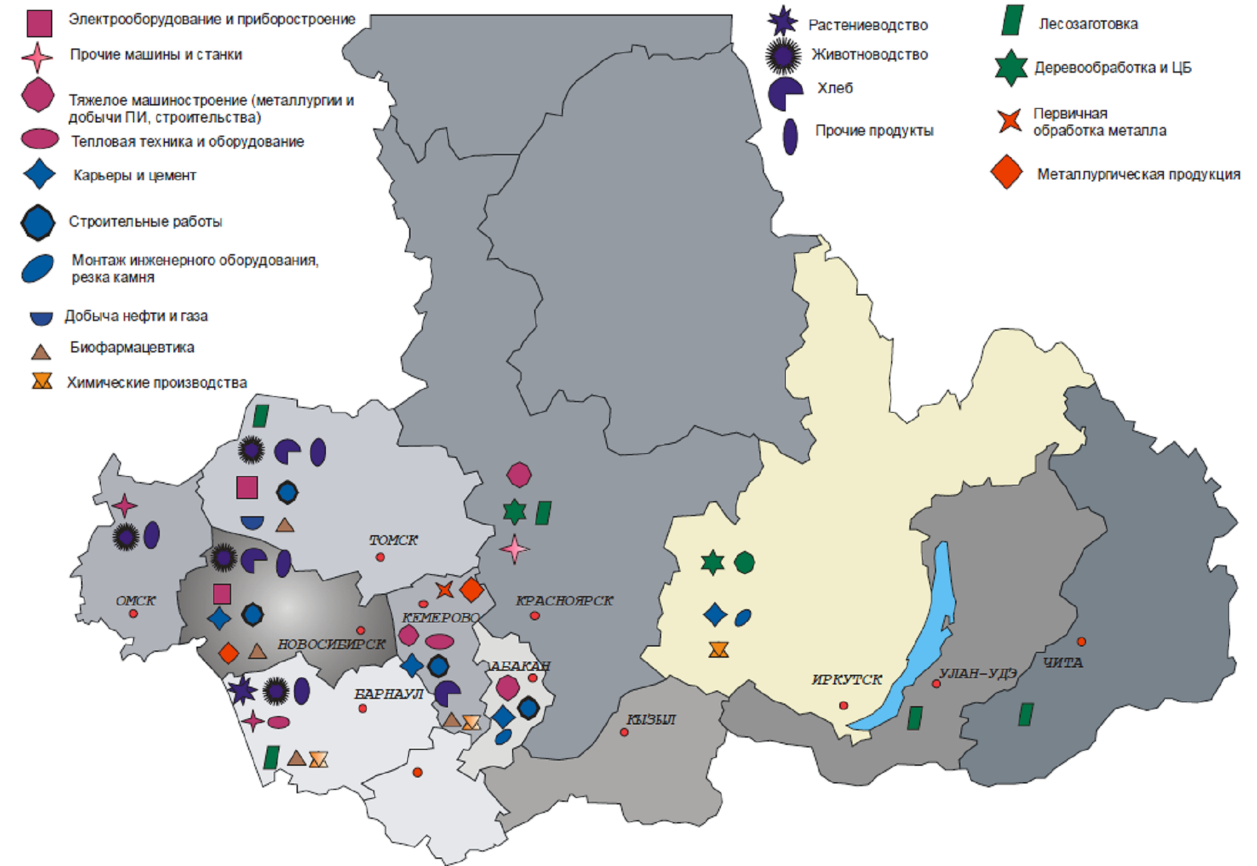
a) regional diversified clusters of
Siberia [11, p. 102]
b)
the value of localization indicators of the cluster Information Technology in
Russia [13, p. 22]
Fig.
5. Examples of visualization of the clustering prospects assessment
Special
attention is to be paid to assessment of the clustering prospects based on
graph theory. As a rule, the graphs are use for visualization of direct
relationships identified in the analysis of the intersectoral balance tables. Various
methods of graph partitioning are involved when using it as an independent tool
for identifying clusters; an industrial cluster is a distinguished component of
the connectedness of the original graph in the process of using it. [35, p.
97]. Note that we have found examples of visualization of clustering prospects
based on graph theory only in relation to individual sectors of the economy
(Fig. 6).
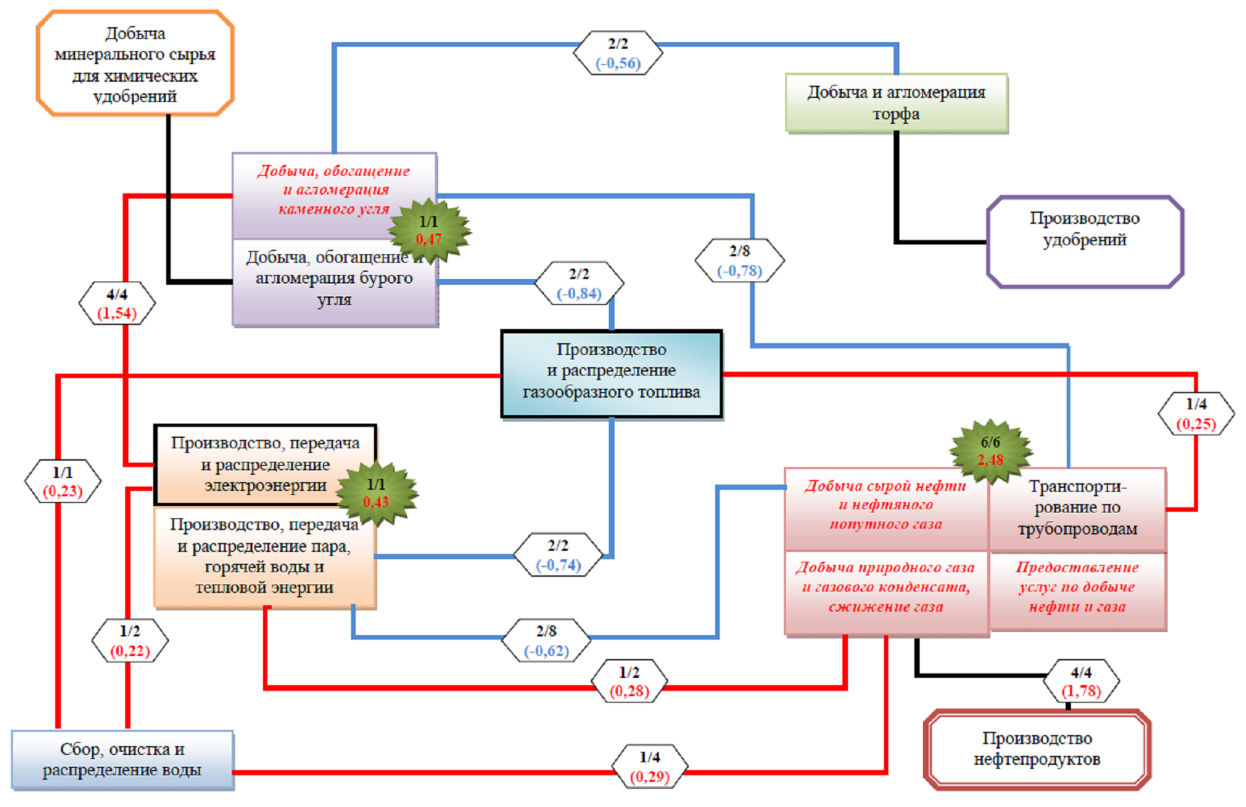
a) the relationship between
cluster-forming activities of a cluster of fuel and energy industries [35, p.
104]
b) the
relationship between cluster-forming activities of the transport cluster [36,
p. 11]
Fig.
6. Examples of clustering prospects visualization based on graph theory
Summarizing
the analysis of the research works of the third group, we note that models that
include author's calculations in the field of quality and clustering prospects
fully allow us to predict the behavior of the clustered industry, and therefore
make it possible to draw up justified forecasts of the cluster enterprises
development and adequate strategies for territorial development. At the same
time, we did not find an accessible visual display of such calculations, which
implements the function of convenient information perception.
One
of the modern practical tools for visualizing relational data is GVMap,
implemented in the Graphviz software. The GVMap tool displays clustered data in
a geographic-like maps format,
which makes it easier to read the graph of economic connectivity of industries.
Data in the form of a graph is supplied as input parameters, and information on
clustering in the data is also provided. The effectiveness of this tool is
presented and demonstrated in [37]. Based on the results of testing GVMap in
various fields of activity (services, sales, etc.), as well as on the results
of our systematization of existing methods for visualizing the relationships
between cluster entities, we determined the purpose of this study: creating a
visualization technique for identifying industrial clusters using GVMap tool. Note
that the scientific and practical significance of the author’s technique lies
in the possibility of modeling and predicting the behavior of a clustered
industry.
The author's algorithm for assessing the
prospects for clustering of domestic economy sectors is described in this part
of the work, which was implemented within GVMap environment for for computer
visualization. This algorithm allows to determine the most closely related
groups of industries at the macro level, i.e. identify industrial clusters.
The identification of industrial clusters is
based on the data of the symmetric input-output table (SIOT) for 2011 in the
context of 86 types of economic activity in Russia. The table was published
only at the beginning of 2017, since its compilation is a long and laborious
process. The next release of SIOT is planned in 2022.
SIOT reflects information on “pure”
industries, i.e. it is understood that each industry produces only its own type
of product. Moreover, the lines of the industry are reflected as producers, and
by the columns - as consumers. At the intersection of the i-th row and the j-th
column, there is information on the quantity of products of the i-th industry
(in monetary terms) spent on the production needs of the j-th industry.
Conversion of SIOT data for the distant
clusters identification is carried out according to the method proposed by S.
Zamansky (steps 1.1-1.4).
Step 1.1. Formation of matrices X and Y, whose
elements are equal:
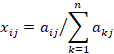
(1)
(2)
where  –
the monetary value of deliveries by industry i for a certain period of industry
j (element of the symmetric Input-Output table);
–
the monetary value of deliveries by industry i for a certain period of industry
j (element of the symmetric Input-Output table);
 -
intermediate purchases by industry j from industry i in proportion to total
purchases by industry j;
-
intermediate purchases by industry j from industry i in proportion to total
purchases by industry j;
 -
intermediate sales from industry i industry j in proportion to total industry
sales;
-
intermediate sales from industry i industry j in proportion to total industry
sales;
n – number of industries in SIOT (n=86).
Thus, we get the matrices X and Y, while the
columns of the matrix X are samples of purchases, and the columns of the matrix
Y are samples of sales of the respective industries. For any two branches l and
m, vectors xl and xm, which are columns of the matrix X,
as well as vectors yl and ym, which are columns of the
matrix Y, can be defined.
Step 1.2 Determination of the relationship
(similarity) between any pairs of industries using correlation analysis.
To determine the similarity of pairs of industries, 4 matrices
are calculated with Pearson's correlation coefficients [38]:
- Matrix XX, which elements r (xl, xm)
measure the degree of similarity of purchases samples in industries l and m;
- The matrix YY, which elements r (yl, ym)
measures the degree of similarity of sales samples in industries l and m;
- The matrix XY, which elements r (xl, ym)
reflects the similarity of purchases samples in industry l and sales samples of
industry m, i.e. how much industry l is involved in puchases from industries
for which industry m is a supplier;
- The matrix YX, which elements r (yl, xm)
reflects the similarity of purchases samples of industry m and sales samples of
industry l, i.e. the extent to which industry m participates in purchases from
industries for which industry l is a supplier.
Step 1.3 Construction of a symmetric matrix Lv.
The matrix elements are  , provided that the correlation
coefficient is significant, i.e. p-value <0.05.
, provided that the correlation
coefficient is significant, i.e. p-value <0.05.
Each column of the Lv matrix is an example of
the relationship between the industry located in the column and all other
manufacturing industries. Thus, in the Lv matrix for each industry, measures of
indirect and direct intersectoral communication are calculated.
Step 1.4 Isolation of industrial clusters using
the principal component analysis (PCA)
The columns of the Lv matrix are variables
for the principal component method. The purpose of applying this method is to
“compress” the original number of variables. Thus, the minimum number of
factors, called the main components and contributing most to the variance of
the data, is determined. The main components help structure a complex data set,
identify the most informative variables, and also allow you to switch to
uncorrelated variables.
The search for the main components is
performed in several actions:
• standardization of source data;
• obtaining eigenvectors and
eigenvalues of the covariance matrix or correlation matrix;
• sorting the eigenvalues in
descending order and choosing k eigenvectors corresponding to k largest
eigenvalues, where k is the dimension of the new functional subspace  ;
;
• constructing a projection matrix
W consisting of selected k eigenvectors;
• transforming the original data
set X through W in order to obtain the k-dimensional functional subspace Y.
The number of largest eigenvalues of
k is determined by the Kaiser criterion: eigenvalues greater
than 1 are selected. In essence, it means that if the component does not emit a
variance equivalent to at least the variance of one variable,
then it is omitted.
As a result of the first 4 steps of the
algorithm, 11 industrial clusters characteristic of the Russian economy were
identified: a metalworking cluster, a chemical industry cluster, a food
industry cluster, a mining cluster, a forestry cluster, woodworking and pulp
and paper processing, a non-ferrous and precious metal processing cluster ,
building materials cluster, light industry cluster, oil and gas industry
cluster, coal industry cluster, high technological equipment and IT.
Step 1.5 Building a matrix of “follow-up links” C.
To build links between the vertices of the
graph (edges) of the clusters, the main suppliers and buyers of industries were
calculated using the Maximum method (steps 1.5-1.7). The SIOT analysis, based
on the maximum method, is widely used to identify clusters. The mathematical
apparatus of this method was first disclosed in the work of M. Montfort and D.
Dutelli [39]. The essence of the approach proposed by the authors is to
identify value chains, while intra-industry relations are not taken into
account, i.e. the main diagonal SIOT takes on zero values.
In the table “Input-output”, the lines of
manufacturers contain information on the volumes of consumption of their
products by various industries.
The main consumer l of the industry k ( )
is determined by the formula (3):
)
is determined by the formula (3):

(3)
where  ,
,
 ,
- element of the matrix "Cost-Release" size
,
- element of the matrix "Cost-Release" size  .
.
Next, the significance of deliveries to the
main consumer is checked by comparing the share of deliveries to a given
consumer of the total supply with a certain empirically set threshold value ( ).
).
As a result, the binary matrix C (4) of the
“subsequent links” is constructed, in which the element is 1 if the
relationship between the supplier and the consumer is significant, that is:
(4)
Step 1.6 Building a matrix of "previous
links" S.
At this step, the main suppliers of
industries are determined. The construction of the binary matrix S of the
“previous links” occurs similarly to the construction of the matrix of
“subsequent links”.
The main supplier k of industry l is
determined by the formula (5):

(5)
where  ,
,
 ,
–
input-output matrix element of size .
,
–
input-output matrix element of size .
Next, the binary matrix S (6) of significant suppliers of
consumer industries is filled:
(6)
Step 1.7 Building a matrix of significant relationships
supplier-consumer CS:

(7)
As a result, some elements of the CS matrix
will be equal to 2, which indicates a significant relationship both in purchases
and in supply.
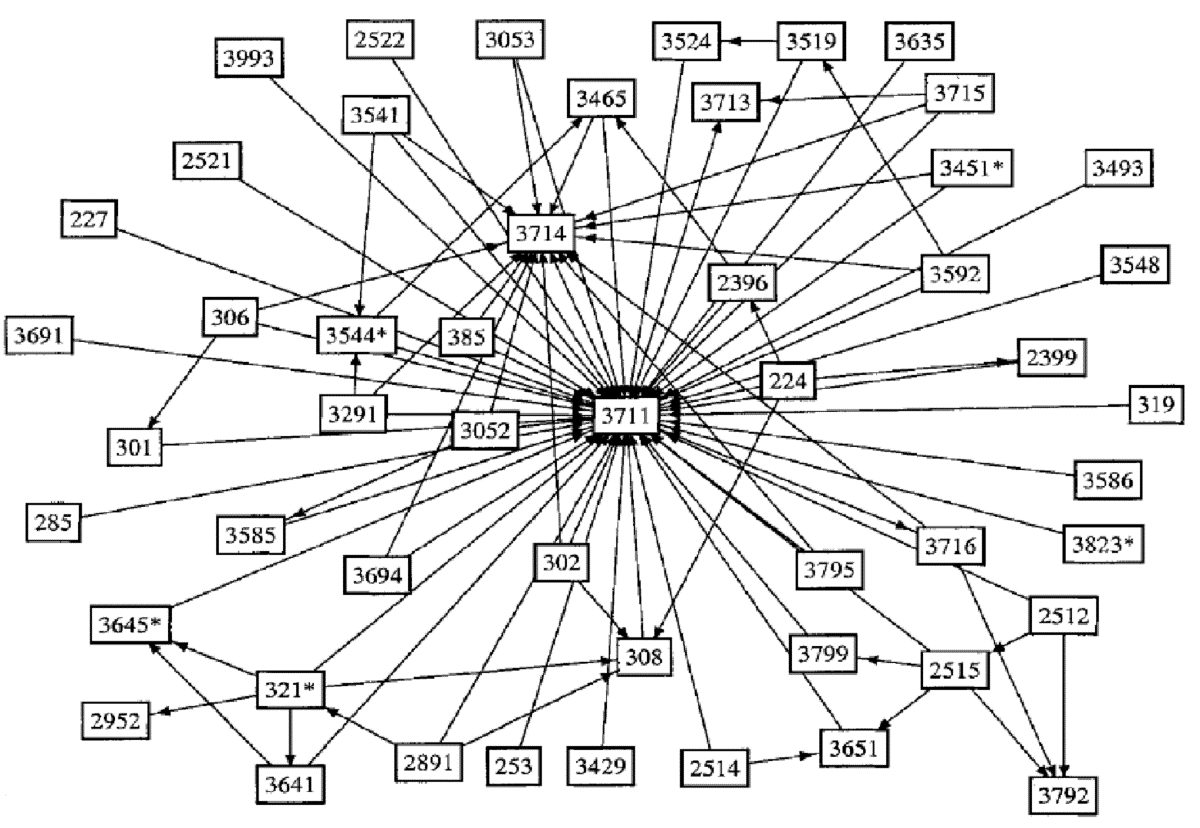
To automate the process of identification of
industrial clusters and their visualization, a software tool was created in.
The visualization of
industrial clusters was performed using the GVMap tool, which converts a graph
into a map in a geographical style with clusters highlighted in the form of
countries (fig. 7).
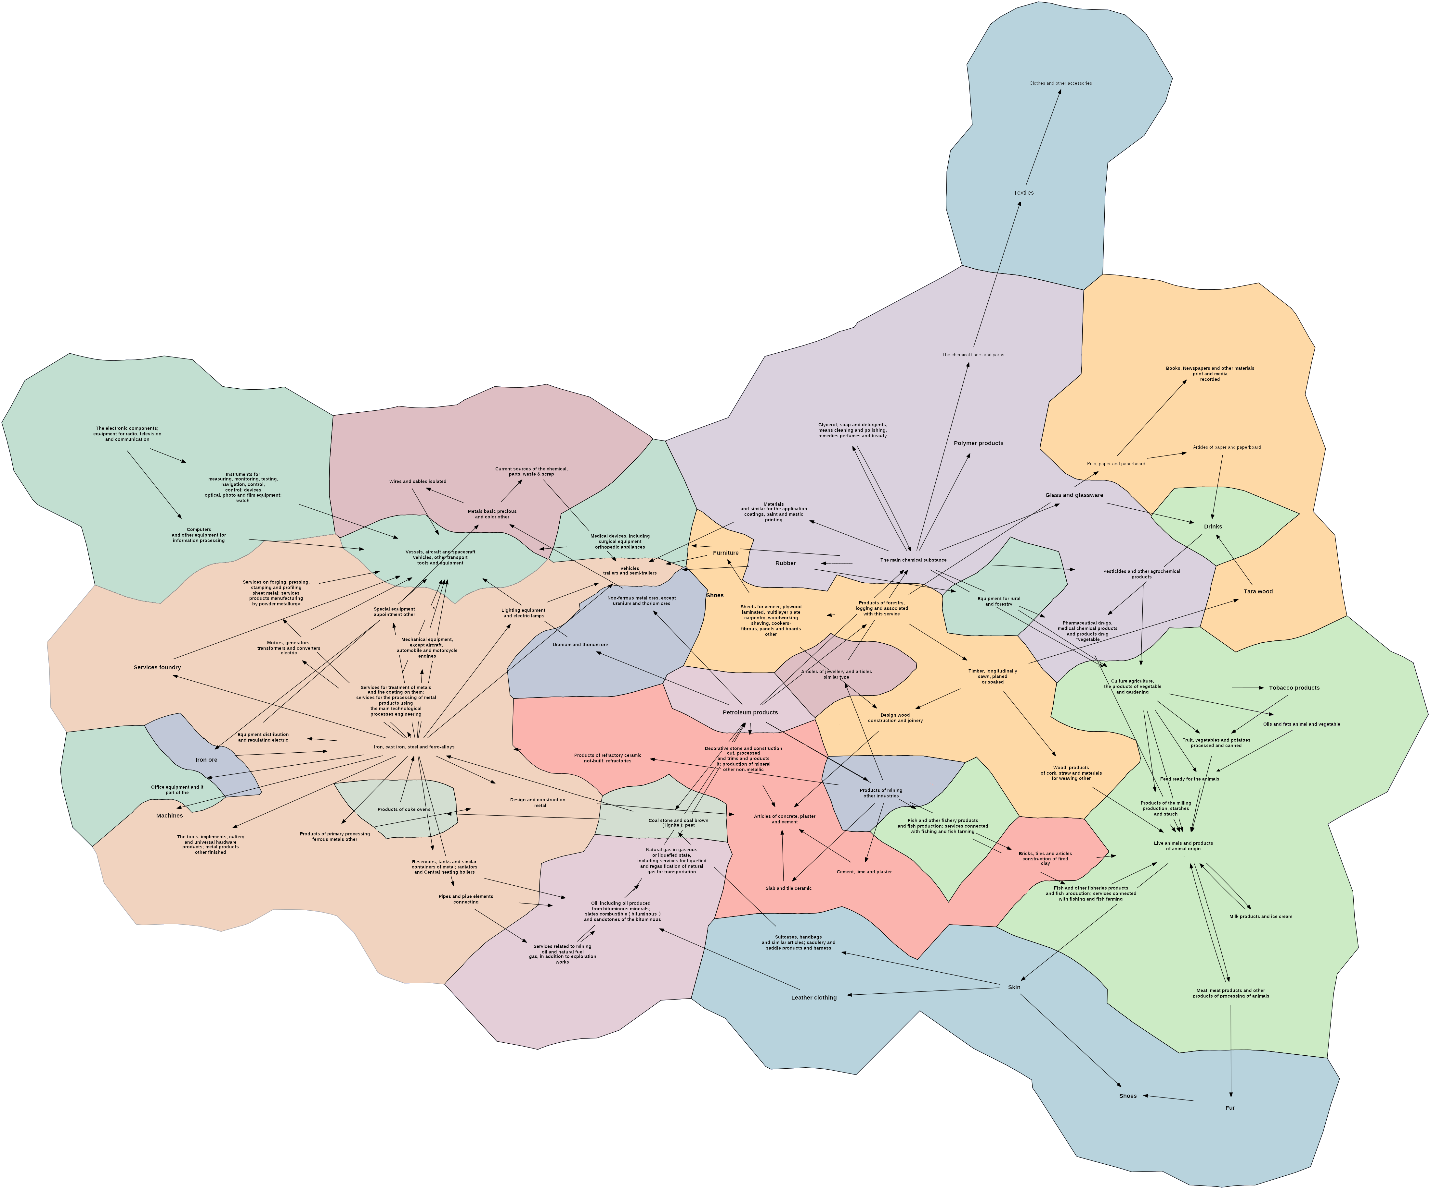
Fig. 7.
Visualization of industrial clusters using GMap
In our case, the vertices of the graph are
the types of economic activity, the relationships between the vertices of the
graph (edges) are built on the basis of the matrix of significant
supplier-consumer relationships obtained by the Maximum method (steps 1.5-1.7).
Industrial clusters are determined using the method proposed by S. Zamansky
(steps 1.1-1.4).
The constructed graph map contains aggregated
information about the connections between the Russian industries. You can
determine the groups of interconnected industries by color, and you can track
value chains by the direction of the edges.
The graph
contains 82 vertices and 129 edges. All vertices have at least one connection
with a neighboring vertex. The largest number of neighbors have such peaks as:
“Iron, cast iron, steel and ferroalloys” - 20 neighbors, “Ships, aircraft and
spacecraft, other vehicles and equipment” - 12 neighbors, “Live animals and animal
products” - 13 neighbors.
Consider several
"countries" on the map in more detail.
In the southeast
lies the industrial cluster of the food industry (light green color), the
center of which is the type of activity “Live animals and animal products”,
which is associated with almost all types of activity in the cluster (Fig. 8).
Note that the map can not only trace value chains, but also identify potential
industries - suppliers / consumers of the industry we are interested in, and
not only in the "related" industry. So, for example, to search for
suppliers to enterprises producing crops, you should pay attention to the
chemical industry. If, for example, the beverage company needs to expand the
list of consumers, then the map can determine that the potential buyers of
their products are chemical industries.
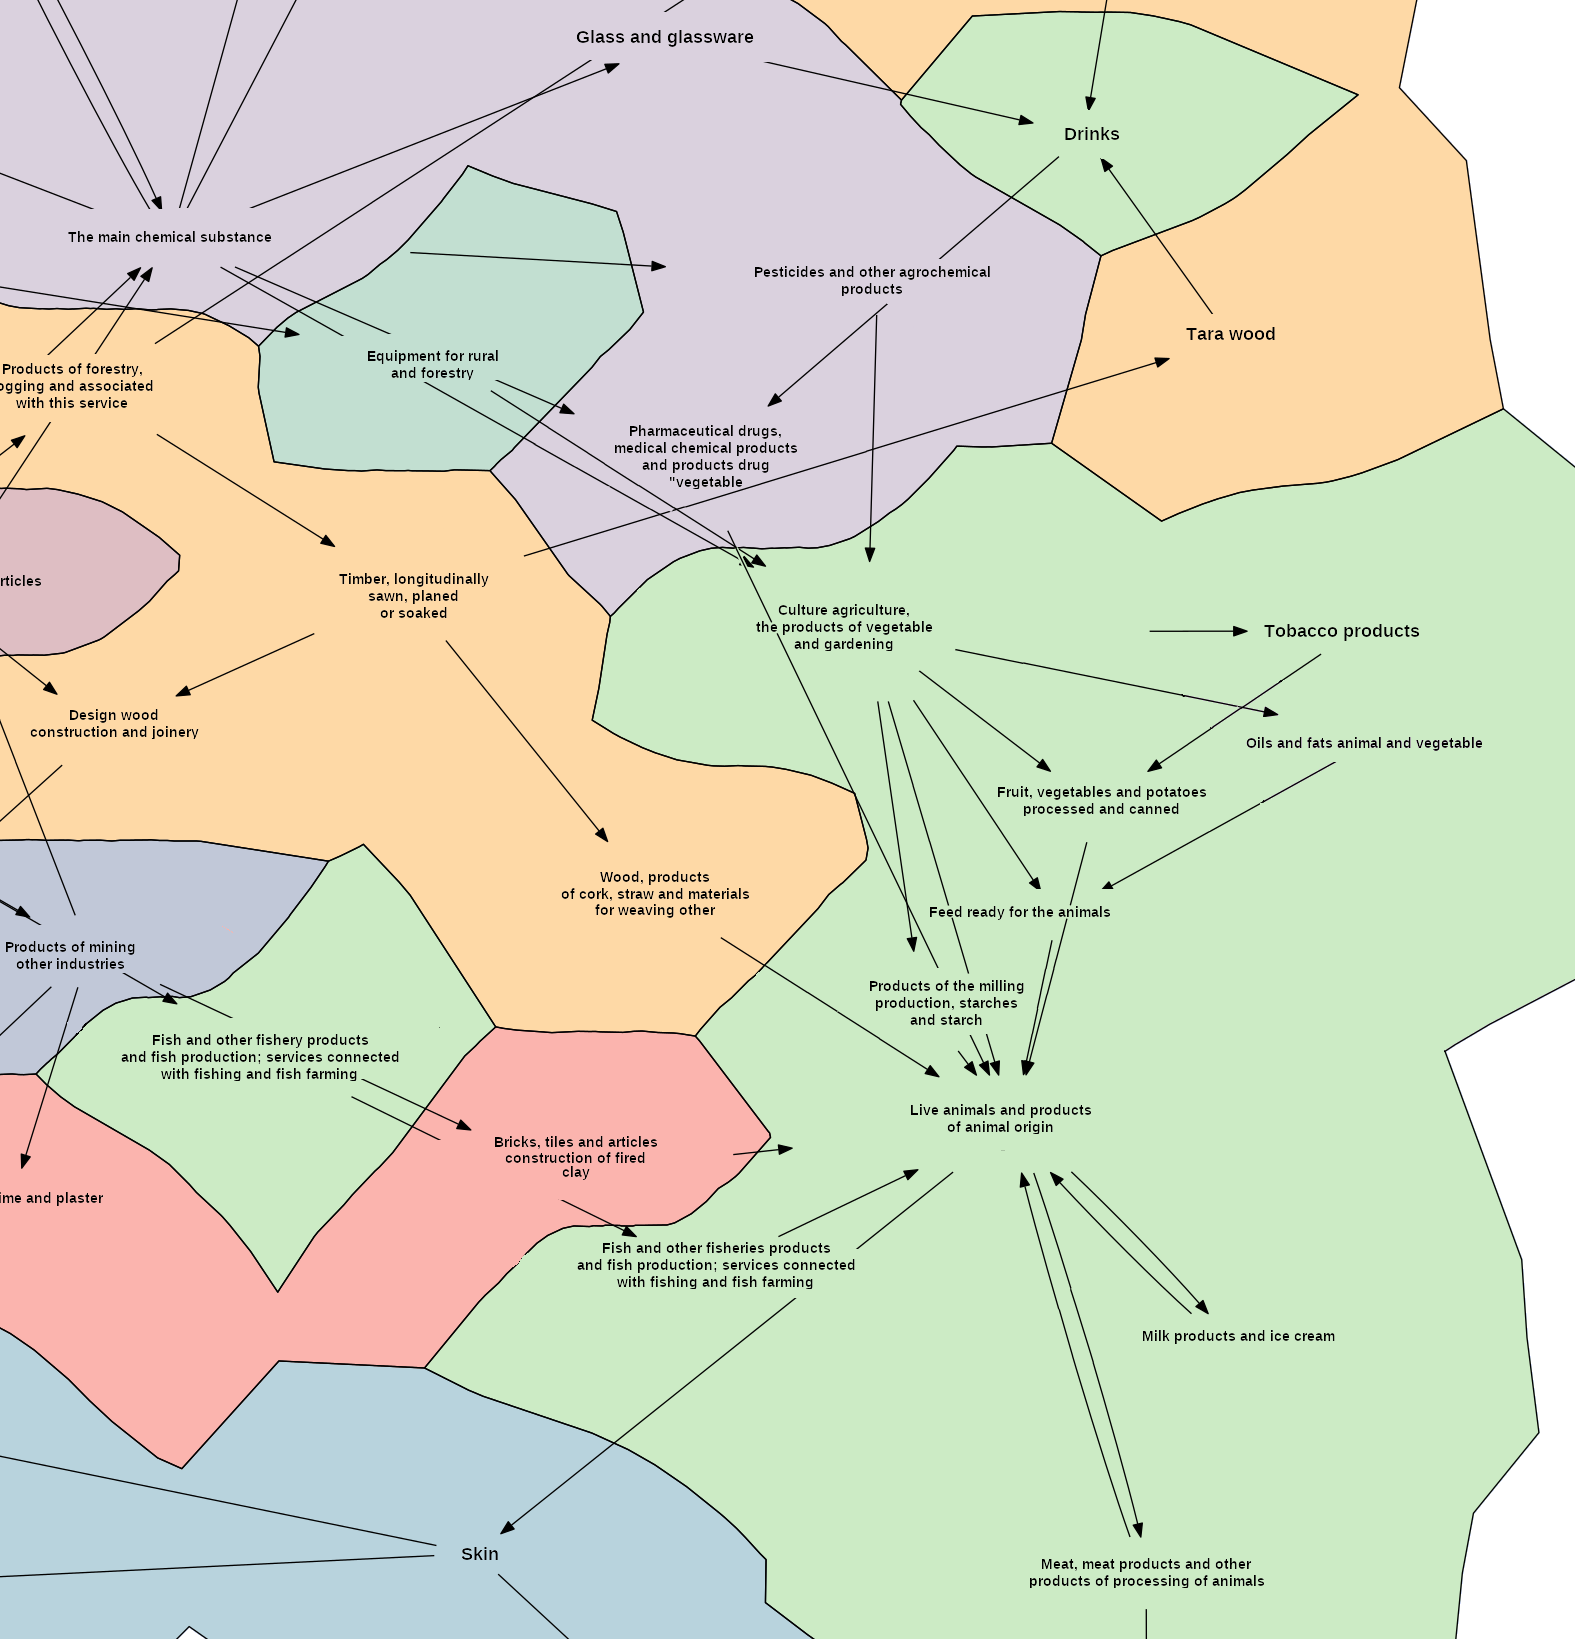
Fig.
8. The food industry cluster
In the south of
the map there is a part of the light industry cluster (blue color). The map
shows that the manufacturers of this cluster supply most of their products to
coal enterprises and the oil and gas industry. This is because overalls used by
enterprises in these industries are made of leather. In turn, the food industry
is the main supplier of light industry (Fig. 9).
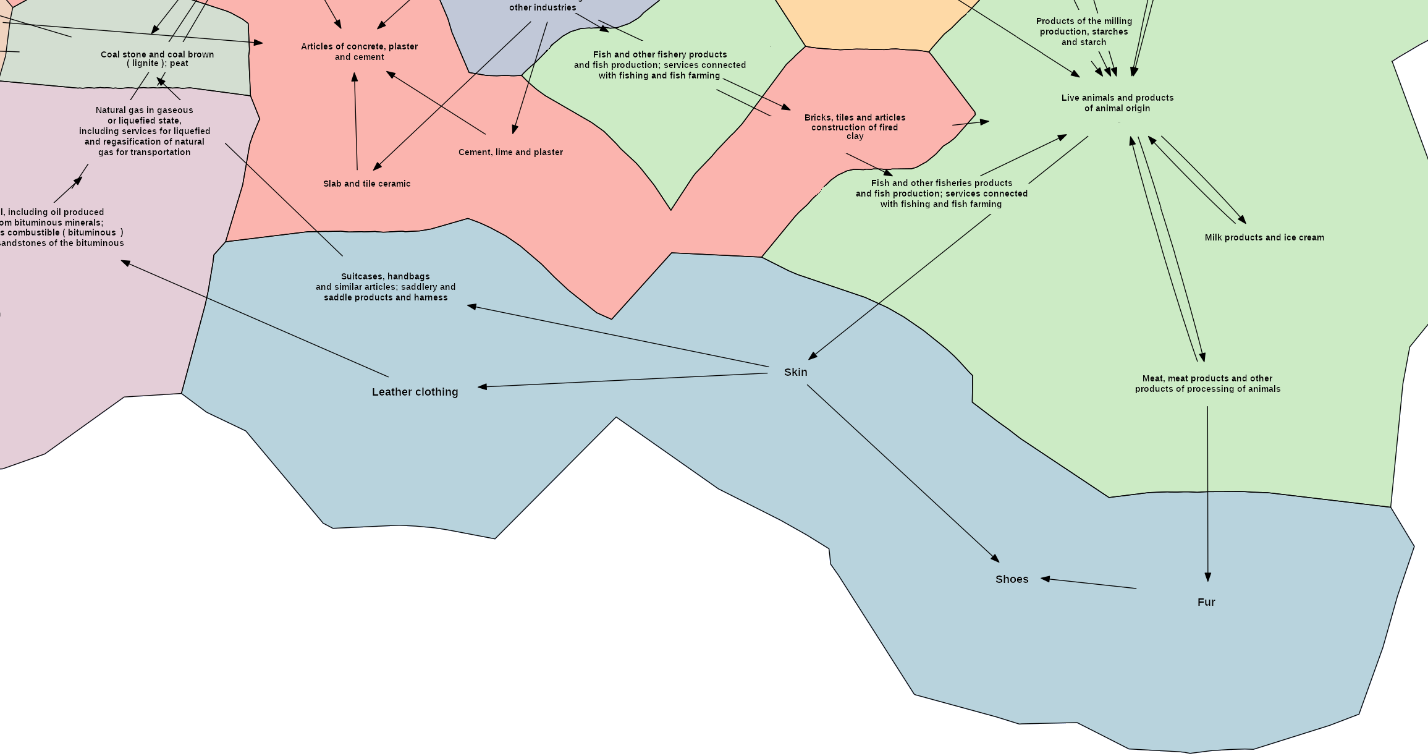
Fig.
9. Cluster of light industry
Thus, the map of
industrial clusters constructed using the GVMap tool can be useful in strategic
planning of the development of all levels of the economy: macro level
(country), meso level (region), micro level (enterprise).
The paper presents a computer visualization technique for identifying
industrial clusters using the GVMap tool. The methodology was based on the
experience of testing GVMap in various fields of activity, as well as the
results of the systematization of existing methods for visualizing the
relationships between the subjects of the cluster.
The basis of visualization is the author's mathematical algorithm for
identifying industrial clusters, compiled using the maximum method, S. Zamanski
method and graph theory.
The advantages of the proposed visualization method are as follows. Firstly,
the results of the clusters identification fully allow prediction of the
behavior of the clustered industry, and therefore make it possible to make both
reasonable forecasts for the development of cluster enterprises and adequate
strategies for territorial development. Secondly, the visual display of
simulation results on a geographic-like maps image allows you to reflect all
types of economic activity and the relationship between them in an easily
readable format.
The described approach to the identification and visualization of
industrial clusters was the basis for the creation of a software tool (web
application) "Interregional Clusters of Russia", designed for the
automated collection of statistical data from Internet sources and
identification of inter-regional clusters based on them.
1. Ofitsial'nyy sayt Pravitel'stva Rossii.
Obshchiye voprosy promyshlennoy politiki: nekotoryye vazhnyye resheniya i fakty
za 6 let. [The official website of the Government of Russia. General issues of
industrial policy: some important decisions and facts for 6 years]. (http://government.ru/info/32124/) [in
Russian]
2. Karta klasterov RF [Map of clusters of the
Russian Federation]. (https://cluster.hse.ru/mirror/pubs/share/22903938) [in
Russian]
3. Andersson T., Serger S.S., Sorvik
J., Wise Hannsson E. The cluster policies whitebook. IKED: Malmo, 2004.
4. Feser E.J. Old and new theories
of industry clusters. From the Selected Works of E.J. Feser, 1998
(https://works.bepress.com/edwardfeser/3/)
5. Ketels Ch., Lindqvist G.,
Sölvell Ö. Strengthening clusters and competitiveness in Europe. The
role of cluster organizations. (http://gosbook.ru/node/84334)
6. Sölvell Ö. Clusters.
Balancing evolutionary and constructive forces. Second edition. Stock-holm:
Ivory Tower Publ., 2009. 140 p.
7. Sölvell Ö., Lindqvist
G., Ketels Ch. The cluster initiative greenbook. Stockholm: Ivory Tower Publ.,
2003. 93 p.
8. Menshenina I.G., Kapustina L.M.
Klasteroobrazovaniye v regional'noy ekonomike: monogr. [Clustering in the
regional economy: monograph.] Ekaterinburg: Publishing House Ural. state econ
University, 2008. 154 p. [in
Russian]
9. Effektivnost' deyatel'nosti predpriyatiy v
usloviyakh klasterizatsii v regionakh RF: monografiya [The effectiveness of
enterprises in the conditions of clustering in the regions of the Russian
Federation: monograph]/ I.I. Bogachev, T.F. Kreydenko, I.A. Rodionova; pod red.
prof. I.A. Rodionovoy. - M .: University book, 2016 - 238 p. [in Russian]
10. Battalova A.A. Otsenka investitsionnoy
klasterizatsii otrasli [Assessment of industry clustering potential] //
Internet-journal "SCIENCE", № 6, 2013, pp. 1-8. [in Russian]
11. Klasternyye politiki i klasternyye signaly:
teoriya, metodologiya, praktika. [Cluster policies and cluster initiatives:
theory, methodology, practice] / under. ed. Yu.S. Artamonova, B.B. Khrustaleva.
Penza: IP Tugushev S.Yu., 2013. 230 p. [in Russian]
12. Kaplina A.V. Analiz modeley formirovaniya
klasternykh struktur v sisteme regional'noy ekonomiki [Analysis of the models
of the formation of cluster structures in the system of the regional economy:
the managerial aspect] // Economic Sciences, № 5 (114), 2014, pp. 57-62. [in Russian]
13. Kudryavtseva T.YU. Teoriya, metodologiya i
instrumentariy formirovaniya klasternoy promyshlennoy politiki [Theory,
methodology and tools for the formation of a cluster industrial policy],
Sankt-Peterburg: Thesis for the
degree of Doctor of Economic Sciences, 2018. [in Russian]
14. Abashkin V.L., Boyarov A.D., Kutsenko Ye.S.
Klasternaya politika v Rossii: ot teorii k praktike [Cluster policy in Russia:
from theory to practice] // Forsyth, Vol. 6, no. 3, 2012, pp. 16–27. [in Russian]
15. Kutsenko Y.S., Abashkin V.L., Fiyaksel E.A.,
Islankina Y.A. Desyat' let klasternoy politiki v Rossii: logika vedomstvennykh
podkhodov [Ten years of cluster policy in Russia: the logic of departmental
approaches] // Innovations, No. 12 (230), 2017, pp. 46-58. [in Russian]
16. Akinfeyeva Y.V. Formirovaniye i razvitiye
vklyuchayut klasterov. [Formation and development of regional clusters].
(http://riep.ru/upload/iblock/103/ 103a3a3fa5e5a0dca75838b37af5a83d.pdf) [in Russian]
17. Pilotnyye innovatsionnyye territorial'nyye
klastery v Rossiyskoy Federatsii [Pilot innovative territorial clusters in the
Russian Federation] / ed. L.M. Gokhberg, A.E. Shadrina. M .: Izd. HSE House,
2013. 110 p. [in Russian]
18. Prokhorova V.V., Khachaturova M.S. Funktsii i
instrumenty razvitiya klasterov v regional'noy ekonomike sovremennoy Rossii:
monogr. [Functions and tools for the development of clusters in the regional
economy of modern Russia: monograph] Maykop, 2015. 144 p. [in Russian]
19. Stanovleniye innovatsionnykh klasterov v
Rossii: itogi pervykh let podderzhki []The formation of innovation clusters in
Russia: the results of the first years of support] / I.M. Bortnik, S.P.
Zemtsov, O.V. Ivanova [et al.] // Innovations, No. 7 (201), 2015, pp. 26-36. [in Russian]
20. Markov L.S. Teoretiko-metodologicheskiye
osnovy klasternogo podkhoda: monogr. [Theoretical and methodological
foundations of the cluster approach: monograph] / IEPP SB RAS. Novosibirsk,
2015. 300 p. [in Russian]
21. Otsenka effektivnosti klasternogo
prostranstvennogo razvi-tiya regionov: teoretiko-metodologicheskiy podkhod:
monografiya [Assessment of the effectiveness of cluster spatial development of
regions: a theoretical and methodological approach: a monograph] / T. Yu.
Kovaleva, E. V. Bazueva, E. D. Oborina, P. A. Sukhanova; under total ed. T. Yu.
Kovaleva; Perm. state nat researches un-t - Perm, 2017. - 280 p. [in Russian]
22. Mirolyubova T.V., Karlina T.V., Kovaleva T.Y.
Zakonomernosti i faktory formirovaniya i razvitiya vydelennykh klasterov:
monogr. [Patterns and factors of formation and development of regional
clusters: monograph] / Perm. state nat researches un-t Perm, 2013. 283 p. [in Russian]
23. Krugman P. Increasing
returns and Economic Geography // Journal of Political Economy, No. 99, 1991,
pp. 483–499.
24. Ellison G., Glaeser E.L.
Geographic concentration in U.S. manufacturing industries: a dartboard approach
// Journal of Political Economy, No. 105, 1997, pp. 889–927.
25. Maurel F., Sedillot B. A
measure of the geographic concentration in french manufacturing industries //
Regional Science and Urban Economics, Vol. 29, 1999, pp. 575–604.
26. Duranton G., Overman H.
Testing for localization using micro-geographic data // Review of Economic,
Studies 72, 2005, pp. 1077–1106.
27. Held J.R. Clusters as an
economic development tool: beyond the pitfalls // Economic Development Quarterly,
No. 10, 1996, pp. 249–261.
28. Crawley A., Beynon M.,
Munday M. Making location quotients more relevant as a policy aid in regional
spatial analysis // Urban Studies, No. 50, 2013, pp. 1854–1869.
29. Isaksen A. Towards
increased regional specialization? The quantitative importance of new
industrial spaces in Norway, 1970–1990 // Norsk Geografisk Tidsskrift, No. 50,
1996, pp. 113–123.
30. Braunerhjelm P., Carlsson
B. Industry Clusters in Ohio and Sweden, 1975–1995 // Small Business Economics,
No. 12, 1999, pp. 297–290.
31. Sternberg R., Litzenberger
T. Regional clusters in Germany: their geography and their relevance for
entrepreneurial activities // European Planning Studies. No. 12, 2004, pp.
767–792.
32. Brenner T. An
Identification of Local Industrial Clusters in Germany // Regional Studies, No.
40(9), 2006, pp. 1–14.
33. Porter M. Location,
Competition, and Economic Development: Local Clusters in a Global
Economy//Economic Development Quarterly, No. 14(1), 2000, pp. 15–34.
34. Bergman E., Feser E.
Industrial and Regional Clusters: Concepts and Comparative Applications.
Virginia: WVU Regional Research Institute, 1999.
35. Markov L.S., Markova V.M. Vyyavleniye
etalonnykh klasterov: metodicheskiye voprosy i prakticheskoye prilozheniye k
otechestvennoy promyshlennosti [Identification of reference clusters:
methodological issues and practical application to the domestic industry] //
Bulletin of the NSU. Socio-economic sciences, vol. 12, no. 1, 2012, pp. 95–108. [in Russian]
36. Bergman Ed.M., Feser Ed.J.
National Industry Cluster Templates: A Framework for Applied Regional Cluster
Analysis // Regional Studies. Carfax Publishing. Vol. 34, № 1, 2000, pp. 1–19.
37. Gansner E., Hu Y.,
Kobourov S. GMap: Visualizing Graphs and Clusters as Maps. (http://citeseerx.ist.psu.edu/viewdoc/download?doi=10.1.1.154.8753&rep=rep1&type=pdf)
38. Czamanski S., Ablas, L. A.
Identification of industrial clusters and complexes: a comparison of methods
and findings // Urban Studies, № 16, 1979, pp 61-80.
39.
Montfort, M. J., Dutailly, J. C. Les filieres de production // INSEE Archives
et Documents, 1983, pp. 1–193.
