When studying dynamic processes in plasma, gases,
liquids and multiphase media with panoramic methods based on modern digital
cameras, problems arise due to the presence of large arrays of digital data
which carry useful information about the physical processes being studied. With
the constant improvement of digital equipment, the amount of information
received by the researcher also increases. In each experiment, tens of
thousands of new images can be obtained that are of interest to researchers and
the scientific community, provided that they are analyzed and interpreted
correctly from a physical point of view. This leads to new tasks related to the
storing, systematization, processing, analysis, and presentation of the results
of a visual experiment.
A large amount of information and the development of
technologies for storing and transmitting it has contributed to the
introduction of machine learning into the analysis and processing. However,
when getting new knowledge about the object of research in unique experimental
conditions, the connection of machine learning is still problematic [1]. This
is especially true for problems for which a numerical solution is not yet
available, and it is difficult to obtain the initial synthesized data necessary
for training. In addition, machine learning is still quite resource-intensive
for general use and does not always produce better results than classical
methods of analyzing visualized data.
The development of a new generation of thermal imaging
technology made it possible to register two-dimensional thermal fields in
dynamics with high spatial and temporal resolution. In this paper, we consider
some results obtained with medium-wave infrared (IR) shootings using data
processing programs.
Thermography is widely used for the study of
heat flows from the surfaces of solids [2, 3] and in hydrodynamics [4, 5].
Another application of thermography is the registration of thermal fields on
the surface of a liquid [6 – 9]. Water absorbs medium-wave IR radiation in a
thin submillimeter layer, this effect allows you to visualize structures on the
surface of the liquid. In the literature, there are mainly works devoted to
slow flows with small Reynolds numbers or stationary flows. For the study of
liquid media, infrared thermography is often used simultaneously with other
imaging methods, such as PIV or tomography [10].
In [11], the structure of a free liquid jet
falling on a metal plate was analyzed using IR thermography and digital
anemometry based on particle images. The combined use of medium-wave and
near-infrared thermography [12] is used for the study of liquid films. In these
works, thermographic data reflect the properties of the flow at the gas-liquid
interface, or the result of the influence of the submerged flow.
Thermal imagers have proven their
effectiveness in analyzing the dynamics of complex non-isothermal flows due to
the possibility of high-speed shooting – the registration frequency can reach
several kHz depending on the spatial resolution. Modern devices have high
sensitivity (up to 20 MK) [13], which is successfully used for studying heat
transfer, in particular, caused by turbulent flow.
Previously, a method for thermography of
high-speed flows was proposed [14]. As a result of its application to the study
of a number of model jet flows, large experimental data amounts were obtained.
The method involves thermal imaging registration through the IR-transparent
wall of the reservoir from the boundary layer of the liquid. In this case, the
flow movement indicator is a turbulent vortex structure with different
temperatures. The quantitative data obtained by the proposed method for turbulent
boundary layers of jet flows can be used, in particular, for numerical
calculations when verifying the results of numerical simulation of turbulent
flows [15].
Most currently used thermal imagers
operate in the medium-wave (3 - 5 microns) and long - wave (8-14 microns)
spectral bands. In this work, a FLIR SC7700 thermal imaging camera operating in
the medium-wave IR range of 3.7-4.8 microns was used for panoramic registration
of dynamic thermal fields. This device has a high temperature sensitivity
(NETD) of up to 20 MK. For full-frame mode (640x512 pixels), the maximum
shooting frequency is 115 Hz and with limited resolution is to 400 Hz. The
spatial resolution for the described experiments is 0.08 - 0.15 mm / pixel.
Increasing the volume of obtained results
has led to a new problem – the problem of a rational approach to the
registration, processing and storage of visualization data arrays. For the
thermal imager shooting with a duration of
t = 1 s at a frequency of
f = 295 Hz and a spatial resolution of 348x344 pixels takes 60 MB. The choice
of a short time interval for registration is only possible for the study of
stationary flows. When analyzing non-stationary flows, a long-term survey is
required to ensure continuous recording of the non-stationary phase of the
process. Thermal imaging “film” with a duration of
t = 600 s at
f = 100 Hz and a maximum resolution of 640x512 pixels takes up about 40 GB.
This paper demonstrates the use of infrared thermography
for the study of two dynamic processes of different types in different time and
space ranges: turbulent jet flow of a liquid and the passage of a shock wave in
a gas.
The study of non-isothermal
mixing of a liquid on the surface of an IR-transparent wall allows us to study
the hydrodynamic structure of the flow based on the obtained data on thermal
pulsations in the near-surface region of an impact submerged jet. When a shock
wave passes through the channel, a thermal response is registered on the solid
wall of the gas-dynamic stand. Both tasks are connected with panoramic
registration of the flow field and obtaining, processing, and analyzing a large
amount of visual information. Initial processing was performed using FLIR
Altair software. Then, in accordance with the given task, approaches for
quantitative analysis of data sets were chosen.
Most experimental studies on the heat exchange of jets
with a solid wall are based on the registration of the thermal field of the
wall itself. Measurements in the medium face limitations of the method, such as
the finite thickness of the laser knife, or its use near the wall in the
presence of large gradients. Infrared thermography allows you to visualize
directly the wall layer of turbulent fluid flow through an IR-transparent
window.
In this paper experiments were performed for nozzles D =
1-4 mm, flow rates
vjet
= 0.7-10 m/s and Reynolds numbers
Rejet
= 5000-35000, calculated for values at the exit of the nozzle. The distance
from the nozzle section to the impact surface varied
H/D
= 1-6. Registration
was conducted through an IR-transparent window with a thickness of 2 mm made of
calcium fluoride with a transmission capacity of more than 90%.
It is known that in the wall area of the impact jet,
three characteristic flow areas can be distinguished: the area of flow
inhibition, the wall area of flow and the area of flow separation.
Post-processing of thermographic films allows us to identify patterns in the
dynamics of parameters in certain flow zones.
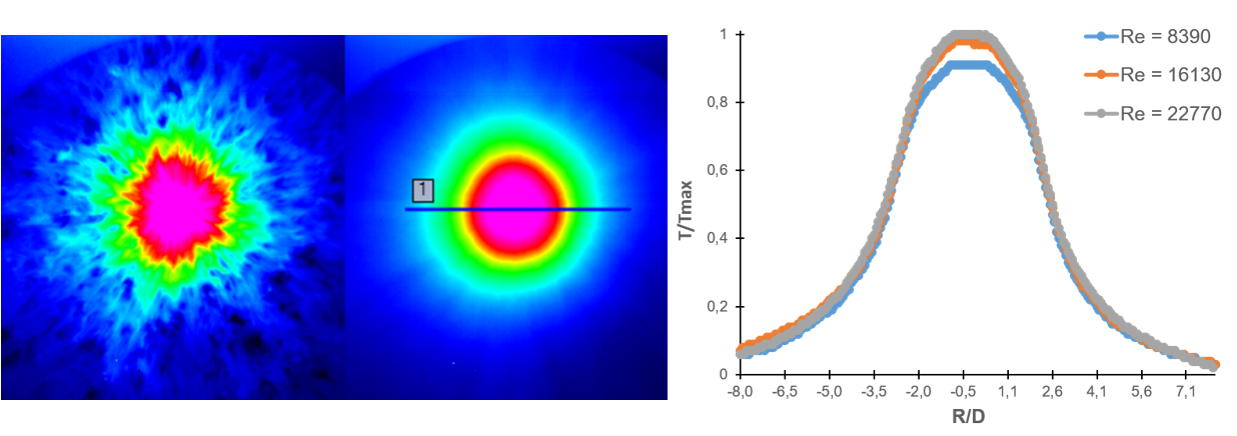
Fig. 1. (from left to right) instantaneous thermogram, averaged
thermogram (N = 256 frames) and temperature profiles along line 1 for different
flow rates for
H/D
= 2.
The stationary component of the non-isothermal flow near
the impact surface is visualized using averaged thermograms and temperature
profiles. In the area of flow deceleration, the normal velocity to the collision
surface reaches zero, the temperature profile reaches a plateau. The shape of
the profile depends on the diameter of the nozzle and the distance from the
nozzle to the impact surface, and the height depends on the Reynolds number
(Fig. 1). In the area of flow deceleration, temperature pulsations are practically
not observed (point 1 in Fig. 2).
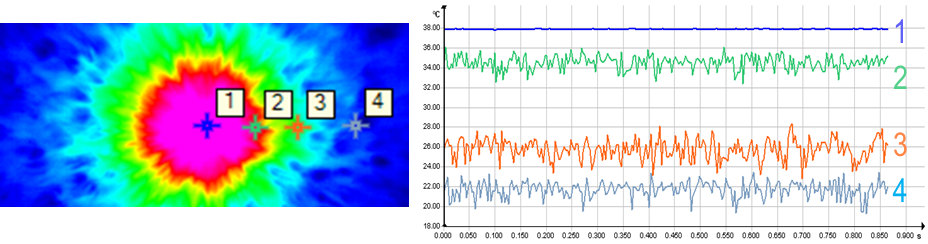
Fig. 2. An example of a thermogram and a time base of the
temperature at four different distances from the stagnation point:
R/D
=
0.2, 1.5, 3 and 5.
However, when analyzing turbulent flows, the analysis of
instantaneous images, for example, the calculation of frequency characteristics
of pulsations, is of particular interest. Averaged thermal imaging data can
also be obtained using other experimental methods, for example, when
registering the flow through a thin foil [13, 16]. Instantaneous and average
velocity and temperature fields in the wall region of an axisymmetric turbulent
jet were measured using PIV and PLIF methods [17, 18]. It is shown, in
particular, that by varying the frequency of external excitation of the jet, it
is possible to regulate the intensity of turbulent transport in the area where
the jet flows on the wall.
The transition region of the impact jet flow is studied
on the basis of registration of non-stationary fields of liquid temperature
pulsations. Figure 2 shows an example of a time base of temperature ripples at
four different distances (R) from the stagnation point. The observed
temperature fluctuations are compared to the mixing process of liquid
isothermal elements, since the characteristic times of turbulent mixing are
much less than the times of thermal conductivity and natural convection.
The structures in the wall flow are visualized (Fig. 3),
obtained by subtracting the average frame: their shape and location in the
transition region can give information about the vortex mixing of the wall
layer. The size and shape of the structures depend on the parameters of the
circular jet flow: The Reynolds number
Rejet
and the relative
distance from the nozzle slice to the impact surface H/D [19].
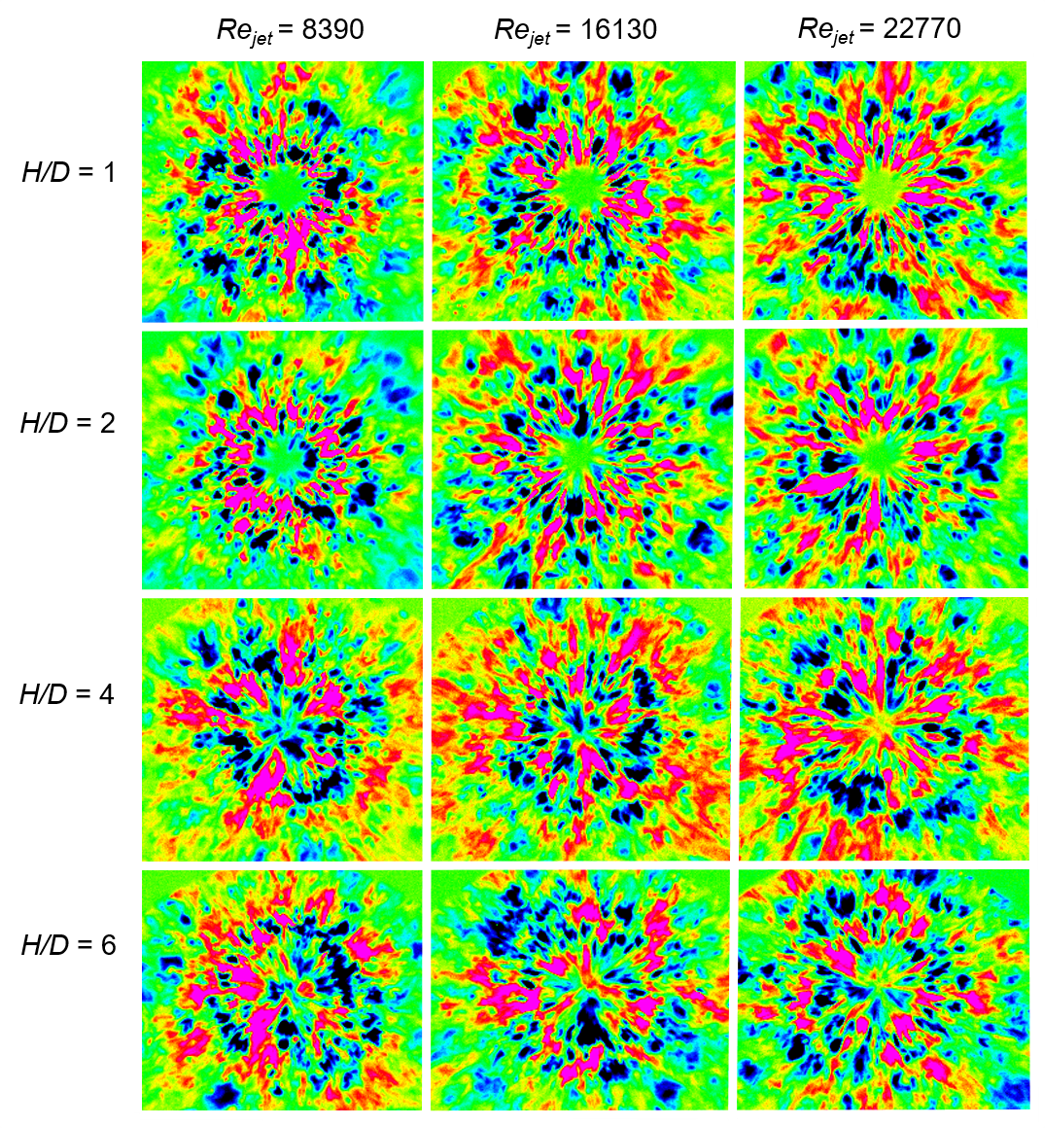
Fig. 3. Instantaneous thermograms of the wall area of the impact jet
obtained by subtracting the average frame for
Rejet
= 8390, 16130, 22770 and
H/D
= 1, 2, 4, 6.
The calculation of mean-square pulsations of intensity
[20] in the boundary layer of the liquid was also performed, and the values of
the radius of maximum pulsations were obtained.
Processing of the received arrays of visual data is
performed by constructing thermal ripple spectra of the turbulent boundary
layer of the liquid. At the selected points of the flow, time scans of
temperature pulsations are registered, which are used to construct energy
spectra in the frequency range from 1 to 150 Hz. By their shape and comparison
with known turbulence models, we can speak about the features of flow regions
and laminar-turbulent transition. Examples of energy spectra in characteristic
areas of the impact jet flow (D
= 3 mm,
H/D
= 3,
vjet
= 2.4 m/s,
Rejet
= 7700) are presented in figure 4.
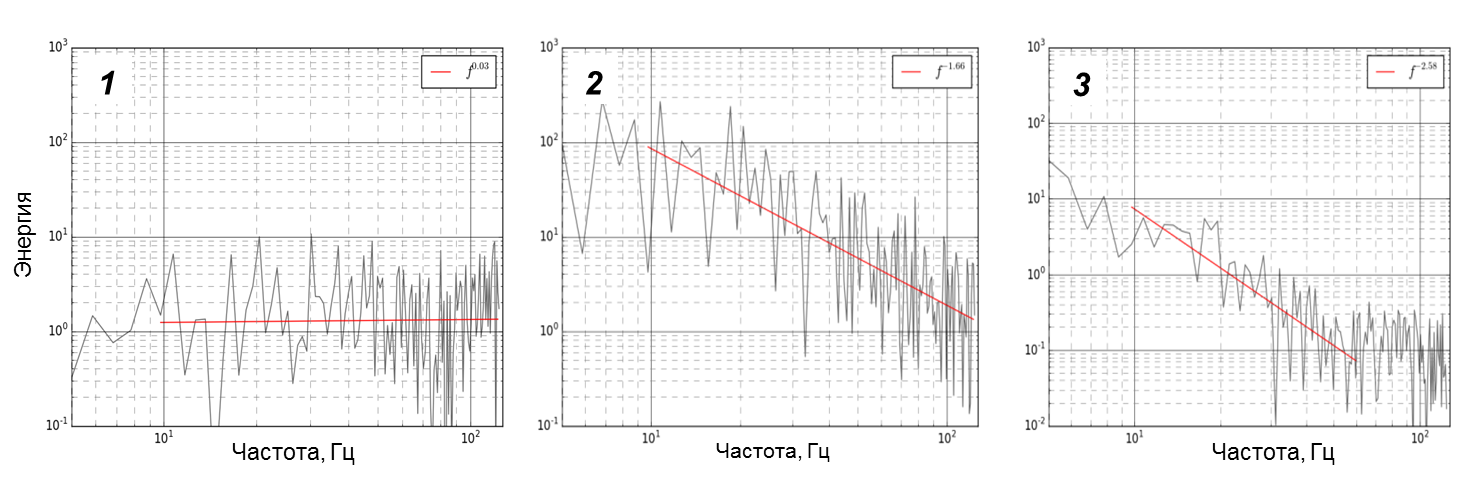
Fig.
4. Typical energy spectra of temperature pulsations at three selected flow
points at different distances from the flow stagnation point: 1 -
R/D
~ 0; 2 -
R/D
~ 4; 3 -
R/D
~ 8.
The criterion for
analyzing energy spectra in this study is their slope calculated using the
least squares method. When the flow propagates from the stagnation point in the
radial direction, the wall flow is affected by vortex structures of different
scales from the outside, changing the turbulent properties of the flow in the
visualized area. An example of 3D visualization of the spectrum slope map is
shown in Fig. 5. The color corresponds to the value of slope, and in general
the surface has a bell-shaped form. At a distance of 3-6 relative diameters
from the impact site, it becomes possible to distinguish a section that is
comparable to the classical power law of Kolmogorov "-5/3" and
corresponds to the appearance of an inertial interval [21].
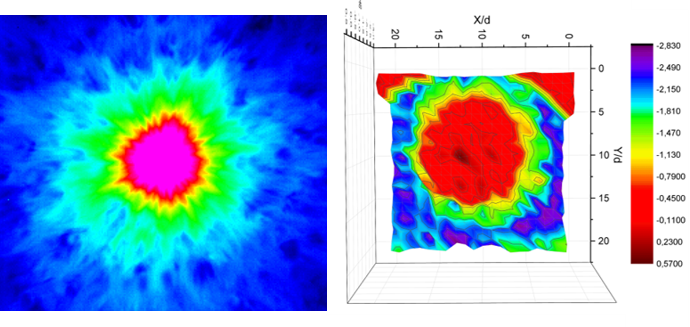
Fig.
5. Power slope map of the near-wall region of the impact submerged jet (on the right)
for the 10*10 R/D region (presented on the left).
Another method of
post-processing of thermographic data arrays is tracing with heat points, which
is considered in [22]. Velocity fields of turbulent non-isothermal fluid flows
are obtained using cross-correlation algorithms.
Preliminary
analysis of typical process times and spatial scales is necessary to optimize
the survey parameters. Choosing the time of registration, frequency of
shooting, spatial resolution, as well as the method of processing results in
accordance with the task statement and the specific area of flow will lead to a
rational use of resources. Based on the results of the analysis of experimental
data, the process of post-processing can be represented as a diagram (Fig. 6).
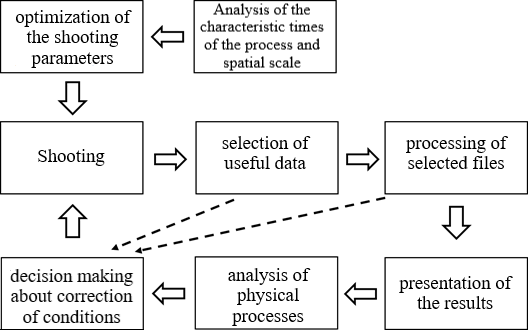
Fig. 6. Scheme of working with experimental
data.
In this problem, thermal imaging was used to study
changes in heat flows from the wall of a rectangular channel of a shock tube
with a cross-section of 24x48 mm2; the dynamics of heating of the
side and end walls of the channel after the passage of a shock wave was
obtained.
The optical axis of the IR registration was directed
perpendicular to the main axis of the shock tube (Fig. 7); radiation was
recorded from the regions of the vertical copper wall of the tube 24 mm high
and 2 mm thick in the section of the low-pressure chamber. The dynamics of
heating of the outer wall due to thermal conductivity after the passage of a
shock wave in the channel was studied. The flow temperature in the channel
behind the shock wave was determined based on the Rankine – Hugoniot conditions
[23].
By varying the materials of the diaphragm, as well as
the initial pressures in the high and low pressure chambers, a wide range of
Mach numbers in the shock tube is achieved. The duration of the passage of the
shock-heated flow beside the registration area was 300-400
µs,
after which the
contact surface and the rarefaction wave passed.
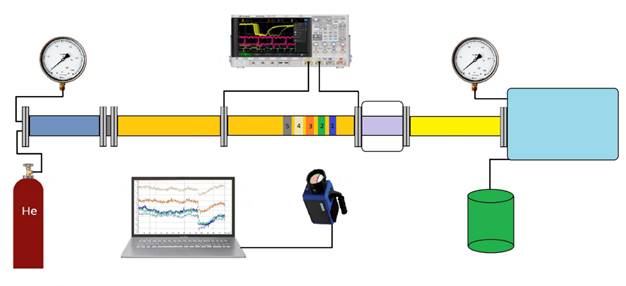
Fig. 7.
Experimental installation for a gas-dynamic stand.
The thermal imager
registered radiation from 5 survey areas, which were materials with different
thermal conductivity and emissivity deposited on the side surface of the pipe.
Coatings: 1 - layer blackened with matte aerosol paint, 2 - black electrical
tape, 3 - white masking tape, 4 - a clean surface of the copper pipe and 5 -
layer blackened with a marker. Figure 8 shows an instantaneous thermal image of
the shock tube wall.
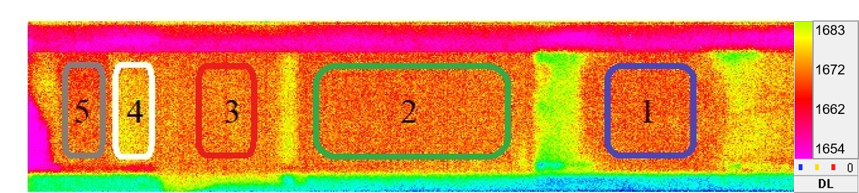
Fig. 8. Thermal image of the impact pipe
section with various coatings
For Mach numbers from the range M = 1,9 – 3,5, thermal
imaging films with a duration of 5 seconds and a volume of 350 MB were recorded.
The shooting frequency was maximum (up to
f
= 400 Hz) due to the small
characteristic times of processes inside the channel. Processes caused by the
thermal conductivity of the channel walls heated from the inside by the flow
were registered. Processing was carried out on the basis of FLIR Altair software.
Fig. 9 shows the curves of dependence on the time of temperature change at the
points in the centers of the five survey zones.
Due to different coefficients of thermal conductivity of
coatings, the time and temperature parameters for survey areas differ (Fig. 9).
The fact that the recorded initial temperature of metal and white tape is
slightly higher than other materials is explained by the large value of the
reflection coefficient of these materials. Also, the thickness of the
electrical tape and masking tape does not allow registering a jump in
temperature behind the shock wave, while the temperature change on the two
black coatings allowed us to draw an analogy with the classical X – t diagram
for solving equations for the shock tube (Fig. 10).
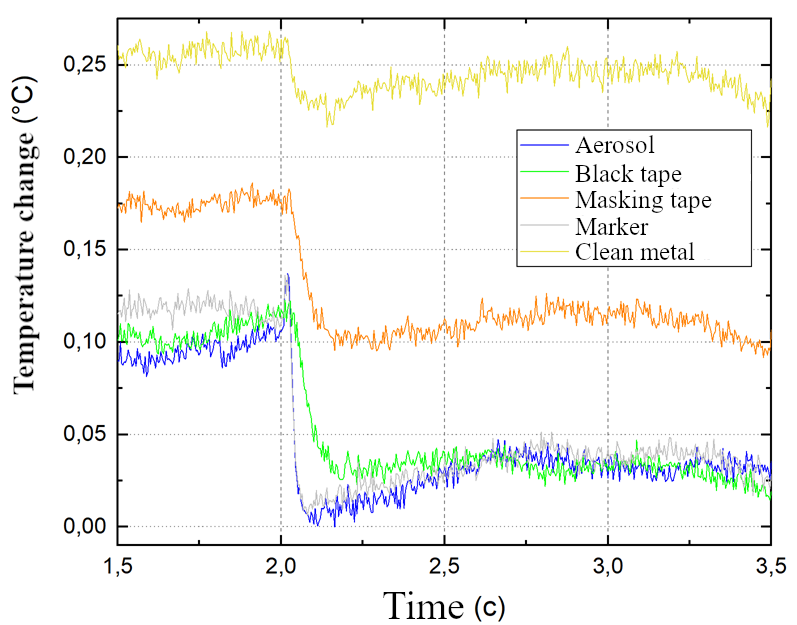
Fig. 9.
Temperature measurement result for the selected survey areas for the shock wave
Mach number
M
= 3.5.
The abrupt temperature change in the channel corresponds
to complex gas-dynamic processes that take place inside the shock tube. The
shock wave traveling through the low-pressure chamber heats and compresses the
working gas behind it, forming a so-called “plug”. The changed parameters of
the gas behind the shock wave front, namely, temperature, pressure, and
density, are estimated using Rankine–Hugoniot conditions.
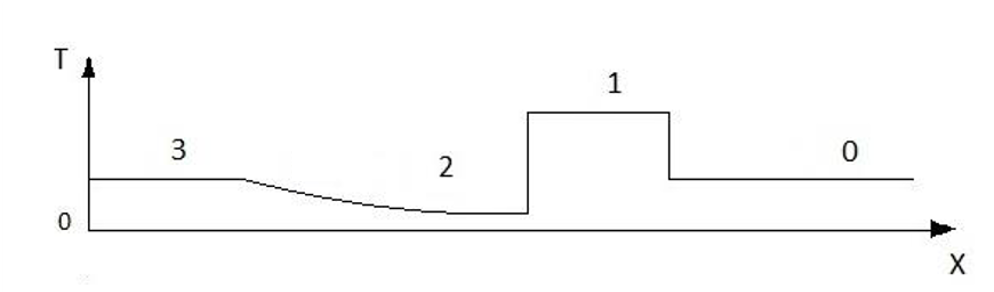
Fig. 10. The temperature profile
in the stream channel.
Figure 10 shows the temperature distribution profile in
the channel. The heated and compressed satellite stream that goes behind the
shock wave front is closed by a contact surface that separates the working and
pushing gases. This change in heat flow, observed in all areas of the survey,
has some dependence on the Mach number. When analyzing data sets, it was shown
that the temperature change is proportional to the increase in the Mach number
of the shock wave, starting from
M
= 2.2 (Fig. 11). The minimum time
recorded by the thermal imager for the rise of heat flow from the wall behind
the passing shock wave is about 10 milliseconds for the survey area covered
with black aerosol. The change in thermal radiation from the end surface of the
pipe, which occurred as a result of double shock compression when reflecting a
shock wave, was also studied.
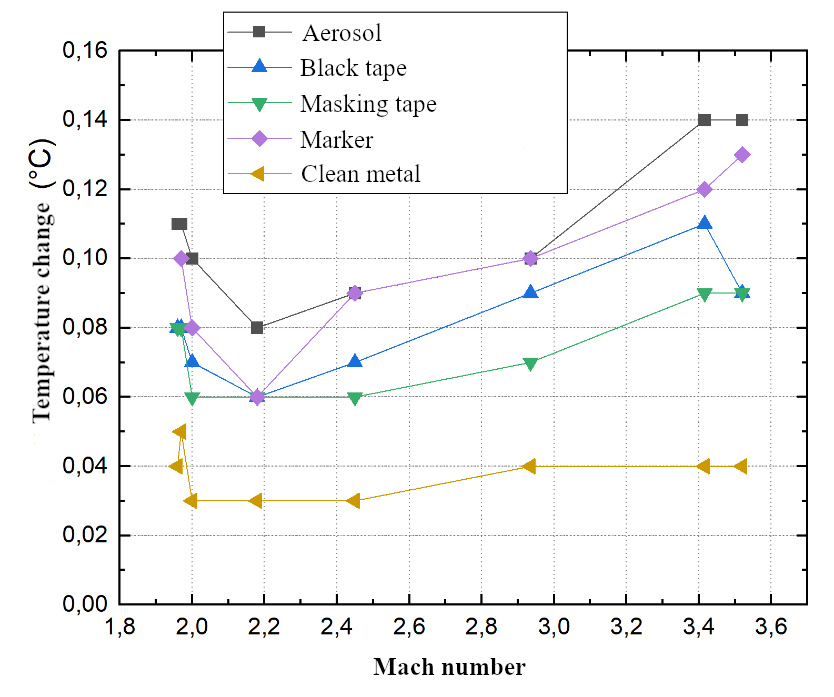
Fig. 11. The dependence of the
temperature changes on the Mach number.
The appearance of a new class of recording infrared
technology and new ways to store visual data has led to the accumulation of
large amounts of digital experimental data. In this paper, the methods and
results of post-processing and analysis of large-volume visual data are
presented on the example of digital data arrays obtained on two stands – thermophysical
and gas-dynamic – for thermographic visualization of high-speed heat flows.
Based on the analysis of the evolution of dynamic
thermal fields in the millisecond range of characteristic times, pulsations of
turbulent hydrodynamic flow of an impacted submerged liquid jet that occur
during non-isothermal mixing near a wall transparent to IR radiation were
studied in a wide range of experimental parameters. Both spatial and temporal
characteristics of changing thermal fields obtained during panoramic
visualization of the jet impact area were analyzed simultaneously; special
programs were used to process the data arrays obtained.
For the first time, changes in thermal radiation from
the side and end surfaces of the channel during the passage and reflection of
the shock wave were registered for the gas-dynamic stand. Measurements were
made for several areas of the channel with different thermal conductivity and emissivity
of the wall. It is shown that the minimum time recorded by the thermal imager
for the increase of heat flow from the outer surface of the wall when the shock
wave front passes the survey point is about 10 milliseconds. The quantitative
dependences of temperature and time parameters of thermograms on Mach numbers
in the range 1.9 - 3.5 (gas temperature behind the shock wave) and the coating
material are revealed. The gas dynamic flow in the shock tube is close to
one-dimensional; the evolution of parameters was studied with the maximum
frequency of shooting, which allowed to resolve processes whose times are
limited by the thermal conductivity of the walls.
In studies involving large amounts of panoramic
visualization data, additional preliminary analysis of hydrodynamic flows is
required in order to minimize the number of measurements and the amount of
information received:
-
refinement of the survey area parameters
(minimize the area and time of registration from the beginning to the end of
the process, having previously made an assessment of the useful area);
-
optimization of spatial and temporal resolution
of registration (rough estimates - by the Nyquist–Shannon sampling theorem);
-
ensuring synchronization of the equipment with
the beginning and the end of the process.
In this study, the preliminary
analysis and use of complexes for processing digital data arrays allowed us to
obtain new results, minimize the time of the experiment, and limit the
consumption of a limited resource of digital equipment.
The work was supported by an RSF grant 18-19-00672.
1.
Cai S., Liang J., Gao Q., Xu C. and Wei R., Particle Image Velocimetry
Based on a Deep Learning Motion Estimator // IEEE Transactions on Instrumentation
and Measurement. 2019. P. 1-1. (10.1109/TIM.2019.2932649)
2.
Vavilov V.P. Infrakrasnaja termografija i teplovoj kontrol'
[Infrared thermography and thermal control]. 2nd ed. 2009. P. 544. [In
Russian].
3.
Leontiev A.I., Kiselev N.A., Burtsev S.A.
Experimental investigation of heat transfer and drag on surfaces with
spherical dimples // Exp. Therm. Fluid Sci. 79. 2016. P. 74–84.
(doi.org/10.1016/j.expthermflusci.2016.06.024)
4.
Roux S., Fénot M., Lalizel L.-E. G., Dorigna Brizzi. E.
Experimental investigation of the flow and heat transfer of an impinging jet
under acoustic excitation // International Journal of Heat and Mass Transfer 54.
2011. P. 3277–3290.
5.
Hofmann H. M., Kind M., Martin H. Measurements on steady state heat
transfer and flow structure and new correlations for heat and mass transfer in
submerged impinging jets // International Journal of Heat and Mass Transfer. 50.
2007. P. 3957–3965. (10.1016/j.ijheatmasstransfer.2007.01.023.)
6.
Ivanitskii G.R., Deev A.A., Khizhnyak E.P. Water surface structure
studies using infrared techniques // Uspekhi Fizicheskikh Nauk, 175. N11. 2005.
P. 1207 - 1216.
7.
Jessup A. T., Phadnis K. R. Measurement of the geometric and
kinematic properties of microscale breaking waves from infrared imagery using a
PIV algorithm // Measurement Science and Technology, 16(10). 2005. P.
1961–1969. (doi:10.1088/0957-0233/16/10/011)
8.
Judd K.P., Smith G.B., Handler R.A., Sisodia A. The thermal
signature of a low Reynolds number submerged turbulent jet impacting a free surface
// Physics of Fluids, 20(11). 2008. 115102. (doi:10.1063/1.2981534)
9.
Plaksina Y.Y., Pushtaev A.V., Vinnichenko N.A., Uvarov A.V. The
effects of small contaminants on the formation of structures during
rayleigh–benard–marangoni convection in a planar liquid layer // Moscow
University Physics Bulletin. Vol. 73, no. 5. 2018. P. 513–519.
10.
Chaugule,
V., Narayanaswamy, R., Lucey, A., Narayan, V., Jewkes, J. Particle
Image Velocimetry and Infrared Thermography of Turbulent Jet Impingement on an
Oscillating Surface // Experimental Thermal and Fluid Science. 98. 2018.
P. 576-593.
(doi.org/10.1016/j.expthermflusci.2018.06.006)
11.
Violato
D., Ianiro A., Cardone G., Scarano F. Three-dimensional vortex dynamics and
confective heat transfer // International Journal of Heat and Fluid Flow, 37. 2012.
P. 22–36. (DOI:10.1016/j.ijheatfluidflow.2012.06.003)
12.
Dupont
J., Mignota G., Paladino D., Prasser H. Mid wave infrared thermography of water
films in condensing and evaporating environments// Nuclear Engineering and
Design. 2018. N 336. P. 80-89.
(doi.org/10.1016/j.nucengdes.2017.06.027)
13.
Carlomagno
G.M., Cardone G. Infrared thermography for convective heat transfer
measurements // Exp Fluids. 49 2010. P. 1187–1218.
(doi.org/10.1007/s00348-010-0912-2)
14.
Znamenskaya I.A., Koroteeva E.Yu., Novinskaya A.M., Sysoev N.N. Spectral
peculiarities of turbulent pulsations of submerged water jets
//
Technical Physics Letters,
42.
№ 7. 2016. P. 686-688.
15.
Koroteeva
E.Yu. Application of high-speed thermographic visualization for validation of
numerical simulations of liquid boundary layer flows. Scientific Visualization
10.2: 2018. P. 112 – 121.
(DOI: 10.26583/sv.10.2.09)
16.
Nakamura
H., Shiibara N., Yamada S. Quantitative measurement of spatio-temporal heat
transfer to a turbulent water pipe flow // International Journal of Heat and
Fluid Flow. 2017. N 63. P. 46-55.
(https://doi.org/10.1016/j.ijheatfluidflow.2016.09.016)
17.
Bilskiy,
A.V., Lozhkin, Yu.A., Nebuchinov, A.S., The influence of the external
periodical excitation on the heat transfer in the impinging jet // Modern
Science: Researches, Ideas, Results, Technologies, Iss. №1
(3), 2010. P. 101 - 109.
18.
Nebuchinov
A. S., Lozhkin Y. A., Bilsky A. V., Markovich D. M. Combination of PIV and PLIF
methods to study convective heat transfer in an impinging jet // Experimental
Thermal and Fluid Science. V. 80. 2017. P. 139–146.
(https://doi.org/10.1016/j.expthermflusci.2016.08.009)
19.
Carlomagno
G.M., Ianiro A. Thermo-fluid-dynamics of submerged jets impinging at short
nozzle-to-plate distance. A review. Experimental Thermal and Fluid Science.
2014. V. 58. P. 15–35.
(doi.org/10.1016/j.expthermflusci.2014.06.010)
20.
Frik
P.G. Turbulence: Approaches and Models // Moscow – Izhevsk: Institute of
Computer Science. 2003. P.292.
21.
Znamenskaya I.A., Koroteeva E.Yu., Ryazanov P.A.,Shagiyanova A.M. Investigations of a laminar-turbulent transition in a water
boundary layer based on high-speed thermography // XII Russian Congress on
Fundamental Problems of Theoretical and Applied Mechanics. 4 vol. Series Fluid
Dynamics. 2. 2019. P. 553-555. [In Russian].
22.
Znamenskaya,I.A. Koroteeva E.Yu., Glazyrin F.M. Digital image analysis of liquid and
gas-plasma flows based on cross-correlation algorithms. Scientific
Visualization 10.4: 2018. P. 111 – 119.
(DOI: 10.26583/sv.10.4.08)
23.
Carson
L. Runninga, Thomas J. Julianoa, Joseph S. Jewellb, Matthew P. Borgb Hypersonic
shock-wave/boundary-layer interactions on a cone/flare // Experimental Thermal
and Fluid Science 109. 2019. P.109911.
24.
Zeldovich
Ya.B., Raiser Yu.P. Physics of shock waves and high-temperature hydrodynamic
phenomena // 2013. P. 692.
