Visualization of an ontology improves
comprehension of knowledge it contains. There are numerous ontology
visualization systems, the reviews are presented in [1–3]. However, the choice
of a visualization system is non-trivial, as there is no method for evaluation
and comparing of ontology visualization systems present in the literature,
except for empirical experiments, that are subjective and costly.
Therefore, we aim to develop formal metrics
for ontology visualizations estimation. ’Formal’ means that they must be
objective and computable. Some metrics we propose require external knowledge of
the language being visualized, its semantics, and knowledge of other
visualization systems, therefore, they are half-formal and require expert evaluation.
Another criterion we propose is based on graph theory
and information theory and is fully computable. The intended information
measure should estimate not the content of the ontology, as it is the same for
each visualization, but the complexity of its form. It implies the following
requirements for the intended information measure:
·
as it should estimate
the complexity of an ontology visualization, it should depend on the complexity
of its structure, in other words, on the number of nodes, edges, and types of
edges;
·
it should be
normalized, as visualizations of the same ontology in different visualization
systems can have a different number of nodes and edges;
·
as it should measure
the visualization complexity, a visualization with a greater number of nodes,
edges, or edges types should have a higher value of the measure.
The outline of the paper is as follows: in the next
section we consider related works, in Section 3 we propose several metrics for
expert evaluation, in Section 4 we derive the information measure for ontology
visualizations complexity, and finally Section 5 contains the description of
the developed application for ontology visualization evaluation and comparing.
A rather small number of works are devoted
to the assessment of ontology visualization systems in general.However, as
ontology visualization results in a graph, works on graph visualization are
also relevant. In [4] the authors propose some recommendations considering
graph diagrams, like minimization of crossings between edges. The authors of
[5] present empirical research on applying these criteria to automatic graph
layout algorithms. In [6] several new shape-based metrics are proposed for
large graphs. All these metrics are based on empirical experiments, i.e. on
human assessments.
In [7] a metric for graphs with known
clustering is described. The authors propose to cluster the nodes in the graph
image and to use an existing measure of similarity to compare this clustering
and the ground truth one. Unfortunately, ground truth is often not known in the
case of ontologies.
|
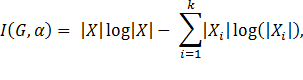
|
(1)
|
where
 is
a graph,
is
a graph,
 represents
a graph invariant and α is an equivalence relation which partitions
into
k
subsets
represents
a graph invariant and α is an equivalence relation which partitions
into
k
subsets
 .
.
The authors of [9] perform
information-theoretic analysis of edge bundling visualizations in terms of
adjacency matrices and mutual information. The main idea is that the mutual
information between the visual description
 and
the raw data
and
the raw data
 should
be maximized
should
be maximized
|
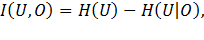
|
(2)
|
where
 is
the entropy of
and
is
the entropy of
and
 is
the conditional entropy of
given
.
is
the conditional entropy of
given
.
But none of the measures presented there
satisfy our requirement. Therefore, we develop a new graph information measure.
First, we propose to consider several features of visualization systems
that, though related to the formal properties, like completeness, still require
expert evaluation, as they involve external knowledge.
The most important property of a
visualization system is its completeness with respect to the language being
visualized, because if a visualization system can not represent some axioms of
an ontology, the system can not be applied to the ontology. In addition, a
common reference language serves as a common denominator for comparing
different visualization systems.
Ontologies are denoted on the OWL language
[10]. The OWL 1 standard provided three increasingly expressive sub-languages:
OWL Lite, OWL DL, and OWL Full. In this paper, we consider OWL DL language, as
it provides the maximum expressiveness, retaining decidability.
The formal foundation of OWL is description
logics (DLs) [11]. DLs are a family of logic languages, that can be used to
represent the terminological knowledge of an application domain. We consider
axioms, formulated with the SHOIN description logic syntax, as it corresponds
to OWL DL language. We evaluate completeness of a visualization system by
counting the number of SHOIN syntax entities that the system can represent.
We suppose, the advantage of a
visualization with respect to a reference language is that it improves
comprehension of a formula with representing its semantic. Therefore, we
propose to evaluate the ability of a visualization system to represent
semantics of expressions.
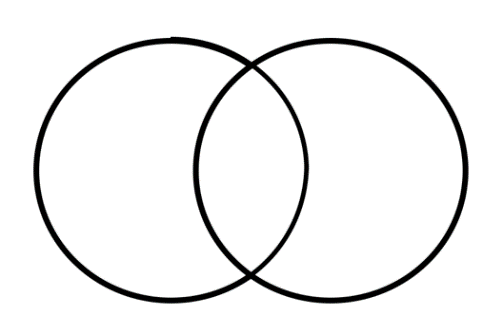
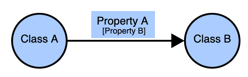
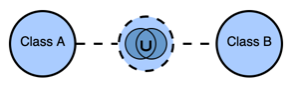
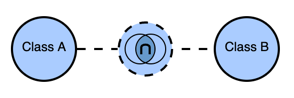
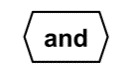
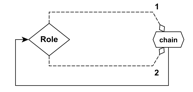
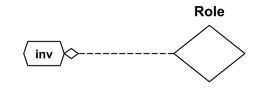
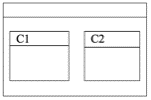
We consider a diagram of a visualization
system for a logical relation as semantical, if it represents the semantic of
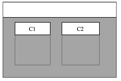
the relation. For example, compare the visualization of conjunction from
Graphol [12], Fig. 1, with the corresponding Venn diagram [13], Fig. 2. Venn
diagram represents that these two sets have common elements, while in Graphol
conjunction is just labeled with a hexagon.
|
|
|
|
Fig.1.
Conjunction in Graphol
|
Fig.2.
Conjunction in Venn diagrams
|
Finally, we suppose that it is important to
use existing graphic primitives from mathematical theories, as in the other
case, i.e. introducing new graphic primitives, instead of helping a user to
understand an ontology it forces him or her to learn just one more language.
Considering again the example above, in Graphol a user has to learn that
hexagon denotes conjunction, while if the Venn diagram was used, the user
familiar with Venn diagrams would have understood the diagram without
additional instructions. Therefore, we consider a graphic primitive to be
conservative if an expert can name an already existing formal system, where it
is adopted from.
We provide an evaluation of the VOWL [14],
Graphol, and Logic Graphs (LGs) [15] visualization system as examples. We
examined its completeness with respect to OWL DL language, its semanticity, the
ability to represent the semantics of relations, and whether its graphic
primitives are new or adopted from some common visualization systems. See Table
1, Table 2 and Table 3 respectively.
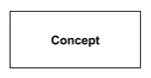
We see that VOWL can represent only 12 of
15 entities of the SHOIN description logic, therefore, its completeness rate is
0.8. The diagrams for concepts, conjunction, disjunction, and equivalence are
semantical and conservative, as they are based on the Venn diagrams. The
diagram for roles can be considered as graph-theory based, therefore, it is
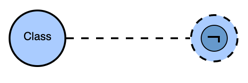
also semantical and conservative. The diagram for negation is conservative, as
it uses the sign of negation from logic, but it is not semantical, since it
doesn’t represent the semantic of negation, i.e. a user wouldn’t have
distinguished negation from another concept if there wasn’t the label of
negation on it.
Considering Graphol, it is complete, but
there are only arbitrary graphic primitives that would have been
indistinguishable if there were no labels. Speaking of labels, Graphol mainly
uses natural language names for operations that are understandable for new
users and, therefore, conservative.
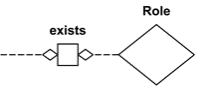
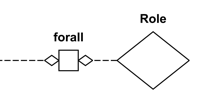
LGs, the semantically oriented ontology visualization
method, developed by us, is complete, mostly semantical and conservative, since
it is based on Venn diagrams, graph theory, and Ch. S. Peirce's existential
graphs [16]. We use non-semantical primitives for number restrictions and
functional roles as their semantical representations are inconvenient, and
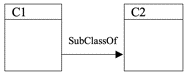
non-semantical and non-conservative primitive for concept inclusion due to the
strong tradition in ontology visualization.
The resulting scores of the considered
visualization systems are presented in Table 4.
In the previous section, we proposed
several metrics for expert-based evaluation. Properties like completeness and
conservativeness are important for visualization systems evaluation, but it
ishard to imagine that they would be fully computable. Thus, we propose one
more approach to ontology visualization systems evaluation intended to be
completely formal. This approach is based on information measuring.
Before defining the information measure, we
have to define the formal framework. We propose to consider ontology
visualization as a hypergraph. Simple graphs are not suitable for our goals as
many ontology visualization systems use edges connecting more than two nodes. A
hypergraph can be represented as an incidence matrix, therefore, an ontology
visualization can be
Table 1. Expert-based evaluation of VOWL
|
N
|
Entity
|
Complete
|
Semantical
|
Conservative
|
|
1
|
Concept
|

|
1
|
1
|
|
2
|
Role
|
|
1
|
1
|
|
3
|
Negation
|
|
0
|
1
|
|
4
|
Conjunction
|
|
1
|
1
|
|
5
|
Disjunction
|
|
1
|
1
|
|
6
|
Existential
restriction
|
|
0
|
0
|
|
7
|
Universal
restriction
|
|
0
|
0
|
|
8
|
Transitive
role
|
|
0
|
0
|
|
9
|
Inverse role
|
|
0
|
0
|
|
10
|
Role hierarchy
|
|
0
|
0
|
|
11
|
Number
restriction
|
|
0
|
0
|
|
12
|
Nominal
|
|
0
|
0
|
|
13
|
Functional
role
|
|
0
|
0
|
|
14
|
Concept
inclusion
|
|
0
|
0
|
|
15
|
Concept
equivalence
|
|
1
|
1
|
|
|
|
0.8
|
0.33
|
0.4
|
Table 2.Expert-based evaluation of Graphol
|
N
|
Entity
|
Complete
|
Semantical
|
Conservative
|
|
1
|
Concept
|
|
1
|
1
|
|
2
|
Role
|

|
1
|
1
|
|
3
|
Negation
|

|
0
|
1
|
|
4
|
Conjunction
|
|
0
|
1
|
|
5
|
Disjunction
|

|
0
|
1
|
|
6
|
Existential
restriction
|
|
0
|
1
|
|
7
|
Universal
restriction
|
|
0
|
1
|
|
8
|
Transitive
role
|
|
0
|
0
|
|
9
|
Inverse role
|
|
0
|
0
|
|
10
|
Role hierarchy
|
|
0
|
0
|
|
11
|
Number
restriction
|
|
0
|
1
|
|
12
|
Nominal
|

|
0
|
1
|
|
13
|
Functional
role
|
|
0
|
0
|
|
14
|
Concept
inclusion
|
|
0
|
0
|
|
15
|
Concept
equivalence
|
|
0
|
0
|
|
|
|
1
|
0.
07
|
0.
6
|
Table 3. Expert-based evaluation
of LGs
|
N
|
Entity
|
Complete
|
Semantical
|
Conservative
|
|
1
|
Concept
|

|
1
|
1
|
|
2
|
Role
|
|
1
|
1
|
|
3
|
Negation
|

|
1
|
1
|
|
4
|
Conjunction
|
|
1
|
1
|
|
5
|
Disjunction
|
|
1
|
1
|
|
6
|
Existential restriction
|
|
1
|
1
|
|
7
|
Universal restriction
|
|
1
|
1
|
|
8
|
Transitive role
|
|
1
|
1
|
|
9
|
Inverse role
|
|
1
|
1
|
|
10
|
Role hierarchy
|
|
1
|
1
|
|
11
|
Number restriction
|
|
0
|
1
|
|
12
|
Nominal
|
|
1
|
1
|
|
13
|
Functional role
|
|
0
|
1
|
|
14
|
Concept inclusion
|
|
0
|
0
|
|
15
|
Concept equivalence
|

|
1
|
1
|
|
|
|
1
|
0.
8
|
0.
93
|
Table 4. Expert-based comparing of VOWL and
LG
|
|
Complete
|
Semantical
|
Conservative
|
|
VOWL
|
0.8
|
0.33
|
0.4
|
|
Graphol
|
1
|
0.07
|
0.6
|
|
LGs
|
1
|
0.8
|
0.93
|
represented as an incidence matrix as well.
Let there is a hypergraph
 ,
where
–
is a set of nodes and E is a set of edges. It is represented with
,
where
–
is a set of nodes and E is a set of edges. It is represented with
 incidence
matrix
incidence
matrix
 ,
where
,
where
|
 =
=
|
(3)
|
for undirected graph and
|
=
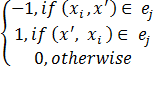
|
(4)
|
and
|
= 2
|
(5)
|
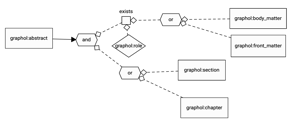
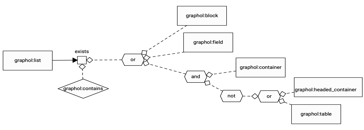
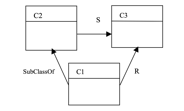
Consider the following axiom from the
Document Components Ontology (DoCO) [17] as the example
|

|
(6)
|
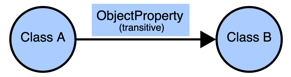
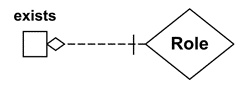
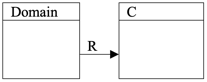
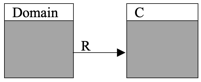
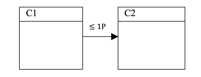
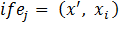
and its visualization in the Graphol
system, see Fig. 3. Here edges denoting
|
|
|
Fig. 3.
Visualization of the axiom 1 in Graphol
|
disjunction connect three nodes:
’graphol.paragraph’, ’graphol.section’ and ’or’, therefore, it is the
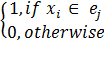
hypergraph. The incidence matrix for this hypergraph is Table 5. Each node of
the diagram corresponds to a row of the matrix and each relation – to a column.
As nodes ’graphol.paragraph’, ’graphol.section’ and ’or’ are connected with the
edge ’or’, the corresponding cells have value 1. In this research, we ignore
the direction of edges for simplicity.
Table 5. The incidence matrix for the axiom
1 in Graphol
|
|
subClassOf
|
graphol.contains
|
or
|
|
exists
|
1
|
1
|
0
|
|
graphol.chapter
|
1
|
0
|
0
|
|
graphol.contains
|
0
|
1
|
0
|
|
graphol.paragraph
|
0
|
0
|
1
|
|
graphol.sections
|
0
|
0
|
1
|
|
or
|
0
|
1
|
1
|
Definition 1.
For a given incidence matrix A the set of all
values is {a}.
For undirected graph {a} = {0,1}, for
directed {a} = {−1,0,1}, for directed graph with loops {a} = {−1,
0, 1, 2} and so on.
Now we define the set of all possible edges
 :
:
Definition 2.
For a hypergraph H with a given set of nodes X the
set of all possible edges
 .
.
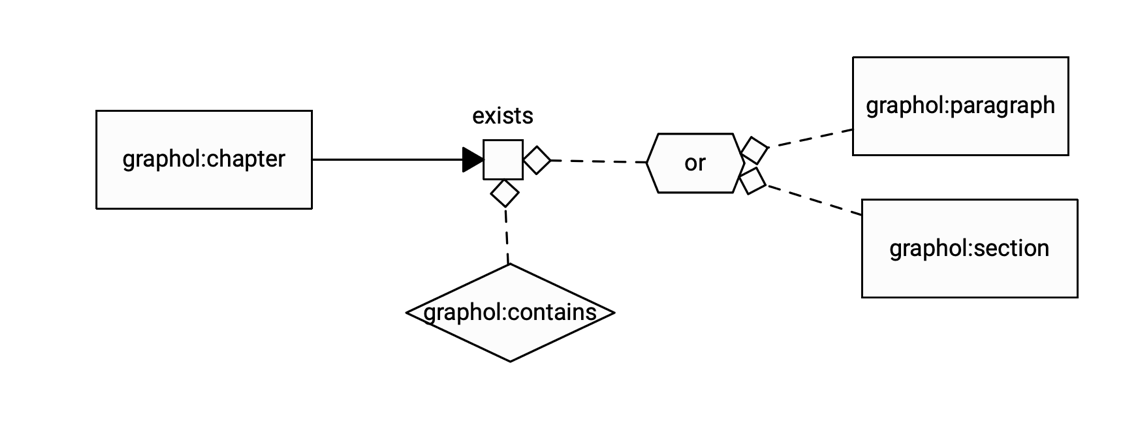
We are ready to define the information
measure for hypergraph complexity estimation by deriving it from the Hartley
function [18]
|

|
(7)
|
where
 is
an arbitrary set and
b
– an arbitrary number. We substitute the number
of edges
is
an arbitrary set and
b
– an arbitrary number. We substitute the number
of edges
 as
as
 and
the number of all possible edges
and
the number of all possible edges
 as
b.
as
b.
Definition 3.
For a hypergraph H with a given set of nodes
 ,
a given set of edges
,
a given set of edges
 and a set of corresponding incidence
matrix values
and a set of corresponding incidence
matrix values
 ,
the information
,
the information
 is
following:
is
following:
|
|
(8)
|
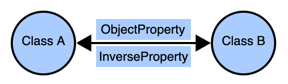
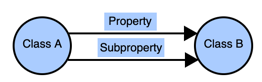
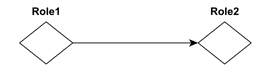
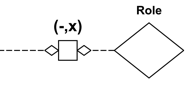
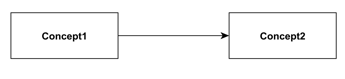
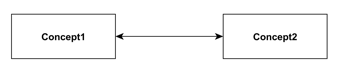
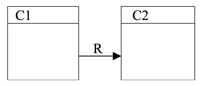
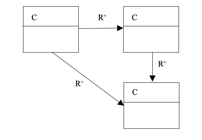
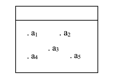
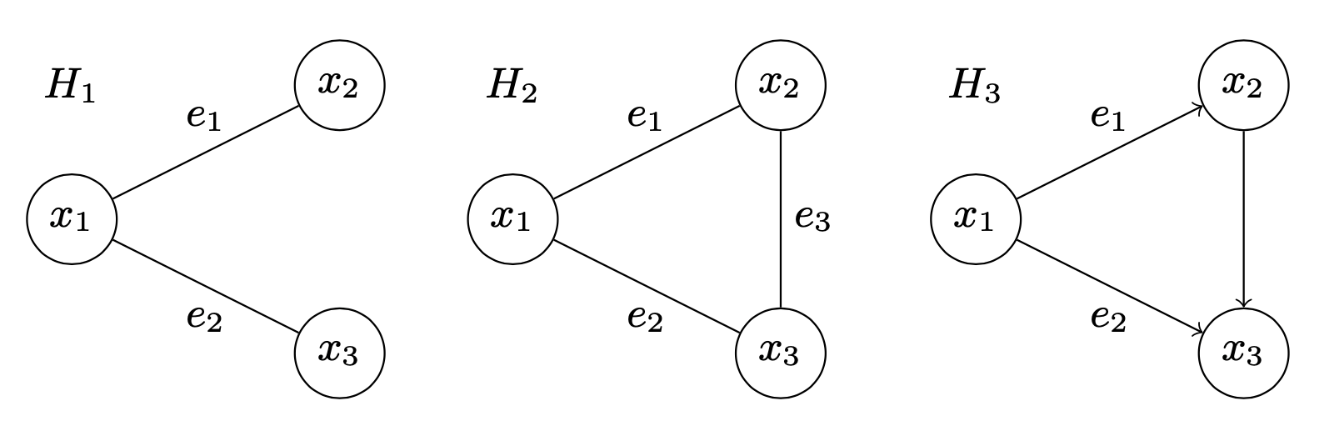
Consider several simple graphs for illustration,
see Fig. 4, its information estimation is at the Table 6. As we see,
 has
a more complex structure comparing to H1 and, therefore, its information value
is higher.
has
a more complex structure comparing to H1 and, therefore, its information value
is higher.
 is
directed and each directed edge contains less information, therefore, with the
same number of edges its information value is lower compared to
is
directed and each directed edge contains less information, therefore, with the
same number of edges its information value is lower compared to
 .
Summing up, the information measure satisfies the desired properties.
.
Summing up, the information measure satisfies the desired properties.
Table 6. Information estimation of the
graph examples
|

|

|
|
|
|
|
1
|
3
|
2
|
2
|
0.33
|
|
2
|
3
|
3
|
2
|
0.53
|
|
3
|
3
|
3
|
3
|
0.21
|
|
|
|
Fig. 4. The
graph examples
|
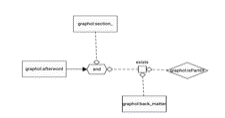
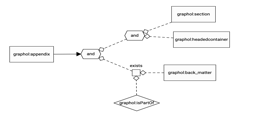
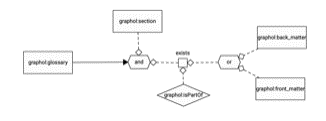
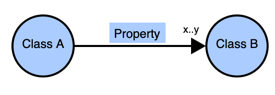
We provide an example of comparing ontology
visualizations with the developed information measure. Unlike expert-based
evaluation, where we compared visualization systems itself, for information
measure we have to compare visualizations of a particular ontology. We use the
DoCO ontology as it is a real ontology, used in different applications, and it
contains nontrivial axioms. We visualized some axioms of this ontology in
Graphol and Logic Graphs. The list of axioms and their visualizations are in
Table 7.
The example of an incidence matrix for
Graphol was provided in Table 5. Now consider the example of the incidence
matrix for Logic Graphs. The incidence matrix for the axiom 1 in Logic graphs
is Table 8.
We compare LGs with Graphol by measuring
information of the correspond- ing visualizations for the sample of axioms,
presented in Table 7. We selected the axioms according to the following criteria:
·
the axioms must have
non-trivial form, i.e. contain more than one operation;
·
each axiom must have a
unique structure, i.e. none two axioms can have the same combination of
operations;
·
the sample must contain
all types of operations: negation, conjunction, disjunction, inclusion, roles
with existential and universal restrictions.
The result is in Table 9. As we see, the
average information of LGs on this sample is higher, than of Graphol.
Table 7. Visualizations of DoCO in LGs and
Graphol
Table 8. The incidence matrix for axiom 1
in LGs
|
|
subClassOf
|
contains
|
negation 1
|
negation 2
|
conjunction
|
negation 3
|
|
chapter
|
1
|
0
|
0
|
0
|
0
|
0
|
|
conjunction
|
0
|
1
|
0
|
0
|
1
|
1
|
|
domain
|
1
|
1
|
0
|
0
|
0
|
0
|
|
paragraph
|
0
|
0
|
1
|
0
|
1
|
0
|
|
section
|
0
|
0
|
0
|
1
|
1
|
0
|
Table 9. Comparing information of ontology
visualizations
|
N
|
LG
|
Graphol
|
|
|
|
|
|
|
|
|
|
|
|
1
|
5
|
6
|
2
|
0.52
|
6
|
3
|
2
|
0.26
|
|
2
|
9
|
11
|
2
|
0.38
|
10
|
5
|
2
|
0.23
|
|
3
|
5
|
3
|
2
|
0.32
|
6
|
3
|
2
|
0.26
|
|
4
|
7
|
4
|
2
|
0.29
|
8
|
4
|
2
|
0.25
|
|
5
|
4
|
2
|
2
|
0.25
|
4
|
2
|
2
|
0.25
|
|
6
|
2
|
2
|
2
|
0.5
|
3
|
2
|
2
|
0.33
|
|
7
|
3
|
2
|
2
|
0.33
|
4
|
2
|
2
|
0.25
|
|
8
|
4
|
5
|
2
|
0.58
|
4
|
2
|
2
|
0.25
|
|
9
|
7
|
7
|
2
|
0.4
|
8
|
4
|
2
|
0.25
|
|
10
|
10
|
11
|
2
|
0.35
|
12
|
6
|
2
|
0.22
|
|
|
|
|
|
0.39
|
|
|
|
0.26
|
As a part of
this research, an application has been implemented. It includes a basic
ontology visualization tool, a library of formal ontology visualization
metrics, and an algorithm for constructing the best visualization according to
the selected metrics.
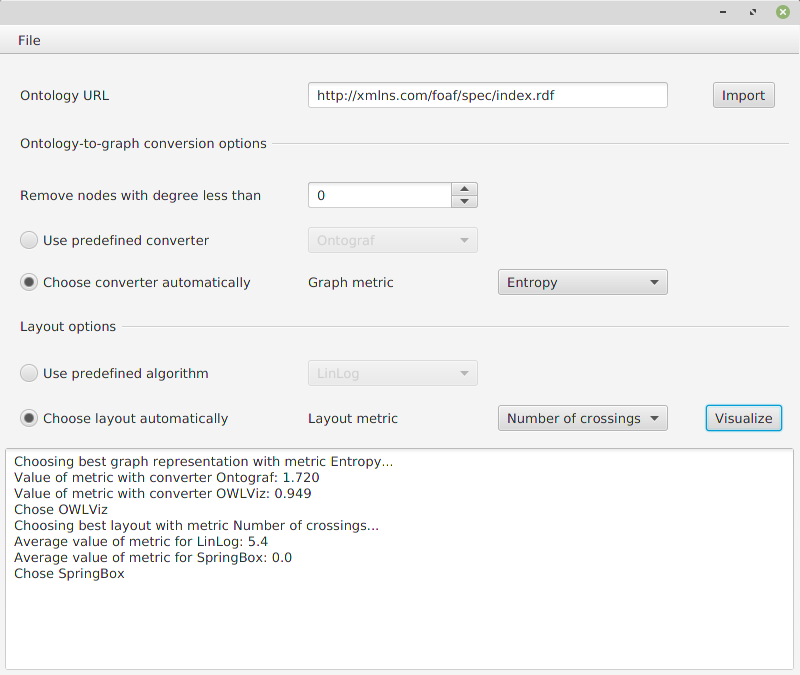
The
application is implemented with JavaFX, for graph representation Graph- stream
library [19] is used and ontologies are imported with the help of OWL API [20].
Several decisions have been made in the course of development to improve the
readability of ontologies. Firstly, in order to reduce visual clutter,
labels
of edges are shown only when they hover. Secondly, there is an option on the
conversion step to remove nodes with a degree less than the specified
threshold. A similar option exists in WebVOWL [21], the rationale behind it is
that the most important concepts in an ontology often correspond to nodes with
the largest degrees. Screenshots of the application are shown in Fig. 5.
|
|
|
Fig.
5. Application menu
|
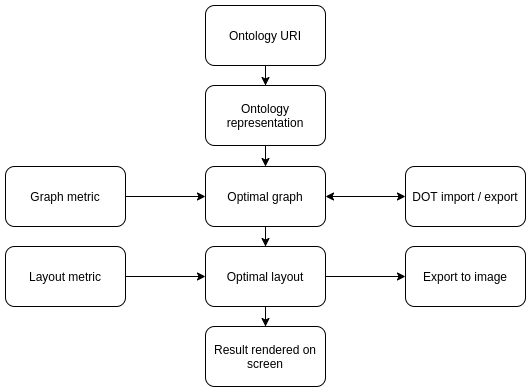
The
workflow of the application consists of two steps: 1) conversion of an ontology
to a graph and 2) constructing the layout for the graph. For both steps, users
could either set an algorithm explicitly or let the program choose it
automatically based on a selected quality metric. The resulting graph also
could be exported to DOT. Data flow in the application is summarized in Fig. 6.
|
|
|
Fig.
6. Data flow in the application
|
The
application includes the library of visualization metrics. For the conversion
step, the library includes a special case of the proposed formal metric (8)
with
 = 2.
Along with it, there is the graph entropy metric (1) with X being the set of
nodes. Two nodes are considered equivalent if they have the same degree. For
the layout step, the aesthetic metrics from the field of graph drawing are
used, including the number of edge crossings and similarity with shape graph,
namely, k-nearest neighbors graph [6].
= 2.
Along with it, there is the graph entropy metric (1) with X being the set of
nodes. Two nodes are considered equivalent if they have the same degree. For
the layout step, the aesthetic metrics from the field of graph drawing are
used, including the number of edge crossings and similarity with shape graph,
namely, k-nearest neighbors graph [6].
If a
user sets a visualization metric instead of explicit visualization parameters,
the application searches for the best visualization algorithm automatically,
based on the selected metric. First, the metric is evaluated on the result of
each algorithm. Then the algorithm with the best value (the highest or the
lowest, depending on the meaning of the metric) of the metric is chosen. Since
force
-
directed
algorithms use randomization, they are run multiple times, and the mean value
of the metric for all runs is used.
The
application provides two ways to evaluate and compare the visualizations
produced by other ontology visualization tools. The first way is to simulate
the results with the proper algorithms in the application. At the moment,
conversion algorithms from visualization tools Ontograf [22] and OWLViz [23]
are supported. The second way is to import the result. Some visualization
tools, e.g. WebVOWL, support export to DOT, so the application supports import
from this format. As per layout, several force-directed algorithms are
supported.
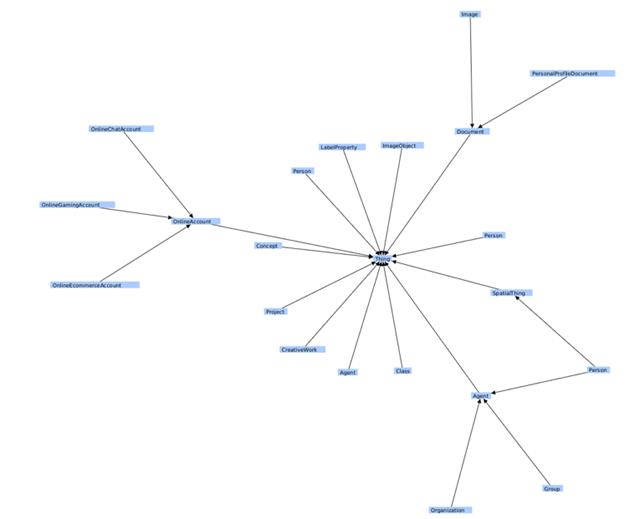
As an
example, the visualization of the FOAF ontology [24] in the application is
provided at Fig. 7.
|
|
|
Fig.
7. Visualization of the FOAF ontology in the application
|
In this research, we proposed several
non-empirical metrics for ontology visualization evaluation and comparing.
These metrics are divided into two groups. The first group includes three
metrics: completeness, semanticity, and conservativeness. These metrics require
expert evaluation and, therefore, they are half-formal. As an example, we
compared ontology visualization systems: VOWL Graphol and Logic Graphs.
The second group consists of the completely
computable information measure, derived from the Hartley formula, that allows
normalized measuring complexity of ontology visualizations, represented as
hypergraphs with incidence matrices. As an example, we compared Logic Graphs
with Graphol by measuring average information of visualizations of the sample of
axioms from the DoCO ontology.
These results can be practically applied
for choosing ontology visualization systems in general and regarding a
particular ontology. Considering the presented examples, it is recommended to
use LGs rather than VOWL in general, as it has higher scores of completeness,
semanticity, and conservativeness, and for visualizing the mentioned fragment
of the DoCO, as LGs has higher informativeness.
As the implementation of the results, the
application for ontology visualization evaluation and comparing has been
developed. It includes the basic ontology visualization tool, the library of
formal ontology visualization metrics, and the algorithm for constructing the
optimal visualization according to the selected metrics. The application
supports simulation of several ontology visualization tools and import and
export to DOT format.
[1]
Antoniazzi F., Viola F.: RDF graph visualization tools: A survey //2018 23rd
Conference of Open Innovations Association (FRUCT).IEEE, 25-36 (2018).
[2]
Duda ́s, M.,Lohmann, S., Sva ́tek, V., Pavlov, D.: Ontology
visualization methods and tools: A survey of the state of the art. The
Knowledge Engineering Review, vol 33, (2018).
[3]
Steffen, L., Stefan, N. , Florian, H. Thomas, E: Visualizing ontologies with
VOWL. Semantic Web. 7. 399-419. (2016).
[4]
R. Tamassia, C. Batini, and M. Talamo. An algorithm for automatic layout of
entity-relationship diagrams. In C. G. Davis, S. Jajodia, P. A. Ng, and R. T.
Yeh, editors, 3rd Int. Conf. on Entity-Relationship Approach (ER’83), pages
421-439. North-Holland, 1983.
[5]
Purchase, Helen & Carrington, David & Allder, Jo-Anne. (2002).
Empirical Evaluation of Aesthetics-based Graph Layout. Empirical Software
Engineering. 7.
[6]
Eades, Peter & Hong, Seok-Hee & Klein, Karsten & Nguyen, An.
(2015). Shape- Based Quality Metrics for Large Graph Visualization. 502-514.
[7]
Meidiana, Amyra, etal.”AQualityMetricforVisualizationofClustersinGraphs.”
International Symposium on Graph Drawing and Network Visualization. Springer,
Cham, 2019.
[8]
Dehmer, Matthias & Mowshowitz, Abbe. (2011). A History of Graph Entropy
Measures. Information Sciences. 1. 57-78.
[9]
Wu, Jieting & Zhu, Feiyu & Liu, Xin & Yu, Hongfeng. (2018). An
Information- Theoretic Framework for Evaluating Edge Bundling Visualization.
Entropy. 20. 625.
[10]
Deborah, L., Frank, V.,, et al. Owl web ontology language overview. W3C recom-
mendation, 10(10):2004,(2004)
[11]
Baader, F., Calvanese, D. , McGuinness, D. ,Nardi, D. and Patel-Schneider, P.:
The Description Logic Handbook: Theory, Implementation, and Applications. Cam-
bridge University Press, second edition, (2007).
[12]
Graphol official website, Http://www.obdasystems.com/graphol. Last accessed 4
jul 2020.
[13]
Ruskey, F.,Weston, M.:A Survey of Venn Diagrams. The Electronic Journal of
Combinatorics, (2005)
[14]
VOWL official website, Http://vowl.visualdataweb.org/. Last accessed 4 jul 2020.
[15]
Mouromtsev, D., Baimuratov, I.: Logic Graphs: A complete visualization method
for logical languages based on Ch. S. Peirce’s existential graphs. CEUR
Workshop Proceedings, Vol. 2344, 2019, pp. 1-10.
[16]
Sowa, J.: Peirce’s tutorial on existential graphs. Semiotica, 186, 2011, pp.
347-394.
[17]
Ontology DoCO, https://sparontologies.github.io/doco/current/doco.html. Last
accessed 4 jul 2020.
[18]
R. V. L. Hartley, ”Transmission of information,” in The Bell System Technical
Journal, vol. 7, no. 3, pp. 535-563, July 1928.
[19]
Dutot A. et al. Graphstream: A tool for bridging the gap between complex
systems and dynamic graphs. – 2007.
[20]
Horridge, M. & Bechhofer, S. (2011). The owl api: A java api for owl
ontologies. Semantic web, 2(1), 11-21.
[21]
Lohmann, Steffen, et al. ”WebVOWL: Web-based visualization of ontologies.”
International Conference on Knowledge Engineering and Knowledge Management.
Springer, Cham, 2014.
[22]
Falconer S. Ontograf protege plugin //Place: Available at: http://protegewiki.
stanford. edu/wiki/OntoGraf [Accessed: 21/09/2020]. – 2010.
[23]
Horridge M. OWLViz //Available on: http://protegewiki.
stanford.edu/wiki/OWLViz. – 2010.
[24]
Ontology FOAF, http://xmlns.com/foaf/spec/. Last accessed 4 jul 2020
.