Any textual expression of
a new commercial idea should be understandable, interesting, fascinating and
clearly showing why the interested party should implement it. The text without
visual accompaniment is of little interest, as mentioned by the founder of the
«graphic method» Scottish engineer-economist William Playfair in 1796: active
businessmen can pay attention only to general conclusions, and with the help of
graphs, information is perceived without fatigue and difficulties associated
with the study of its constituent components. Visualization has become an
integral part of the global communication process and is included by the UN
Economic Commission for Europe in the standard model of a business process. Its
opportunities in commerce and business are widely and actively discussed by
world experts - Stephen Few, David McCandless, Ben Fry, Nathan Yau, Edward
Tufte, Alberto Cairo, Hans Rosling, Wayne Eckerson, Gene Zelazny and others.
Due to the pronounced illustrative
function, methods of activating visual thinking are widely used in the exact
sciences, pedagogy, psychology, management, marketing. Business visualization
is considered as a system of working with information, therefore the areas of
using infographics, scribing, forcing, business modeling, techniques for
processing data arrays (Big Data, Business Intelligence) and other techniques
are actively expanding. Priorities - brainstorming, training, strategic
sessions, negotiations, client meetings, meetings. But a system analysis of the
potential and missed opportunities of cognitive visualization in developing key
sections of a business-plan is not yet sufficient, which confirms the study of
visualization metaphors in business modeling, which allowed researchers to
generalize its social and cognitive advantages (T. Gavrilova, 2014) [1]:
- information
compression, capacity and availability of the message for perception;
- minimization of efforts
to find information and ease of transferring some logical conclusions, given
that the perception of the text refers to the left hemisphere (logical)
activity of the brain and does not involve the cognitive resources of the right
(figurative) hemisphere, i.e. not effective enough;
- increase in the
efficiency of perception of data when switching attention, because the release
of a large amount of memory frees up an additional amount of a person’s working
memory and thereby simplifies the memorization and retention of details in
consciousness;
- the ability to integrate
different points of view, contributing to mutual understanding and facilitating
the interaction of people in a team;
- the formation of a
sense of involvement in teamwork, as well as the development of creative
potential and the strengthening of partnerships.
The developer of an
investment project should pay attention to key issues, arouse interest in
cooperation, justify the benefits and effects even in the presence of risks and
competition. The clarity of arguments, convincing facts, calculation results
and comparative estimates, figurative clarity of information and evidence of
the reality of the idea are important.
This allows us to
identify the specifics of business processes that cognitive visualization
should take into account:
- the focus of the
business-plan on attracting investments, which implies not only objectivity,
accuracy of forecasts and thorough verification of information, but the
mandatory presentation of alternative options for capital allocation;
- dynamism, risk,
uncertainty of the environment, complicating its forecasting;
- a lot of direct and
feedback, factors separated in space and time of cash flows, the non-linear
nature of the processes.
The
article discusses potential graphic tools and the most popular classical visual
models, provides illustrative examples of visualization in solving practical
problems during business-planning.
The generally accepted
symbolic representation (visual content) help to focus attention in the
text of the project on the most important organizational, commercial,
marketing, merchandising experts, trade and procurement, financial and
economic, analytical, planning and forecasting, regulatory and foreign trade
aspects of the business. Charts, graphs, tables, maps, and other cognitive-visual
tools become a source of new forms of awareness of information and the basis of
decision-making systems, which corresponds to such principles of the human
brain as «multitasking» (Kozubovsky VM, 2008) [2] and «serendipity »
(Bolter JD, 2014) [3].
Visualization allows a trained user to optimize work
with an array of «routine» specific information through the use of ready-made
mental structures that reduce cognitive effort and time, simplifies the
process of assessing the context (Zakharova A.A., 2016) [4]. It is important to
note that only a competent user is in a state of «directed waiting» when he is
already aware of possible scenarios for the development of business activity,
and an informative event is a formalized transition from one state to another.
Firstly, homogeneous
objects are grouped and systematized in the tables, which makes it possible to
identify the composition, sizes, structure, dynamics of processes, trends
(growth, fall, seasonal fluctuations). The
simplicity of compilation, consistency, reasonableness, compactness, the
ability to quickly correct information, the convenience of computer processing
and archiving make them a universal visualization technique.
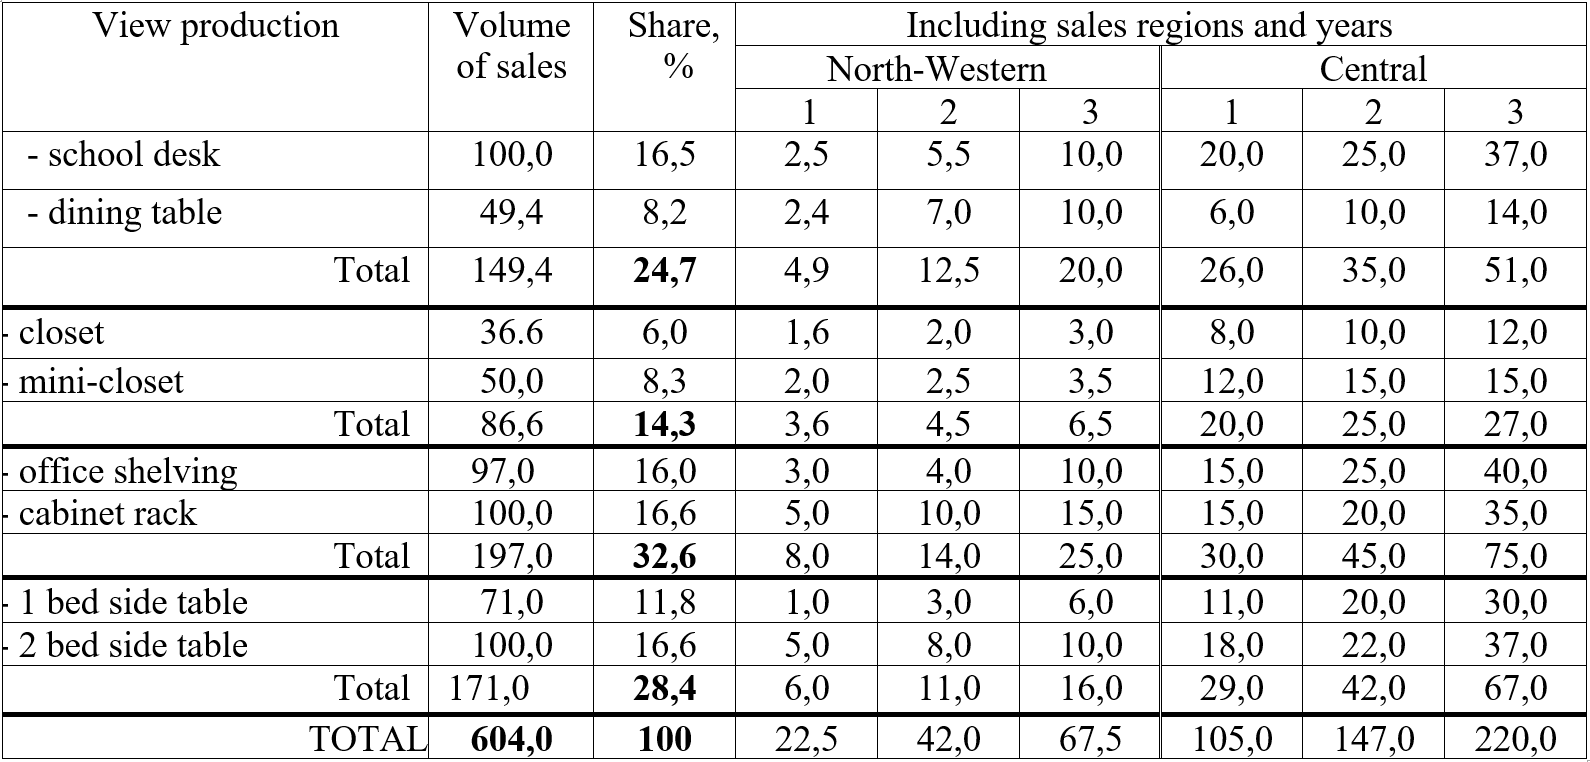
For example, a company manufacturing office furniture,
in terms of marketing in the format of a combination table, presents a forecast
of sales by market segments, regions and assortment groups (table 1). The
reader immediately focuses on the overall results - the revitalization of
business activity, sales growth, the region with high demand (Central region)
and the general favorable environment for the implementation of a new
commercial idea.
Secondly, the graphs,
which also help to overcome the formlessness and fragmentation of digital data,
to give them a more strict order and clarity, explain the patterns of
development of the business process in the long term. The data array receives
new knowledge, cause-effect relationships between market processes are
indicated, and existing inaccuracies and errors in the calculations are revealed.
Thirdly, diverse charts
hold and focus on the content of the project when comparing alternative
solutions to problems or analyzing individual aspects of the business. The
influence of individual characteristics of perception in interpreting an event
becomes minimal, only changes are recorded, and reading a visual message does
not change the types of thought processes (Madigan S., 1974) [5].
Table 1. Dynamics of sales of the company
(million rubles)
The diagrams are used
very thoughtfully: the comparison can be component-wise, positional, temporal,
frequency, correlation. So, a diagram of the form «entity – relationship» (ER)
is used to describe the nature, structure and attributes of products, relationships
between the results of business processes (Kuznetsov SD, 2005) [6].
During the implementation
of the project, deviations from the intended indicators may occur. These can be
an increase in the production time of an order that happens due to
marriage, equipment downtime a decrease in sales. Therefore, using comparison
charts and structural diagrams in the text of the business-plan, you can
illustrate and evaluate the permissible deviations by key indicators. The
former reflect the correlation of a certain characteristic of the process under
study and give an idea of its uniformity or unevenness, general dynamics and
trends, the latter reflect the composition and proportion of specific elements
in the total population.
It is unacceptably rare
to use a balance sheet that allows you to formalize the project budget:
the height of the column corresponds to the value of the asset (liability), and
the inner rectangles correspond to the value of their component elements. By
presenting charts before and after the project, you can clearly demonstrate the
benefits of the business, the distribution of key resources and income.
In our opinion, the
name charts are very effective in representing the market
capacity, production capacity potential, level of innovation of the selected
technology, product range, competitive advantages, and the amount of future
costs is also underestimated. Varzar signs can be effective for
simultaneously displaying three commercial indicators, one of which is a
product of the other two. The example are sales (revenue) that take into
account the price and quantity of the product. Having nearby signs relating to
different objects, alternative projects or processes implemented by
competitors, a factor analysis of the event can be carried out. Pareto chart
- a downward bar chart in which the bars indicate the causes of the problem,
and the height indicates the frequency of their occurrence. A variant of the
diagram based on the results of activity is useful in identifying the main
problem associated with either product quality (defects, failures, errors); or
with cost (volume of losses, costs); or with safety (accidents, accidents,
injuries, operational errors).
A variation of the
diagram by reason distributes the causes of the problems in order of
importance. The Lorentz curve is a graphical representation of the
concentration level of a phenomenon using axes with the same scale percentage
scale from 0 to 100, where successively accumulated (cumulative) results of
changes in characteristics (for example, income distribution) are recorded. A
straight line at an angle of 450 indicates complete distribution uniformity:
the farther the actual line is from it, the less uniform the distribution.
Fourth, matrices, as a
tool for situational analysis, allow you to present alternatives to business
development and position the current state of the company under the influence
of market forces (Loginov G.O., 2004) [7]. These are peculiar map tables with a
small (4 - 9) number of rows and columns forming a segment (quadrant) at the
intersection. One vector indicates the characteristics of the functions and
properties of the object, the other - the level of their manifestation
(«strong», «medium», «weak»). The position in the quadrant of the matrix
characterizes the specific proportions and combination of the two main
aggregated characteristics of the competitive environment. The developer of a
business idea has the opportunity with the help of matrices to attract
attention and comprehend the vision of strategic behavior in the process of
implementing a business-plan.
The appropriateness of
using matrices is explained by the objectivity of certain organizational
principles: a) the company’s orientation to long-term and continuous profitable
activity, when the development of a strategy and methods for its implementation
is mandatory, and b) all commercial operations generate predicted and managed
cash flows, which implies their modeling, including number and matrix. A
classic example is the Boston matrix, which displays the growth rate of demand
in the market segment and the company's position relative to the competition in
the distribution of cash flows generated by specific product groups.
Fifth, the schemes are
the simplest and most clear informal means of enhancing abstract thinking, that
focus on the main aspects of a business plan and lead to an understanding of
the logic of an event or patterns of a commercial process, as well as describe
process regulations (technologies, organizational structures, goods and cash
flows ) or causal relationships in them. According to the theory of perception
of Nysser U., schemes guide the cognitive process, give a detailed image of the
designed entrepreneurial activity and at the same time provide a favorable
psychological climate and positive emotions during the discussion. The experts
of the British Deming Association define the ability to describe processes
using flowcharts or «process cards» as an important managerial competency that
ensures the successful transformation of production resources and the
achievement of the desired measurable results. The scheme gives an idea of the
composition of the most important elements, the order of the actions, the
essence of the interaction of the performers, the distribution of areas of
responsibility, and also helps to identify potential bottlenecks and areas for
improving the business process. Formalization of the business process in the
form of a scheme contributes to a clear understanding of how the company works;
what are the standards of the processes, how is the business managed and the
interaction of units is achieved in order to achieve overall performance.
There are block diagrams,
text schemes, text block diagrams, table diagrams, diagrams-figures, circle
diagrams, diagrams-tables-figures-circles, spider schemes. This diversity is
due to significant differences in nature, features and properties of knowledge
of various subject areas of commerce. So, tree diagrams, or graphs, demonstrate
a hierarchy of a data set in which elements are children in relation to each
other. Universal structural-logical schemes create a special visualization in
the illustration of successive relationships based on associations
characteristic of long-term human memory. The Ishikawa scheme («fish skeleton»)
is known for demonstrating: a) a chain of interrelated causes of the problem;
b) analysis and structuring of processes in the enterprise; c) assessing the
relationship of cause and effect relationships; d) the level of lean
production. In the banking sector, the use of the Ishikawa method is
recommended in the BABOK® Guide [8].
Sixth, the map displays a
specific event in relation to space (region, territory) and contains signs,
geometric shapes, background coloring, hatching. These can be locations of
production shops, territories of market promotion and sales of a product,
segments of customers or debtors of a company, regions of locations of
suppliers, etc. To argue the choice of the best technology variant or form of
sales, alternative comparison indicators are used: objects are compared in
terms of productivity, sales volume, investment payback periods, profitability,
etc. Cartograms and card diagrams make it possible to visually reflect more
complex production and business relations and relationships.
Seventh, signs and photo
documents. Signs are a specific method of conditionally graphic visualization,
a kind of “identification mark”, a pointer, a label that helps to express
certain concepts and represent ideas, phenomena, events in the process of exchanging
information. Signs do not give ready conclusions, formulations. However, they
develop abstract thinking and help to focus on the desired fragment of the text
and lead to the understanding of one or another pattern, fully reflect the key
tasks, the benefits, benefits and amenities, as well as create a brand model.
Photo documents are used to materialize a commercial idea from the standpoint
of real or subconscious needs and desires of partners. They document the
ongoing processes and events, manufacturing techniques or active sales,
operating techniques, and functions performed. Such displays inspire confidence
not only among partners, but also among all parties interested in the project.
Thus, in business planning,
visualization is achieved by coding techniques and “works” on the intellectual
and emotional levels as an aesthetic and readable format that is transformed by
the brain into a metal image using the following cognitive operations
(Langacker R., 2000) [9]:
- specification (level of generalization and
schematization of forecast data);
- focusing (emphasis on key issues and the task
of the business process);
- highlighting (detailing of identified problems and
tasks);
- perspectivization (the formulation of a point of
view, i.e., the implementation of a cognitive device for understanding
information).
According to the ideas of
M. McLuhan, an expert in the field of communication, the sensual attitudes of
modern people are mostly visual in nature, much more gravitate to wordless
perception and image. Other researchers (Pirolli P., 1995) [10] noted a natural
desire of a person to reduce labor costs when searching and interpreting an
array of information. However, one should not exclude the danger of a negative
cognitive perception of «redundant graphics» or too simplified «pictures» due
to the developer’s lack of professionalism, inaccurate information, limited
technical capabilities or unsuccessful templates, as well as an insufficient
level of financial, economic or managerial training for the user.
The fundamental point in
motivation for a positive perception of business information and the formation
of balanced strategic decisions is the coordination of interests of
participants (stakeholders) in future business processes. Agreeing with the
opinion that an individual competes or cooperates in the market, has
emotionality, accumulates experience and enriches his mental models, based on
which he makes decisions, but never has complete information (Lychkina N.N.,
2016) [11], we made an attempt to detail the information needs of participants
in the business process (table 2).
Table 2. Information needs of project
stakeholders
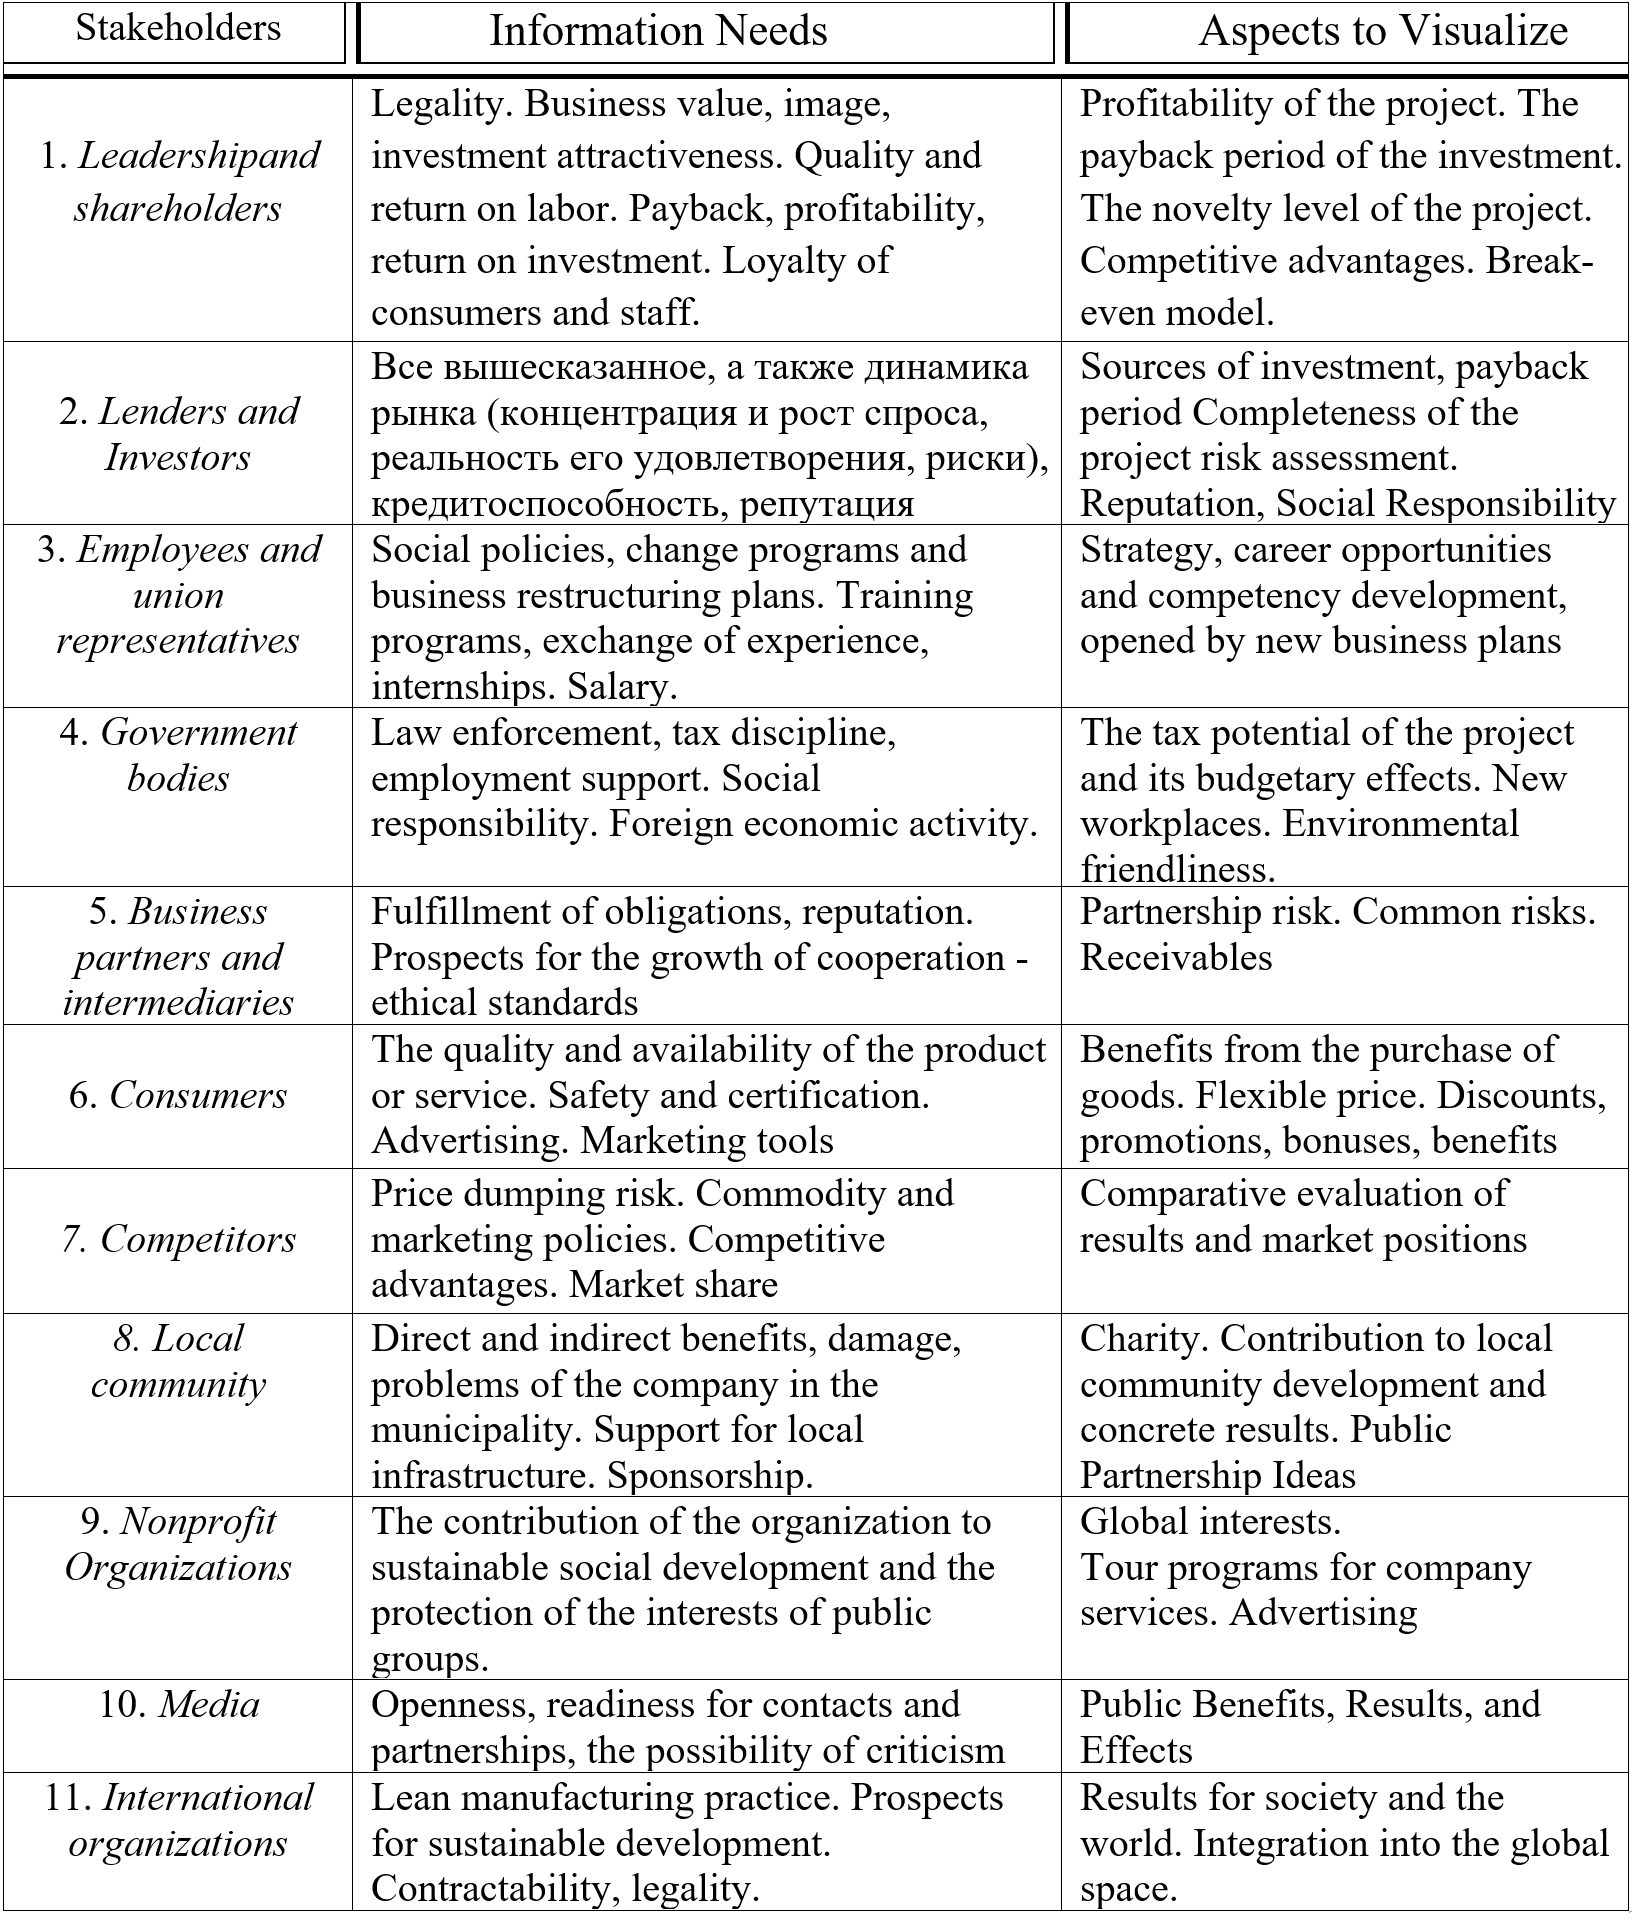
The information needs of the parties will
allow for more thoughtful selection of appropriate cognitive-visual tools for
structuring and presenting an array of information, thereby identifying
implicit knowledge and consciously affect the quality of decisions.
Visualization minimizes cognitive efforts, allows us to discuss promising
methods of visualization in understanding the economic content and functions of
specific business processes (table 3).
Each type of visibility, to one degree or
another, corresponds to certain business areas, graphic techniques, and classic
business analytics models. The user easily moves from the visual image of the
problem being solved, to the mental image-answer, as a result of using his own
knowledge to interpret known patterns. The separation of visualization types
creates the prerequisites for highlighting and concretizing possible promising
methods of cognitive visualization, taking into account the level of user
understanding and the essence of the problem being solved. This explains, for
example, the use of 50 matrices of different directions in management and
marketing, which allows us to point out their advantages for planning:
multifunctionality (information, comparison, control, diagnostics); targeting
(attachment to a production or market situation); fixing of alternative options
taking into account the prevalence of positive or negative conditions.
Numerous psychological and pedagogical
studies, in particular the works of academician A. Verbitsky [12], it was
proved that visualization is much wider than simple visual perception, it
organizes analytical and cognitive activities at the stage of perceiving and
processing information, and then it successively affects the depth of
understanding of models and provides meaningful new knowledge. Let us make an
assumption that management planning, as an abstract thought process, is less
focused on visualization, and suggests its maximum combination with cognitive
and cognitive activity, leading to critical thinking, rethinking and subsequent
transformation of specific data (Syrina T.A., 2016) [13], possibly through the
construction of «associative images» (Manko, 2009) [14]. This assumption was
used by us to search for effective cognitive techniques for arguing the
provisions given in the main sections of the business plan.
A business-plan is characterized by goal
setting, duration, limited resources, coordinated interaction of responsibility
centers and a set of indicators (technical, economic, financial, industrial,
social). We assume that these characteristics objectively reflect the existing
requirements for the selected visual content. The choice of graphic models and
images is of fundamental importance, because only well-chosen expressive means
in the conditions of objective limited short-term memory (due to the
supplanting effect of subsequent characters) provide his motivation for
constructive dialogue and focus on the desired result. The business-plan should
clearly define the sections and detail the text in them, highlight the aspects
of greatest interest for visualization and consider the sequence of
presentation of graphic models and illustrations. An analysis of the
literature, recommendations of various financial institutions and business
planning practices allows us to determine the fundamental sections of the
document as objects of mandatory and effective cognitive visualization (Fig.
1).
We describe the key aspects of these sections:
1. Production plan: -
industrial site infrastructure, past experience in implementing investment
projects; power input schedule; critical volume of production; dynamics of
indicators of the state of fixed assets and staffing.
Table 3. Visual methods
in the presentation of the project (compiled by the author on the basis of
visual classification [5])
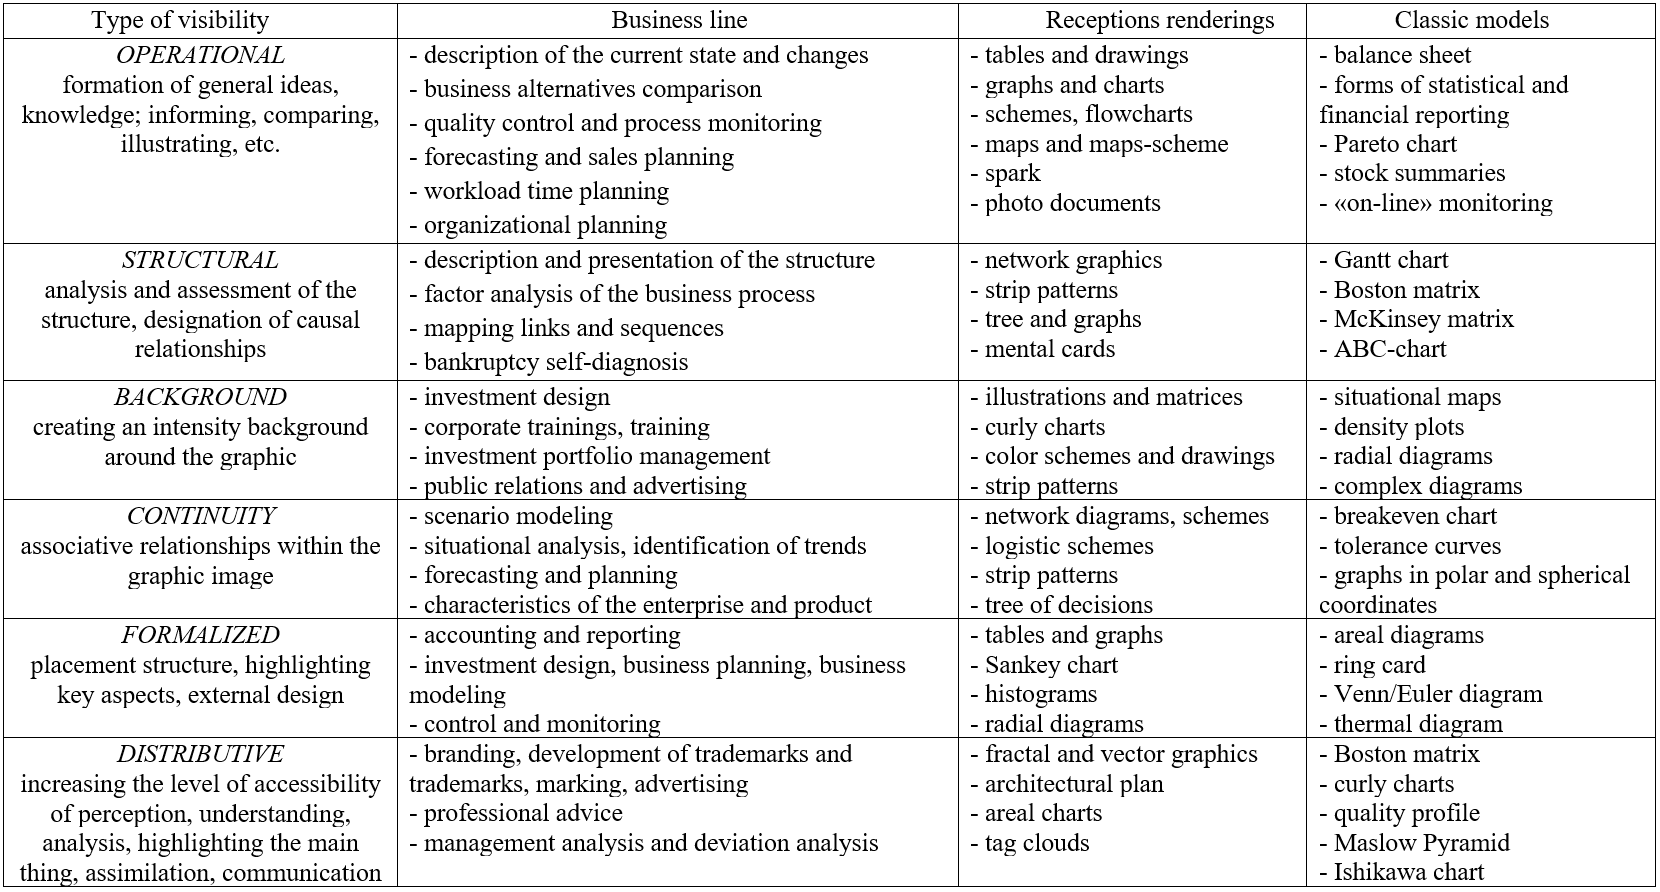
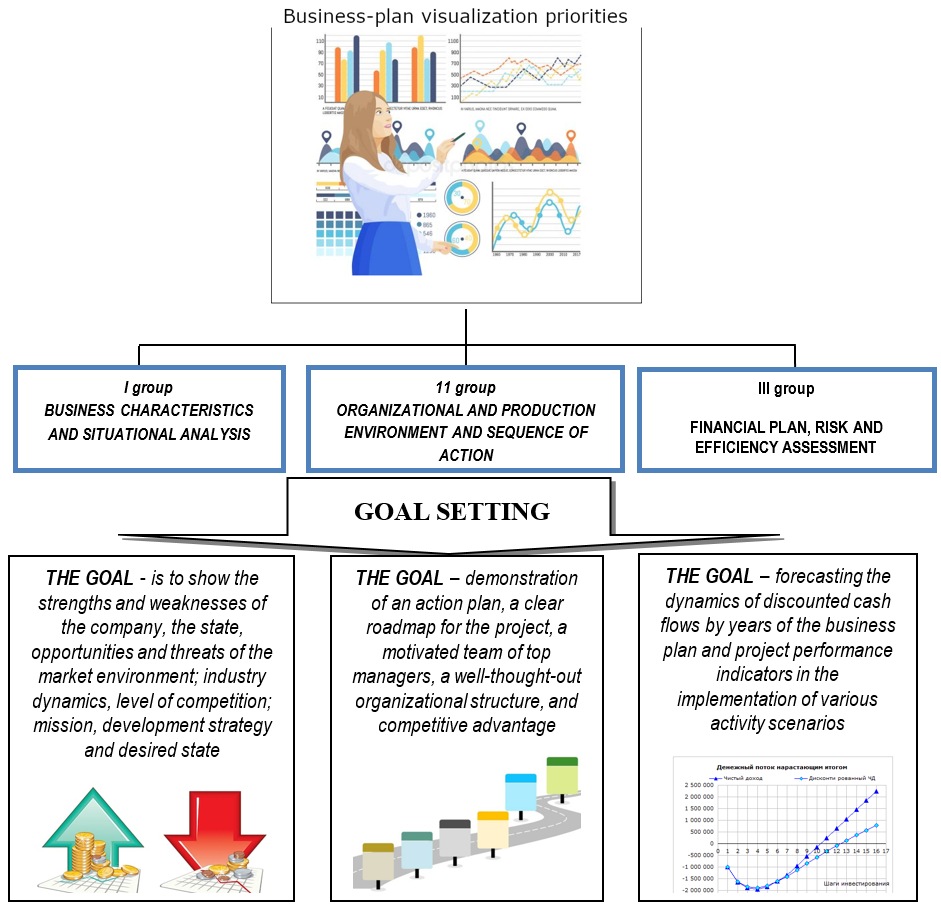
Fig. 1. Sections of the business-plan
as objects of mandatory visualization
2. Characteristics of the product,
industry, enterprise: organizational structure and top management; the most
important characteristics and product samples; compliance with standardization
and certification requirements; life cycle phase; business environment
dynamics; substitute products and related products and services, competitive
advantages.
3. Marketing plan: market
capacity and growth; price elasticity of supply and demand; market
segmentation, market share of firms; non-price factors affecting supply and
demand; distribution channels; upper and lower price limits; marketing mix and
competitive advantage of the product introduced to the market.
4. Financial plan: cash flow
balance (with a return on investment); structure of investment sources (with
mixed financing); repayment schedule for financial obligations; payback period
of investments; performance indicators.
5. Risk assessment:
project sensitivity analysis schedule; risk curves or risk maps for key types
of project risks.
Let's look at a few
examples.
Example 1. Break-even
chart. This is a simplified visual model of the effectiveness of
commercial activity, when an organization that does not reach and does not
exceed the breakeven point is not effective. The break-even chart is presented
in the production section of the business plan to justify the volume of output
and sales of products (services) in the short term and subsequent planning of
sales prices and calculation of the payback period of investments. The model
successfully demonstrates the «project security» for the investor and the
entrepreneur’s ability to repay the loan in a timely manner with a positive
market environment.
She shows:
- for the enterprise - the
smallest volume of output at which costs are fully offset by revenue, and
subsequent production makes a profit;
- for a service company -
the volume of services (works) rendered, which allows to fully cover existing
losses and receive income from subsequent activities;
- for a shopping facility
- the smallest value of goods turnover required to cover own expenses;
- for a portfolio
investor - the length of time during which the profit received from the
transaction (investment in securities) covers the costs of the transaction, but
in the subsequent period, the preservation of assets will already bring legal
income.
The uncertainty of the
competitive environment imposes restrictions on the scale of the business,
therefore, when planning, it is necessary to clearly define the limits of
capacity (cost), which will allow the investor to make sure that the rational
use of limited resources and the concentration of intellectual efforts to
ensure its most important requirements. Suppose that an entrepreneur chooses a
site for the construction of a workshop for the production of products. The
location determines the costs (primarily transport and energy), so the
preferred option is the organization of the process with a smaller break-even.
Comparison of alternative sites is carried out under comparable conditions,
i.e. with the same volume of production. Two curves are built in the graph
field — the revenue line and the total cost line, and the point of their
intersection corresponds to the critical volume of production (Fig. 2). A
profit zone is fixed to the right of the sign point, and a loss zone to the
left, which facilitates the choice of the preferred option. In our example,
this is the second site: annual losses are covered by the smallest output of
430 tons instead of 700 tons.
A decrease in the
break-even point means a quick payback of the project and lower investment
risks, and a noticeable expansion of the profit zone with equal capacity (1200
tons/year) means a large amount of income and an increased margin of financial
strength. There is also a high probability that the size of the allowable loss
of revenue while reducing demand and reducing the level of capacity utilization
by 15-20% (up to 950-1000 tons/year) will not lead to the loss of all income. This
important conclusion can easily be made on the basis of a visual representation
of the position of the profit zone on the chart. Another significant point
concerns the management of production costs - in the same conditions for the
organization of production, the use of effective control and the use of lean
manufacturing technology at the second site can provide greater resource
savings and greater additional income.
Break-even is a
significant signal about the sufficiency of the project for specific stakeholders.
For ordinary shareholders, this is the gross profit zone, which shows that the
project ensures sustainable reproduction, timely payment of dividends and
predictability of their size, and for preferred shareholders, this is the zone
of minimal estimated profit, which demonstrates that the project guarantees
dividends even in an inefficient mode. For
lenders and borrowers, the model fixes the limit of the project's ability to
provide financial obligations at the expense of the remaining own property, and
for supervisory and controlling authorities - the conditions for achieving
design capacity, which means ensuring employment, stability of tax revenues to
budgets of all levels, saturation of the consumer market with quality products
.
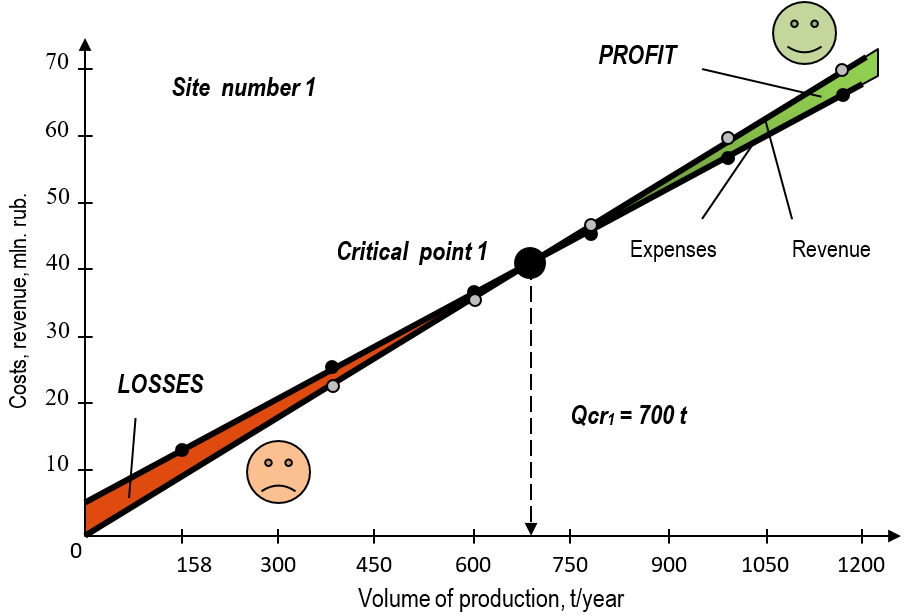
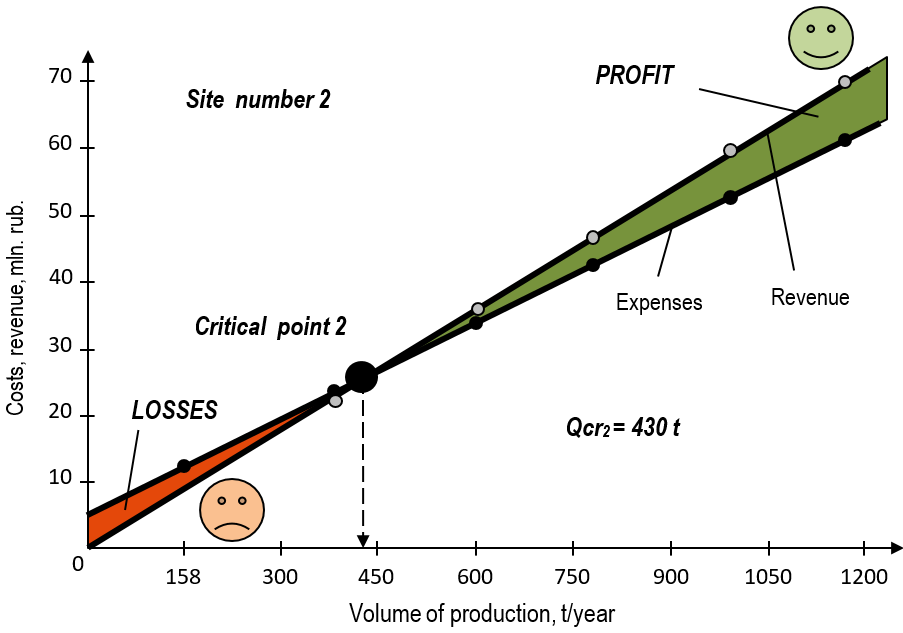
Fig. 2. Comparison of sites for the
implementation of a business-plan at the breakeven point.
Example 2. The
McKinsey Matrix. One side of the matrix captures the competitive position
of a strategic business unit, its relative advantage. The other defines
the attractiveness of the industry in which this business unit operates.
The matrix has a dimension of 3x3 (9 quadrants), which allows reflecting three
gradation levels of the degree of manifestation of key characteristics - high
(strong), medium, low (weak). Business units are reflected in the quadrants of
the matrix in the form of circles with centers at the intersection of the
corresponding indicator values. The size of the circle is proportional to the
volume of sales in this market segment. Three areas are formed - winners
(leaders) of the market, losers and stable agents (diagonal).
Suppose that in a highly competitive
regional market for information services, the chief manager of an Internet cafe
analyzes the competitive positions of the following basic services: 1 -
connecting personal devices to a power outlet (in comfortable conditions); 2 -
Internet access (several Wi-Fi points); 3 - Skype communication; 4 - network games;
5 - preservation, duplication, printing of information; 6 - use of software
packages; 7 - sale of coffee, tea and chilled drinks. Consumers -
schoolchildren, students, entrepreneurs, managers, teachers, retirees. To
characterize the services, their quality, innovativeness, market share, unit
costs and staff competencies were chosen, to characterize the attractiveness of
the industry, the size and growth rate of the market (demand), differentiation
of services, consumer value for the company, level of competition and the
average industry profit margin. The McKinsey matrix is shown in Fig. 3. She
effectively describes the situation, allowing us to state that all services are
profitable, falling into the zone of attractive market segments. Three products
(Internet access, network games, drinks selling) fall into the leader area,
other services are viable and occupy stable middle positions, except for one
(No. 3 - Skype communication). In general, the competitive position of Internet
cafes can be called good, and managers should maintain their positions, make
selective investments in the development of the «connect personal devices to
the outlet» service, for example, increasing the comfort level of seats and the
service culture. The service «communication on Skype» is the most «bottleneck»
of the company, its further improvement is required. Individual segment colors
and circle sizes create a harmonious and harmonious design of the model, and
its analytical potential can be enhanced by the development of interrelated
indicators that comprehensively characterize the new business process from the
standpoint of management efficiency, level of frugality, scientific
organization of labor, efficiency of working capital management,
creditworthiness, and the effectiveness applied systems of marketing, market
promotion and support of products, risk assessment of unclaimed services.
Example 3. Sankey diagram.
In the Google Analytics system, flowcharts are widely represented for
describing business processes. In particular, the Sankey diagram, those main
idea is to visually divide the whole into its component parts. This
specific chart forms the clarity, accuracy and speed of solving the analytical
problem, and also enhances the visual fixation and readability of the graph. It
has been shown that in landscape planning, the combination of categorical maps
and Sankey diagrams reduces the complexity of the analysis, increases clarity
in the presentation of the initial data and forecast scenarios, and activates
communication between researchers and practitioners (Cuba N. 2015) [15]. It is
noted that the effectiveness of perception is achieved by taking into account
the context and semantic relationships between numbers and graphic images,
color coding, changing the composition and shape of flows (V.V. Laptev, 2017)
[16]. The Sankey chart can find its place in the business plan when assessing
possible losses of raw materials or cash resources distributed between risk
events to support the conclusion about the feasibility of the investor's main
interest - guaranteeing a refund and interest on time.
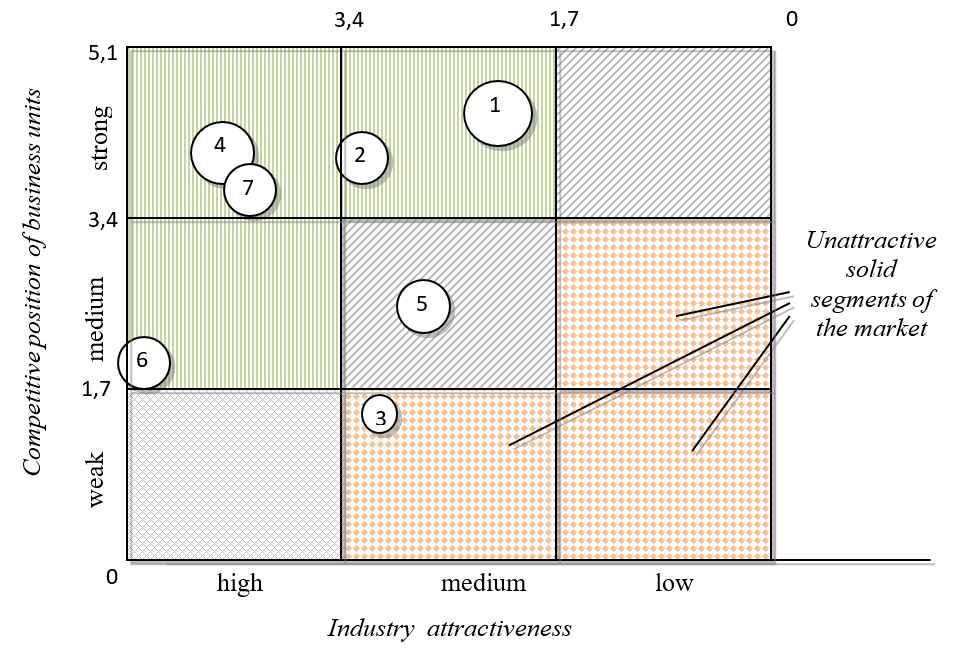
Fig. 3. The McKinsey Matrix for Internet
cafes
Suppose
that the size of the insurance reserve and the distribution of credit risk associated
with natural, human, inflation, and bank risks are justified (Fig. 4). The
diagram shows the process of generating cash flows from the totality of
possible risks, taking into account their probability in all functional
processes (integrate flows into a network); identify the dominant flows and the
required volume of guarantees (demonstration of security of obligations);
detect weaknesses of the idea and evaluate the effectiveness of the measures
taken. By the width of the segment, one can judge the probability of risk or
the size of the losses, the sequence and direction of flows are in the form of
an arrow, and the flow intensity for a certain period is the size of the arrow.
Example
4. Project risks. Traditionally, the bank’s credit department specialists
expect to see a risk curve or risk map in the business-plan. However, for
short-term local projects of small business, simpler methods of graphic
illustration that take into account the psychophysiological characteristics of
the perception of elements grouped in a certain way, the so-called gestalt
principles, may be interesting [17]. Signs located close to each other
(principle of proximity), similar in size, color scheme or shape (principle of
similarity), close in time and space (adjacency) are well perceived. At a
conscious level, a more accurate perception of the length and two-dimensional
arrangement of signs, their orderliness, the importance of saturation,
brightness, contrast of color perception, as well as a combination of numbers
and words in the image (Few S., 2006) [18] were noted. This allows us to assume
that a figurative symbolic representation of the probability of risks in a
business plan may be as successful in initiating adequate conclusions and
actions as a bar chart.
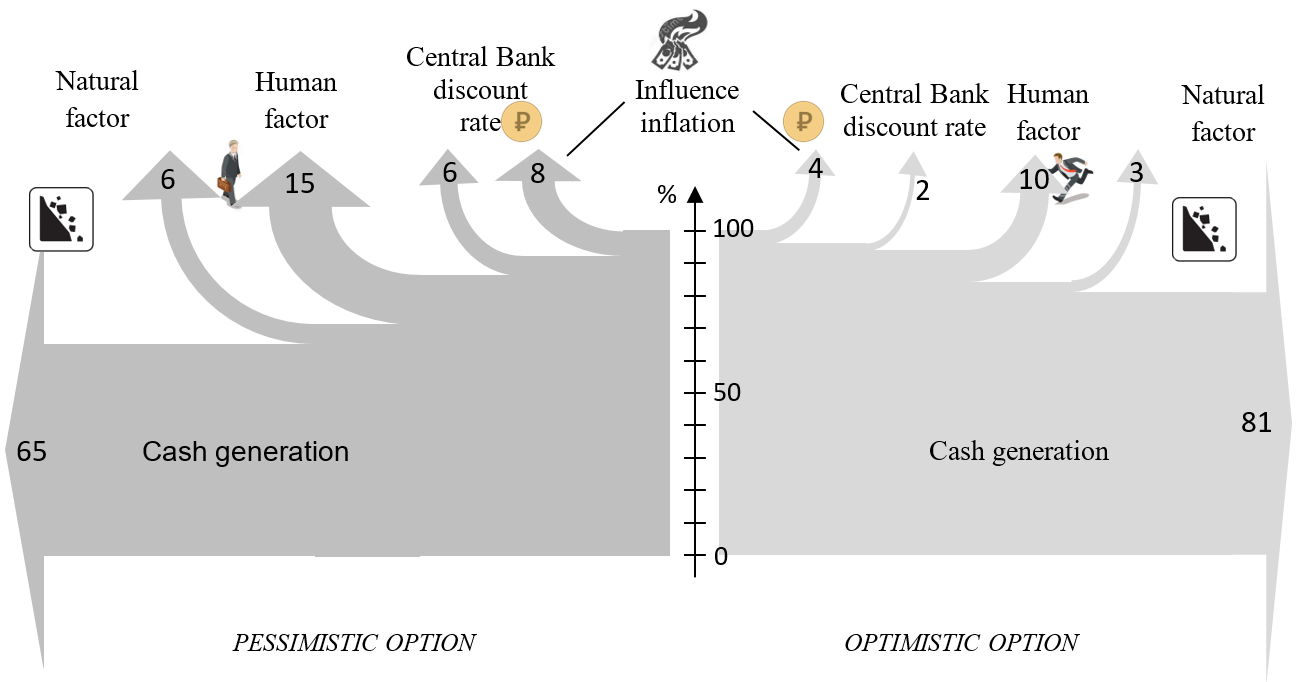
Fig.
4. Sankey chart - project credit risk allocation
Suppose a successful
company plans to create a new production line. Experts identified five types of
risk: errors in the construction of logistics schemes for goods flows; lack of demand
for products; insufficient liquidity (exceeding the project budget);
inefficient use of property and incompetence of staff. Risks
are ranked by degree of probability in coordination with possible damage, and a
bar graph and a sign model are used to illustrate (Fig. 5). The bar chart helps
to quickly understand the distribution of risks by increasing probability of
occurrence and limit their list, and the sign simplifies the model without
changing its essence and purpose, and increasing the color intensity makes it
easy to identify a trend and remember priority risks.
Example 5. A client
asset. According to P. Drucker, there is one legitimate justification
for the purpose of the business - this is the creation of a satisfied client.
Today, customer focus is the foundation of the mission of commercial
organizations, and the effective management of a client’s asset is becoming a
key condition for profit. Potential partners of the project are aware that in
the conditions of globalization in competitive markets, differences in quality,
price and assortment of products are leveled out, the interests and
expectations of customers, who increasingly make purchasing decisions based on
non-price factors, become priority. There is increased interest in forecasting the
frequency of purchases and the distribution of customers.
Different methods of
visualizing a client’s asset are possible - three-dimensional models (checks,
shops and the number of purchases by the breadth of the basket and in the
context of «traditional» and «non-traditional» purchases); models of groups of
abnormal purchases (details of customers differing in consumer preferences);
models of project results. Market segments can also be compared: a) a bar graph
- a forecast of the dynamics of sales volume by years; b) a linear graph - a
forecast of the dynamics of a client asset; c) pie chart - structure of a
client asset; d) the sign of Varzar - the annual amount of revenue from the
sale of the same volume of goods on the average bill (Fig. 6).
A variety of graphic
images retains active interest, provides constructive criticism, search and
analysis of the problem from different points of view and interests, making the
discussion of a new commercial idea comprehensive and complex. Existing design
patterns help to choose customers by type of consumer behavior and active sales
technologies (Ekhlakov Yu.P., 2018) [19], and visual analysis, influenced by
the interests, perceptions and awareness of the user, initiates new questions
and assessments, criticisms, and hypotheses (Ware C ., 2012) [20].
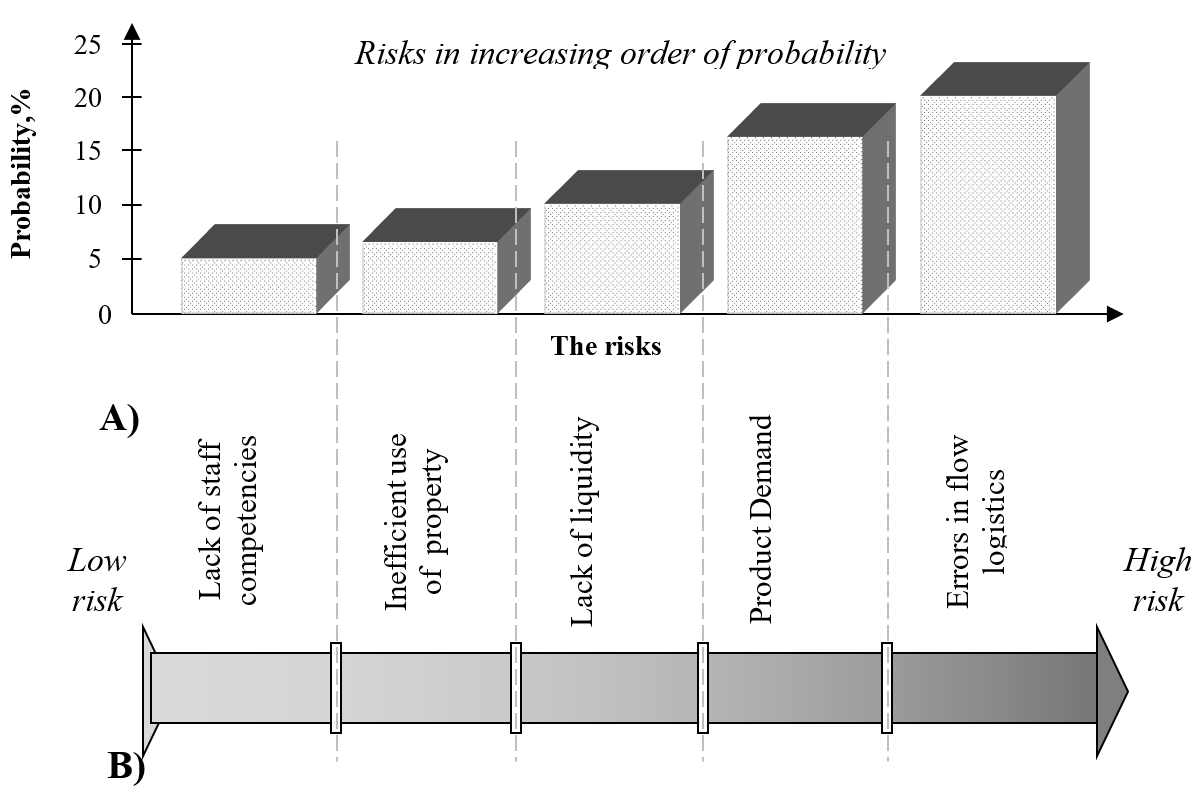
Fig. 5. Visualization of
project risks: A - chart form, B - sign form
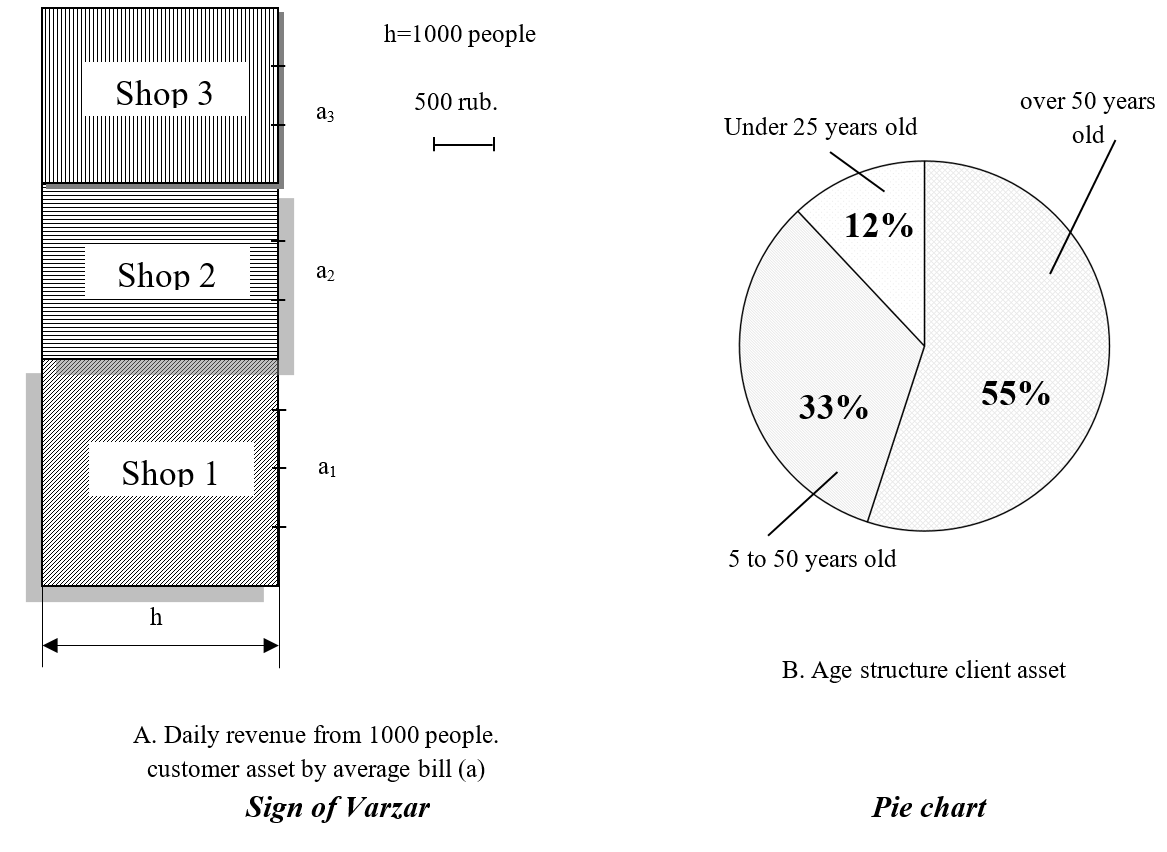
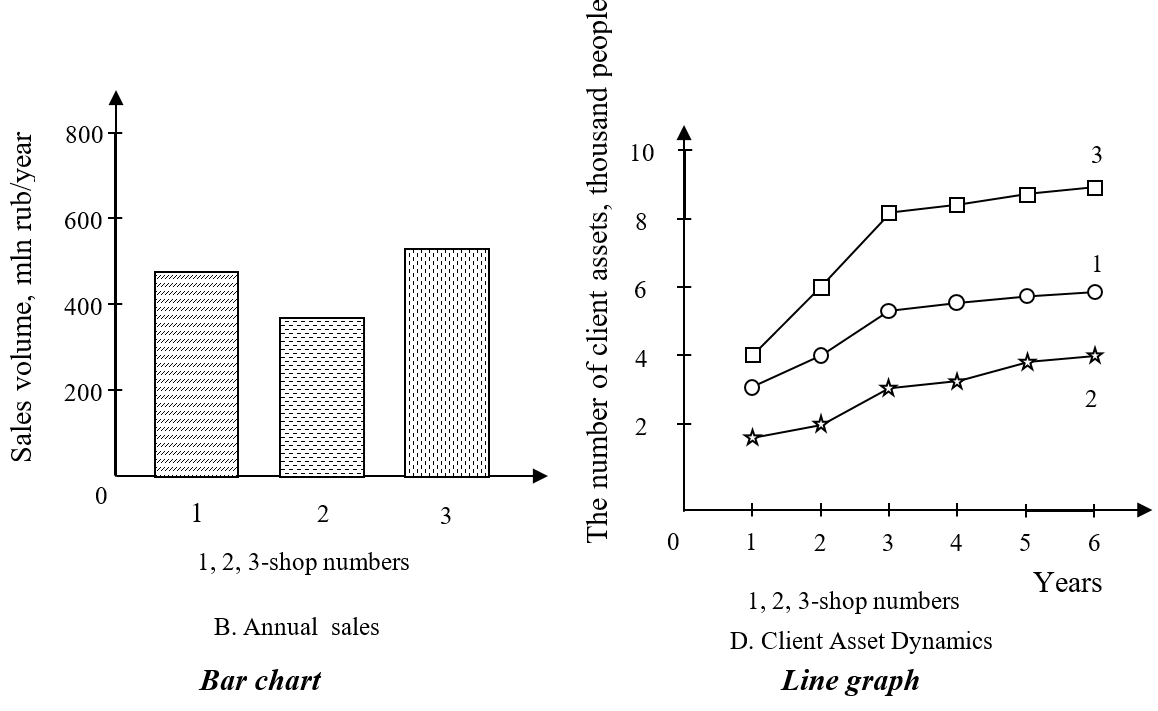
Fig.
6. Variants of visualization of information on client assets
and sales
A competitive innovative economy increases
the relevance of the creative component of business-planning, implemented,
inter alia, by a set of visual cognitive operations and mechanisms for arguing
the commercial feasibility and benefits of the proposed activity, despite the
risk and limited resources. The project should be understandable to a wide
range of people, therefore visual content helps to avoid technical details,
gives realism, conciseness, persuasiveness, an accompanying emotional
background and even a sensible element of advertising, and, most importantly,
activates imaginative thinking and evokes associations that turn into a
positive attitude towards innovation. The above examples show the feasibility
of expanding graphical models to support a business plan.
1. Gavrilova T., Alsufyev A.,
Janson A. S. Modern notations of business models: visual trend /foresight,
2014, vol. 8, № 2, pp. 56-70.
2. Kozubovsky V. M. General psychology:
cognitive processes. Minsk: Amalfeya, 2008 – 368 p.
3. Bolter
J.D. Examining and Changing the World of Media /Humanistic Perspectives in a
Technological World. Ed. By Richard Utz, Valerie B. Johnson, etc. – Atlanta:
School of Literature, Media and Communication, Georgia Institute of Technology,
2014, р.
37-40.
4. Zakharova A.A., Shklyar A.V.
Visual representation of different types of data using dynamic sign structures
/Scientific Visualization, 2016, V. 8, No. 4. P.28-37.
5. Madigan S., Rouse M. Picture
memory and visual generation processes. The American Journal of Psychology,
1974, Vol. 87, № 1-2. P. 151-158.
6. Kuznetsov S. D. database Basics. M: INTUIT, 2005.
488 c.
7. Loginov G. O., Popov E. V.
Matrix methods of strategic planning of the company /Management in Russia and
abroad, 2004, № 2, Pp. 103-114.
8. A Guide to the Business Analysis
Body of Knowledge® (BABOK® Guide). Version 3. Toronto: International Institute
of Business Analysis, 2015.
9. Langacker
R. A course in cognitive grammar Manuskript; Preliminary draft. San Diego:
UCSD, 2000. - 73 p.
10. Pirolli P., Card S.K.
Information foraging in information access environments /Proceedings of CHI
’95, ACM, 1995. P. 51–58.
11. Lychkina N. N. Synergetics and development
processes in socio-economic systems: search for effective model structures
/Business Informatics, 2016, № 1 (35), pp. 66-79.
12. Verbitsky A. A. Active learning in higher school:
the contextual approach M.: Higher School, 1991. – 207 p.
13. Syrina T. A. Cognitive
visualization: the essence of the concept and its role in language teaching
/Bulletin of Tomsk state pedagogical University, 2017, № 7 (172), pp. 81-85.
14. Manko N. N. Cognitive visualization of didactic
objects in the activation of educational activity /Proceedings of the Altai
state University. Series: Pedagogy and psychology, 2009, № 2, p. 22-28.
15. Cuba N. Research Note: Sankey diagrams for
visualizing land cover dynamics /Landscape and Urban Planning. 2015. No. 139.
Pp. 163–167.
16. Laptev V. V., Orlov P. A.,
Dragunova O. V. Visualization of dynamic data structures using flowcharts in
web Analytics /Scientific and technical sheets of SPbSPU: Informatics,
telecommunications, management, 2017, vol. 10, № 4, p. 7-16.
17. Koffka K. Principles of Gestalt psychology. NY:
Harcourt, 1963. 720 p.
18. Few S. Information Dashboard Design: The Effective
Visual Communication of Data. O'Reilly Media, 2006. —
166 p.
19. Yehlakov Y.P., Malakhovskaya
E.K. Patterns of designing the content of a communication message for promoting
software products to the corporate market /Business Informatics, 2018, No. 1
(43). Pp. 50-60.
20. Ware C. Information
Visualization. Third Edition (3rd Edition) Perception for Design (Interactive
Technologies), Morgan Kaufmann, 2012. P. 536.
