VISUAL ANALYTICS AND SEGMENTATION OF COLOR BIOMEDICAL HIGH RESOLUTION CRYO-IMAGING SCANS
N.I. Gavrilov, E.P. Vasiliev, I.V. Khramov, A.A. Getmanskaya, V.E. Turlapov
Lobachevsky State University, Russian Federation
Contents
2. 3D data from microtome cryo-images
3. Direct volume rendering for true-colored dataset
3.3 Dataset decomposition into blocks
3.4 Results in quality and performance
Abstract
The goal of this work is the speedy incorporation of the cryo-imaging into visual analytics for practical medicine and biology, and creation a single solution for both managing visualization and segmenting the data of cryo-imaging in natural colors. In this paper we used the quantization and indexing of the natural colors for the cryo-imaging data as a basis for solving two formulated in the article problems: 1) three times more memory for cryo-imaging data, than for the same indexed data using palette; 2) the transparency control of real tissues which are heterogeneous in color.
We showed here that: 1) when using a palette of 256 colors, built using Linde-Buzo-Gray method, instead natural colors of femail dataset of Visible Human Project (VHP), the image quality losses are not significant (PSNR=44 - invisible for human eye); 2) 3D image quantization is not only the way to reduce dataset size – they showed about twice performance improvement (in frames per second, fps) compared with the visualization of three-channel raw data, and the best performance was achieved by loading the whole dataset as a single block (up to 108.9 fps for the dataset and GeForce GTX 680); 3) the high resolution of cryo-images makes rendering artifacts invisible to the human eye; after indexing the image quality is enough and trilinear interpolation becomes unnecessary, because it increase PSNR up to 45.5 db only, but programmable trilinear interpolation leads to twice downfalls the performance; the direct use of indices interpolation via hardware gives a the loss of the image quality which noticeable to eye; 4) quantization of natural colors give us good possibilities in the both opacity control and segmentation; a method for segmenting (classifying) a voxel tissue according to the normalized histogram of the indexed colors (NHIC-method) from its neighborhood is proposed and investigated (on the femail dataset from VHP); its possibilities were investigated in the range of both the neighborhood radius and the decision making threshold.
We plan to continue research in this direction and create algorithms and software to turn NHIC method into an open technology for cryo-imaging, biomedicine and education based on it.
Keywords: cryo-imaging, high resolution, visual analytics, scientific visualization, segmentation, classification, opacity control.
1. Introduction
The images generated by computed tomography (CT) and Magnetic Resonance Imaging (MRI) exemplify types of data that actively used in the reconstruction of volume models for human organs. Serious limitations in this and in the tomography visual analitics are made by the relatively low accuracy of both computed and magnetic resonance tomography (of the order of 0.5 mm), as well as a high level of noise in the image. At the same time, in recent years the area of cryo-imaging is actively developing. This area is of exceptional importance for visual analytics in biology and medicine, both in itself and in forms new invaluable opportunities for the creation and personification of biological models. In presens of high resolution cryo-imaging atlas-data, the role of the source of personal data can be successfully executed by the tomography or ultrasound.
It may be considered that modern cryo-imaging in the interest of human biology began with the Visible Human Project (VHP), (2001) [1]. The VHP was conducted by the US National Library of Medicine (NLM) and consisted in obtaining sectional images of the human body. The planning of this project began in 1989. In 1994 the data set for the male model became available and, in the following year, the female model was completed. In addition to the CT and MRI images, 1871 cryosections of Red-Green-Blue (RGB) images were collected. These images allow visualizing the interior of the anatomical structures in true color. Two other similar projects followed: The Visible Korean Human, (2006) [2] and the Virtual Chinese Human, (2006) [3]. The results of VHP have found wide application in medical and biological education as part of the well-known digital anatomical table from Anatomage (http://www.anatomage.com/table-alpha/). This table was first handed over for experimental use and development at Stanford University in May 2011. Today Anatomage offers 4 gross anatomy cases, more than 20 high resolution regional anatomy cases, and more than 1000 pathological examples, including animal cases, with resolution from 0.4 up to 0.1 mm.
There is also a significant interest in imaging of small animals (Wilson, 2008) [4], particularly mice since the genetic manipulation of mice is an extraordinary tool in modern biology. In parallel, imaging techniques are being developed targeted specifically to the small animal (cryo-microtome with section thickness adjustable between 2–40 μm and a maximum specimen dimension of 250mm×110mm×50mm). Unlike every other imaging technique, cryo-imaging allows to image an entire mouse at micron order resolution. Such a high resolution may be estimated from the fact that, for example, the width of one micro-column of the mouse brain cortex is about 22 microns. Highest cryo-imaging resolution (micron-order) may be characterized also as close or the same as possibilities for optical microscopy of tissue (as 3D histology) and of cell structures.
In 2011, the Russian version of the cryo-microtome with similar characteristics was patented in Russia [5]. It was more budget variant without microscope on the base of special photocamera Cannon 5D with lens Canon EF Macro USM:180 mm f/3.5, 4 800 x 2 600 pix. Parameters of microtome: section thickness (depth of milling for each next layer) adjustable between 8–20 μm; x,y-resolution = 8 μm (determined by camera); maximum specimen dimension - 150mm×100mm×100mm) (Terpilovskiy, 2015) [6].
Thus the ideal rendering system should offer real time 3D visualization cryo-imaging data at a very high native resolution (Roy, 2009-2010) [7,8]. Since the 90s, the Direct Volume Rendering (DVR) shows itself as an efficient tool for the real time 3D visualization and analysis of volumetric datasets such as tomogramms of different types, especially with growth of graphics cards possibilities. So, we can choose DVR as base for real time of color cryo-imaging scans. But there are a number of features of color high-resolution cryo-scans that must be resolved by possibilities of visualization software. These are the following features:
1) a large amount of raw data, which is usually impossible to place simultaneously in the memory of the GPU;
2) 24-bit depth of the color range of the source data (3 channels x 8 bits per pixel): three times more memory than the gray image;
3) the problem of controlling the transparency of the real tissues which are heterogeneous in color and the associated problem of segmenting such tissues.
Problem 1 has a simpler solution: its solution is known on the basis of block decomposition of the visualizing data volume (Gavrilov, 2012) [9]. However, it is useful to investigate its solution for modern GPUs.
In order to solve the problem 2 and reduce three times the required memory, we can go from a color image in True Colors to an indexed image via color quantization algorithms. Color quantization algorithms may be grouped into splitting algorithms (Bloomberg, 2008) [10] and clustering-based algorithms (Schneider, 2003) [11]. While the first group has the advantage of having fast encoding algorithms, the second group gives much better quality, i.e. higher PSNR. To obtain an optimal palette for our dataset we use Linde-Buzo-Gray (LBG) algorithm [12, 13, 11].
Problem 3 was solved from the moment of the beginning of cryo-imaging and up to the present time in one way or another: using only hues and baricentric coordinates with RGB-basis (Roy, 2009) [7]; using linear combination of color and color distance gradient (Gargesha, 2009) [14]; using color-difference nonlinear color models L*u*v* (Falk, 2017) [15]; .... Unfortunately, none of the solutions can be considered complete and final. We will also investigate this problem in this paper.
In all cases, we will be interested in the performance problem and how quantizing data can improve performance and provide segmentation of cryo-image data.
2. 3D data from microtome cryo-images
There are two classes of cryo-imaging data: class of sub-millimeter resolution, and class of micron resolution. First class of microtome cryo-images with sub-millimeter resolution result in gigabytes of volumetric data. The Visible Human project [1] is creation of complete, anatomically detailed, three-dimensional representations of the normal male and female human bodies. A male and a female cadavers were frozen in a special box-camera with a contrast colored liquid and cut-off (or by milling) layer by layer via unique precise microtome, and each of layer was photographed and digitized in color. RGB photo images have higher resolution than CT or MR scans, thus requiring more GPU memory and computational capacities for volumetric visualization. In this paper we use the female dataset of size 920x840x561 voxels (1.3 Gb in True colors) with 0.33х0.33х0.66 millimeters voxel spacing (freely available at http://www.caskanatomy.info/browser).
An example of a second class of cryo-images with micron resolution is given in (Wilson, 2008) [4], and also in (Roy, 2009-2010) [7, 8]. Potentially if we have the specimen dimension of 250mm×110mm×50mm= and uniform resolution equals 10 microne, than size of cryo-images (S) will be about 4 TB. Real small mouse cryo-imaging data [4] stitched from tiles into 2D image stacks amounted to a data size of >60 GB. One layer of russian cryo-microtome [5] give us 4800 x 2600 x 3B = 37.44 MB/Layer. End ordinary number of layers for a mouse such as 200 determines size of cryo-images data equals about 7.5GB. Frequently such a large dataset cannot be loaded fully in the GPU or CPU memory of the visualization workstation. In particulare the authors of [4] converted the stack of images into a Large Data Access (LDA) volume inside there customized AMIRA Visualization software.
3. Direct volume rendering for true-colored dataset
Direct volume rendering (DVR) is widely used in scientific visualization and medical imaging, especially its GPU-based implementation. If source dataset is a set of true-colored high-resolution layers, then it is not needed to create statistically formed reference image (2015) [16] for quality estimation of the result (Hore, 2010) [17]. We can use the source image as the reference-image. But RGB-dataset require 3 bytes per voxel thus requiring gigabytes of GPU-memory to store them, in the same time the texture mapping is also an efficient method to visualize this kind of data (Huang, 2000) [18].
Since the voxels themselves are the colors, there is no need for a color transfer function. In order to see internal data features somehow, we have to assign an appropriate opacity value to each voxel, which can be done using opacity transfer functions (OTF) [1, 7]. By default, for visual 3D reconstruction, we can use, for example, an OTF-function in which the opacity is linearly depends on the color brightness taking into account the sensitivity of the eye:
![]()
As has been said, there are approaches in this area directed onto opacity control, which use the linear combination of color and color distance gradient [14], or use special widgets to remove specific colors in specific color spaces. As example, such widgets may be placed on a volume histogram projected to either the chromaticity u’v’ of the CIE L*u*v* color space or the chroma plane of YCBCR [15].
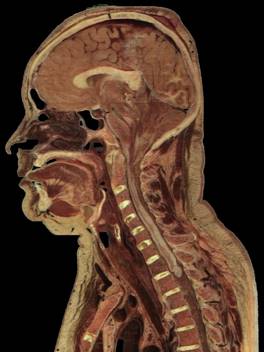
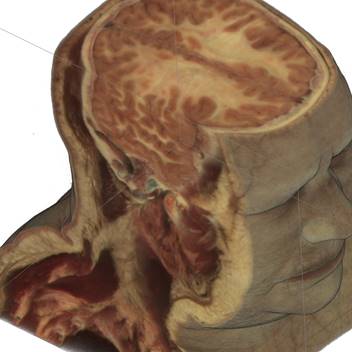
Fig.1. Source female dataset section (left) and spatial Direct Volume Rendering via Ray Casting technique with viewport 1000x1000 pixels, that was used for our benchmarks (right, default opacity). Dataset from Visible Human Project (http://www.caskanatomy.info/browser) [1].
3.1 Color Image Quantization
Color quantization of 3D RGB images is essential, since we can reduce huge datasets by three still retaining the colors [11]. The issue here is to minimize image quality losses, i.e. minimize the difference between original image and the quantized one. PSNR metrics is usually used as the criteria [17], whereas the varying parameter here is color table that contains 256 representative colors, that represent the whole spectrum of original image colors. To compare RGB images PSNR is calculated as follows:
![]()
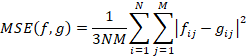
Here |fij – gij| is Euclidian distance between pixels fij and gij in RGB color space. N and M are width and height of the images.
Color quantization algorithm Linde-Buzo-Gray (LBG) [1, 3, 6] to obtain optimal palette for our dataset is an iterative method, practically identical to the K-means clusterization algorithm. On each step it improves current palette, replacing each color xi in it with averaged image pixel colors, that are represented by xi. Palette color represents the closest colors thus breaking RGB space into 256 voronoi diagram cells. Computationally it is advisable to use 3D colors histogram to calculate PSNR on each step, since 3D image data is larger than 2563 cells histogram. The algorithm stops when PSNR–increment less than a given threshold.
After running this algorithm several times with randomly generated starting palette we achieved palette that quantize 3D image with PSNR = 44 db (sufficient quality for visualization). This good result was possible due to comparatively small colors number in the original dataset: 57% of our image space is background (black color). The rest of the colors have more or less equal frequency in the dataset (Figure 3). In RGB space these colors form a thin compact region that occupies 0.2% of RGB space. PSNR for the rendering result 2D image after quantization on Figure 1 (right) is also high (45.5 db).
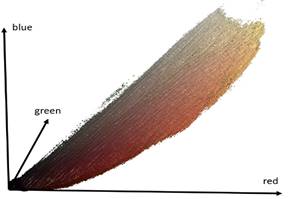
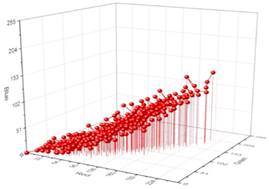
Fig. 2. External surface in color-space that represents the dataset colors. Volume inside this surface covers only 0.2% of RGB cube (left); 256 palette colors for image-colors quantization (right).
The quality of the palette choice is confirmed by the fact that the palette contains even very rare colors for this data set (Figure 3).
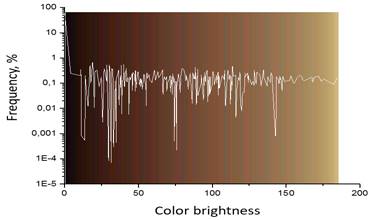
Fig. 3. Palette colors for indexed 3D image, sorted by brightness. White curve shows the frequency for each palette color in dataset.
3.2 Tri-linear interpolation
Trilinear 3D texture filtering allows for fast trilinear interpolation between voxels; this ability is widely used in DVR algorithms for rendering scalar density fields, i.e. CT scans in medicine. Post-classification scheme (Mora, 2002) [19] produces much smoother surfaces than pre-classification scheme, which is also called 3D texture mapping (Huang, 2000) [18]. In the high precision cryo-imaging we have precise RGB input dataset and DVR-algorithm must use pre-classification technique only, which interpolates source colors.
However, indexation scheme does not allow for automated 3D texture filtering since our texture contains color indexes. We also can interpolate indexes: if we sort the colors in the color table by their brightness as shown on Fig.3, in this case we can minimize artifacts. Still the resulting image differs considerably from rendering of the original RGB dataset (PSNR=30.2). Furthermore, if color dataset will contain big areas with blue or green colors then the difference would be even greater, so we decided to interpolate colors via inside shader-program.

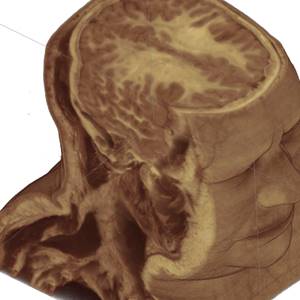
Fig. 4. Rendering quantized dataset, with programmable color trilinear filtering (left); with hardware index trilinear filtering (right).
Programmable trilinear interpolation affected performance considerably (see Table 1), even though we applied the empty space skipping techniques and most of the traversal distance rays performed “fast” samplings, i.e. one sampling from 3D texture only to check whether we should start the regular volume data traversal. On the other hand, datasets from microtome are typically huge which makes roughness of the nearest interpolation scheme less noticeable. Also, both local shading and post-classification are unavailable – all this leads us to the conclusion that the decision without interpolation at all would be the better choice for visualizing huge RGB volumetric datasets.
3.3 Dataset decomposition into blocks
Decomposition into blocks is essential for DVR of huge datasets (Gavrilov, 2012) [9]. Firstly, because there is a memory limit for a single 3D texture; in order to visualize the whole female RGB dataset we had to break it into parts. Secondly, sometimes this division yields performance improvement due to smaller texture sizes.
3.4 Results in quality and performance
For our benchmarks we used the coronal 1000x1000 pixels image view of the dataset, as shown on Figure 1 (right). We compared three DVR approaches:
1. rendering of original RGB dataset, without quantization (its visualization can be considered as ground truth for next two);
2. quantized dataset, without trilinear filtering (PSNR = 44 db);
3. quantized dataset, with programmable trilinear filtering (PSNR = 45.5 db).
We see that all three approaches visually give us the same result (Figure 5).
Additionally, we compared different block sizes to divide the dataset. The block of size 128³ and lower led to rendering performance downfall. As results on Table 1 show, dataset subdivision give us essential advatages: first of all because sometimes the whole RGB dataset failed to load into GPU memory as a single block. In addition, modern GPUs work better with bigger texture blocks, at least the time required to transmit rendering results for each single block one-by-one overweighs the benefits for sampling from a smaller 3D texture. Quantization increased rendering performance considerably (in average by 2.5 times). In all cases the best performance is shown when loading the whole dataset in a single block, if it was possible.

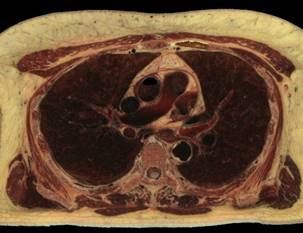
Fig. 5. Rendering of original RGB dataset, without quantization (left); rendering of quantized dataset, without trilinear filtering (right)
Programmable trilinear interpolation coded in shaders affected performance considerably. Our results show average rendering performance downfall by 1.7 times. However, for more complex datasets, where the number of interpolations may grow, the downfall may increase up to 10-folds.
Table 1. rendering performance results given in frames per second, using different GPUs and block size choice. Tested three rendering algorithms: RGB – rendering of the source dataset without compression; quantized – rendering of the indexed dataset, without voxel interpolation; trilinear filtering – using programmable trilinear interpolation in shaders.
|
GeForce GTX 850M |
GeForce GTX 580 |
GeForce GTX 680 |
|||||||
|
Block size |
RGB |
quantized |
trilinear filtering |
RGB |
quantized |
trilinear filtering |
RGB |
quantized |
trilinear filtering |
|
246³ |
2.6 |
7 |
5.1 |
17.3 |
34.7 |
20.4 |
22.2 |
50.7 |
28.6 |
|
512³ |
3.3 |
15.2 |
8.7 |
27.5 |
61.7 |
33.2 |
33.3 |
66.7 |
51.2 |
|
1024³ |
- |
18.6 |
9.6 |
35.6 |
68.9 |
33.6 |
50.1 |
108.9 |
57.6 |
4. Problem of controlling the transparency of heterogeneous-in-color tissues and of segmentation such tissues
We believe that the beginning of the solution of this most difficult of the three problems mentioned above should be counted off from posing this problem as a problem of "implicit segmentation" of tissues or even organs by color, that is, from publication (Gargesha, 2009) [14]. To compute opacity for suitable opacity transfer functions (OTF), the authors use color and/or its gradient values. All needed suitable OTFs were precomputed, and it allows one to select from among multiple color and gradient feature detectors, and to do renderings within the Amira platform with “implicit segmentation” of organs. However, such a set of pre-installed OTF may lose its segmenting and control capabilities on any other set of cryo-images. Therefore, the search for a solution to problem 3 continues at the present time.
We propose a solution of problem 3 on the basis of quantized color. By this way, each of the tissues has a unique normalized hystogram of quantized colors (colol key of tissue). This vector key may be the same along all the tissue, or in its local area only. For the determination of the tissue key for the first time, we must point to the local point of the tissue and pick here sample of its texture. This process can be organized similarly to working with the "Magic Wand" tool in an Adobe Photoshop environment. The larger the area of living tissue, the more components will have its key. We may see (Fig.6) examples of such normalized hystograms for Fat, Skin, Bones on the background of the palette, and that there is sufficient difference between these hystograms. It means that the hystogram can be used as a unique issue key.
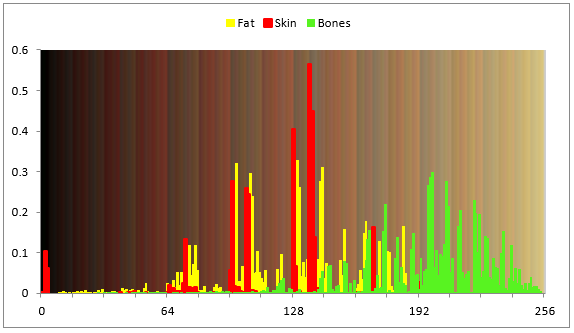
Fig. 6. Normalized hystograms of Fat, Skin, Bones on the background of palette
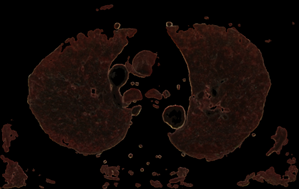
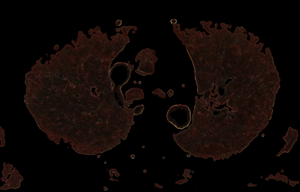
The procedure for checking the visibility of a current voxel with this type of "tissue key" can not be limited to sampling and testing the value of only its one. To make a decision, a representative neighborhood of the current voxel must be selected. As such a neighborhood, we may study neighborhoods in the form of a cube (or smoothed cube) with the size of the edge: 5, 7, 9. As a criterion for making a decision, we use the scalar product of the "tissue key" by the vector of the normalized histogram of the neighborhood of the current voxel (that like the action of a perceptron). The images of the tissue keys and the size of the threshold for decision making must be studied. Some results of such study we may see on the Fig.7 and Fig.8. From Fig.7 we see, that: 1) at t = 0.3 more than 90% of fat was removed, but there remained small single-color areas corresponding to the colors of fat, but only in one of the spectral components of the "key"; 2) decreasing of t from 0.3 to 0.2 leads to the fat residue significantly decreased; 3) an increase in the size of the rib of the cubic tested area from only 5 to 7 leads to complete removal of fat on all area. The most rational implementation of the procedure is as preprocessing with the possibility of accumulating the result in the form of 3D masks turn-on (add) and turn-off (subtract) voxels. The next example of the study is the visualization of only a given organ (tissue), also specified by the "key"-spectrum of quantized colors. The dependence of the result on the array of values of two parameters is investigated: the length of the edge of the sample cube (e); threshold value (t). The results are shown on Fig. 8. You may see here that the inner part of the lungs is successfully selected in using a cube with an edge 5 and a cube with an edge 9, but the cube "9" more successfully segments the boundary tissues. The number of defects at the boundary decreases along with the decrease in the threshold and is minimized at t = 0.1. The result of segmentation and visualization is well controlled by parameters. Small areas of muscle with dark coloration are also segmented (erroneously) as lung tissue. To eliminate this error, the muscles may be pre-segmented and then excluded from consideration by the appropriate mask.
 a)
a)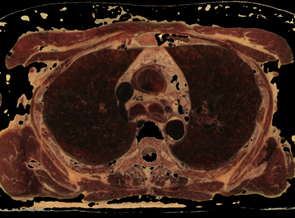 b)
b)
 c)
c) 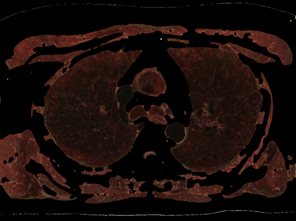 d)
d)
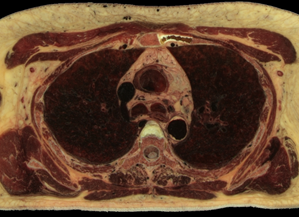
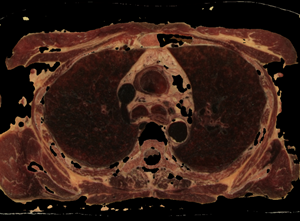
Fig. 7. Control by cube edge size (e) and threshold (t) value for fat opacity changing in the subtraction mask: a) source state; b) e=5, t=0.3; c) e=5, t=0.2; d) e=7, t=0.18
 a)
a) 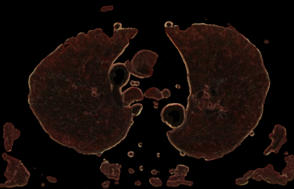 b)
b)
 c)
c) 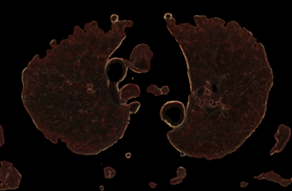 d)
d)
Fig. 8. Control by the sampling cube edge value (e) and threshold value (t) for Lung opacity changing in the addition mask: a) e=5, t=0.1; b) e=9, t=0.1; c) e=5, t=0.2; d) e=9, t=0.2;
5. Conclusion
The motivation of this work was the recognition of the importance of the speedy incorporation of the cryo-imaging apparatus into practical medicine and biology, the importance for the full development of these regions, includs the problem segmentation and quantification of 3D abnormalities to automate diagnosis [16]. There was also an understanding of the need for a single solution for managing visualization and for segmenting the initial data of cryo-imaging.
In this paper we used the quantization and indexing of the natural color of initial data of the cryo-imaging as a basis for solving two formulated at the beginning of the article problems: 1) three times more memory for cryo-imaging data, than for the same data using palette; 2) the transparency control of real tissues which are heterogeneous in color.
Also, as a result of the study, we found that:
· When using a palette of 256 colors, built using Linde-Buzo-Gray (LBG) method, instead natural colors of femail dataset of Visible Human Project (VHP), the image quality losses are not significant (PSNR=44 - invisible for human eye).
· The results of performance measurement showed that 3D image quantization is not only the way to reduce dataset size – they showed about twice performance improvement (in frames per second, fps) compared with the visualization of three-channel raw data, and the best performance was achieved by loading the whole dataset as a single block:
|
|
GeForce GTX 580 |
GeForce GTX 680 |
||
|
RGB |
indexed |
RGB |
indexed |
|
|
Performance [fps] |
35.6 |
68.9 |
50.1 |
108.9 |
· The high resolution of cryo-images makes rendering artifacts invisible to the human eye. After indexing the image quality is enough and trilinear interpolation is not needed, because it increases PSNR up to 45.5db only, but programmable trilinear interpolation leads to twice downfalls the performance; the direct use of indices interpolation via hardware gives the loss of the image quality which noticeable to eye.
· Quantization of natural colors give us good possibilities in the both opacity control and segmentation. A method for segmenting (classifying) a voxel tissue according to the normalized histogram of the indexed colors (NHIC-method) from its neighborhood is proposed and investigated (on the femail dataset from VHP). Its possibilities were investigated in the range of both the neighborhood radius and the decision-making threshold.
It is also clear that it is necessary to continue research in this direction and create algorithmic and software to turn this method into an open technology of cryo-imaging, biomedicine and education based on it.
References
[1] Pommert A. et al. Creating a high-resolution spatial/symbolic model of the inner organs based on the Visible Human. Medical Image Analysis. 2001. V. 5. №. 3. P. 221-228.
[2] Park J. S. et al. Visible Korean Human: its techniques and applications. Clinical Anatomy. 2006. V. 19. №. 3. P. 216-224.
[3] Zhang S. X., Heng P. A., Liu Z. J. Chinese visible human project. Clinical Anatomy. 2006. V. 19. №. 3. P. 204-215.
[4] Wilson D. et al. Whole mouse cryo-imaging. Proceedings of SPIE--the International Society for Optical Engineering. NIH Public Access, 2008. V. 6916. P. 69161I.
[5] Terpilovskiy A.A., Kuzmin A.L., Lukashkina R.A. Sposob sozdaniya virtualnoy modeli biologicheskogo obyekta i ustroystvo dlya ego osushchestvleniya: patent N 2418316 RF [The Method of Creating a Virtual Model of a Biological Object and Device for Its Implementation: RF Patent no. 2418316]. Date of publication May 10, 2011.
[6] Terpilovskiy A.A., Tiras Kh.P., Khoperskov A.V., Novochadov V.V. Vozmozhnosti polnocvetnoj trehmernoj rekonstrukcii bioob’ektov metodom poslojnogo nalozheniya: kolennyj sustav krysy. [The possibilities of full-color three-dimensional reconstruction of biological objects by layer-by-layer imposition: the knee joint of a rat]. Vestnik Volgogradskogo gos. uni-ta. Ser. 11, Estestvennye Nauki [Sci. J. of Volgograd St. Uni., Ser.11 Natural Sciences] 2015. №4 (14). P.6-14. DOI: 10.15688/jvolsu11.2015.4.1
[7] Roy D., Steyer G., Gargesha M., Stone M., and Wilson D. 3D Cryo-Imaging: A Very High-Resolution View of the Whole Mouse. Anatomical Record (Hoboken). 2009 March ; 292(3): 342–351. doi:10.1002/ar.20849
[8] Roy D. et al. Multi-scale characterization of the PEPCK-Cmus mouse through 3D Cryo-imaging. Journal of Biomedical Imaging. 2010. V. 2010. 12 p.
[9] Gavrilov N., Turlapov V. Advanced GPU-based ray casting for bricked datasets. ACM SIGGRAPH 2012 Posters. ACM, 2012. P. 123.
[10] Bloomberg D. Color quantization using modified median cut (2008) /Leptonica report, p.1-6 http://www.leptonica.org/papers/mediancut.pdf .
[11] Schneider J., Westermann R. Compression domain volume rendering. Proceedings of the 14th IEEE Visualization 2003 (VIS'03). IEEE Computer Society, 2003. P. 39.
[12] Huang Y. L., Chang R. F. A fast finite-state algorithm for generating RGB palettes of color quantized images. 2002.
[13] Velho L., Gomes J., Sobreiro M. V. R. Color image quantization by pairwise clustering. Computer Graphics and Image Processing, 1997. Proceedings., X Brazilian Symposium on. IEEE, 1997. P. 203-210.
[14] Gargesha M., Qutaish M., Roy D., Steyer G., Bartsch H., and Wilson D.L. “Enhanced volume rendering techniques for high-resolution color cryo-imaging data”. Proc SPIE Int Soc Opt Eng. 2009 ; 7262: 72655V. doi:10.1117/12.813756.
[15] Falk M. et al. Transfer Function Design Toolbox for Full-Color Volume Datasets. IEEE Pacific Visualization Symposium (PacificVis 2017). 2017. -10 pp.
(http://urn.kb.se/resolve?urn=urn:nbn:se:liu:diva-134851)
[16] Turlapov, V.E., Gavrilov, N.I. 3D scientific visualization and geometric modeling in digital biomedicine (2015). Scientific Visualization, 7 (4), 27 – 43.
[17] Hore A., Ziou D. Image quality metrics: PSNR vs. SSIM. Pattern recognition (icpr), 2010 20th international conference on. IEEE, 2010. P. 2366-2369.
[18] Huang J. et al. A practical evaluation of popular volume rendering algorithms. Volume Visualization, 2000. VV 2000. IEEE Symposium on. IEEE, 2000. P. 81-90.
[19] Mora B., Jessel J. P., Caubet R. A new object-order ray-casting algorithm. Proceedings of the conference on Visualization'02. IEEE Computer Society, 2002. P. 203-210.
ВИЗУАЛЬНАЯ АНАЛИТИКА И СЕГМЕНТАЦИЯ ЦВЕТНЫХ БИОМЕДИЦИНСКИХ КРИО-СКАНОВ ВЫСОКОГО РАЗРЕШЕНИЯ
Н.И.Гаврилов, Е.П.Васильев, И.В. Храмов, А.А.Гетманская, В.Е.Турлапов
Национальный исследовательский университет им. Н.И. Лобачевского, Россия
Аннотация
Цель этой работы - скорейшее внедрение крио-визуализации в визуальную аналитику практической медицины и биологии, а также создание единого решения как для управления визуализацией, так и для сегментирования данных крио-визуализации в естественных цветах. В этой статье мы использовали квантование и индексирование натуральных цветов для данных крио-имиджинга (крио-томографии) в качестве основы для решения двух сформулированных в статье проблем: 1) троекратное увеличение памяти для данных крио-имиджинга в истинных цветах (RGB True Color), по сравнению с использованием индексированных данных (палитры); 2) проблема управления прозрачностью естественных тканей существенно гетерогенных по цвету.
Мы показали здесь, что: 1) при использовании палитры из 256 цветов, построенной с использованием метода Линде-Бузо-Грея (Linde-Buzo-Gray), вместо естественных цветов для женского набора данных из проекта Visible Human Project (VHP) потери качества изображения несущественны (PSNR = 44 - невидимы для человеческого глаза); 2) квантование трехмерного изображения - это не только способ уменьшить размер набора данных – это также повышение производительности примерно в два раза (в кадрах в секунду, fps) по сравнению с визуализацией трехканальных необработанных данных, а наилучшая производительность была достигнута путем загрузки в видео-память всего набора данных как единого блока (до 108,9 fps для данного набора и GeForce GTX 680); 3) высокое разрешение крио-изображений делает рендеринг артефактов невидимым для человеческого глаза; после индексирования качества изображения достаточно, и трилинейная интерполяция становится ненужной, поскольку она увеличивает PSNR всего до 45,5 дБ, но программируемая трилинейная интерполяция приводит к тому, что в два раза падает производительность; прямое использование интерполяции индексов с помощью аппаратного обеспечения приводит к потере качества изображения, которое заметно для глаз; 4) квантование естественных цветов дает нам хорошие возможности как для контроля непрозрачности, так и для сегментации; предложен и исследован метод сегментации (классификации) воксельной ткани в соответствии с нормированной гистограммой индексированных цветов (NHIC-метод) из ее окрестности (по набору данных из VHP); его возможности исследовались в диапазоне как радиусов окрестности, так и порогов принятия решения.
Мы планируем продолжить исследования в этом направлении и создать алгоритмы и программное обеспечение для превращения метода NHIC в открытую технологию для крио-визуализации, биомедицины и образования на ее основе.
Ключевые слова: крио-визуализация, высокое разрешение, визуальная аналитика, научная визуализация, сегментация, классификация, контроль непрозрачности