VISUALIZATION OF THE DYNAMICS OF ION BUNCHES WITH COMPLICATED STRUCTURE IN MAGNETIC FIELDS BY MEANS OF 3Ds MAX
A.S. Prokopieva, I.А. Shalyutin, D.D. Popov, H.Y. Barminova
National Research Nuclear University MEPhI
Table of contents
2. Basic principles of the PyCAMFT program
3. Visualization of the results
3.1. 2D visualization with built-in code methods
3.2. Three-dimensional visualization using external software packages
Abstract
The development of a program for modeling the dynamics of ionic clots of complex composition in external fields includes the creation of advanced means of visualization of computations. Visualization of the computational results is necessary for spectrometry, spectrography, and separation applications that are in demand in fundamental and applied physical research, as well as for the formation of a feedback channel when program code is included in the automation system of the experiment. The article briefly presents information about the PyCAMFT code and the visualization tools used in it. The spectrograms and the results of calculating the integral doses from ionic bunches with a complex structure are obtained. Examples of using the 3Ds MAX program for visualization of calculations are given.
Keywords: modeling, charged particle beams, parallel computations, spectrometry, visualization of computations
1. Introduction
Accelerating technologies are widely used in modern installations for research and industrial purposes, in particular, in scientific, medical and inspection accelerators, installations for ion-plasma processing of materials. For the development and operation of such units it is necessary to have appropriate software capable of simulating the behavior of charged particle beams in external electromagnetic fields. Existing numerous programs (for example, [1-3]) can simulate the beam dynamics in selected situations, and in the case of intense particle flows with a sufficiently long pulse duration or a large "lifetime" can introduce a significant error in the calculation results, since to describe intense flows , as a rule, a particle-in-cell (PIC) method is used. While developing the CAMFT program [4], an attempt was made to create a code for describing the dynamics of intense non-relativistic bunches of charged particles in magnetic fields, free from the shortcomings of the PIC method. In this article, in essence, the new PyCAMFT program has the following advantages over the CAMFT program: the use of the Python language and libraries [5], the use of numerical integration methods with improved accuracy, rational logical structure, enhanced code functionality, the development of visualization and data analysis tools , GUI-oriented calculations, which led to an increase in the rate and accuracy of calculations, cheaper development and ease of operation of the final software product.
The article briefly describes the basic principles of the PyCAMFT program and the visualization methods used, as well as the results of calculating the dynamics of complex-structure bunches in Thomson's spectrometers.
2. Basic principles of the PyCAMFT program
The program is based on the principle of partial modeling of the bunch dynamics in external fields, in which the equations of particle motion are integrated independently in the case of a low bunch intensity, and correlate with each other when the bunch intensity is greater than 105 particles per bunch. To reduce calculation time, the program uses parallel computing technologies. The CAMFT [4] program used OpenMP version 2.0 [6], which made it possible to perform calculations on a personal computer with the number of cores 4 at a bunch intensity of up to 105 particles per bunch and on a supercomputer with the number of 10240 nuclei at an intensity of up to 1010 particles per bunch ([4]). PyCAMFT, implemented in Python, uses the PyCUDA version 2017.1.1 technology [7] as the basis of the GPU-based parallel computing unit [7], which allows simulating the dynamics of high-intensity bunches on a personal computer with an NVIDIA GeForce graphics card.
Approbation of the current version of the program was carried out using examples of mass-charge separation of ion bunches of various intensities for the problems of spectrography of plasma sources, namely sources with vacuum discharge under cathode sputtering conditions, sources with a capacitive discharge in low-pressure hydrogen, and a laser ion source with a polyethylene target.
Figure 1 shows schematically the principle of calculating the spectrogram of beam particles extracted from an arbitrary plasma source, realized in the program [8].
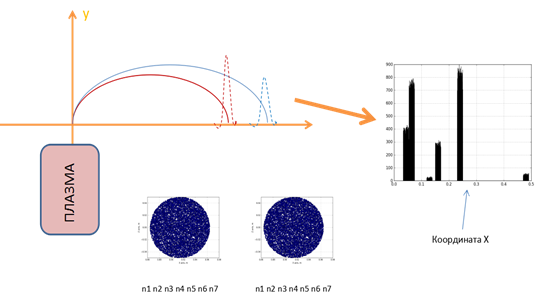
Fig. 1. Principle of calculating the spectrogram of an ionic bunch in the PyCAMFT program.
The process of extraction of a bunch of particles from a source in Figure 1 is shown conditionally, without detailing the ion-optical system.
3. Visualization of the results
3.1. 2D visualization with built-in code methods
In the PyCAMFT program, visualization of simulation results serves as a necessary link in the feedback system when developing an experimental setup. The visual representation is also necessary when carrying out corpuscular diagnostics of plasma and ion sources, including when using code as an element of the automation system of the experiment.
The current version of the PyCAMFT code for two-dimensional visualization of modeling results uses the Matplotlib libraries (Anaconda distribution [9]).
Examples of 2D visualization of dynamics of a bunch in PyCAMFT are shown in Figures 2-4.
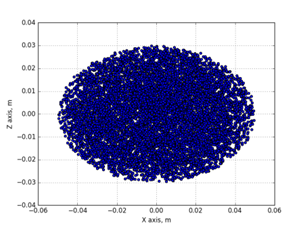
Fig.2. Two-dimensional visualization with the built-in tools of the PyCAMFT code a bunch of ellipsoidal shape [8].
Figure 2 shows the visualization of the projection of a ellipsoidal bunch on a plane corresponding to the median plane of the separator for the case when the particle density is determined by the normal distribution.
In Figures 3 and 4, the two-dimensional visualization of the ensemble of particles after turning the bunch in a magnetic field of the dipole type illustrates the property of magnetic fields to have a disperse, which leads to the spatial separation of particles in the case of bunches of complex mass-charge composition, and to a change in the phase characteristics of the clusters (see, for example, [10-13]).
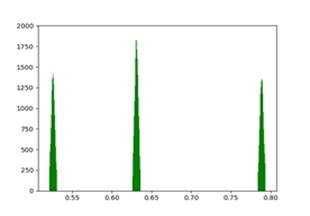
Fig.3. Visualization of the spectrogram of a three-component beam of carbon ions with charge states 4+, 5+, and 6+ under full reflection of a bunch in a field dipole magnet.
In Fig. 3 shows the spectrogram of a carbon ion beam with three C4 + charge states (30%), C5 + (40%) and C6 + (30%) obtained using the built-in PyCAMFT visualization tools. The simulation was carried out for a beam with an intensity of 4 * 103 particles per clot, particle energy 100 keV, and ion temperature 2 eV. It was assumed that the particles are distributed according to the density in accordance with the Gaussian distribution, in terms of velocities, in accordance with the Maxwell distribution. The magnitude of the induction of the magnetic field was 0.1 T. The angle of rotation in the magnet was 180 °. Figure 4 shows the visualization of the results of calculating the integral dose from a bunch of carbon ions in the registration plane. The calculation was carried out for bunches in two types of geometry (cylindrical and sheet). In the calculation, it was assumed that the particles in the axially symmetric beam were distributed uniformly over the volume of the bunch, in a ribbon bundle the particle density was determined by the normal distribution along the profile. The field induction value was 0.1 T, the energy of the bunch at the entry in the field was 100 keV, the ion temperature was 0.1 eV, the radius and length of the bunch were 0.5 cm and 5 cm, respectively.
|
|
|
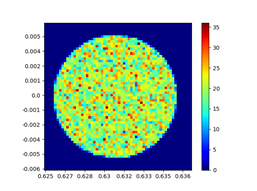
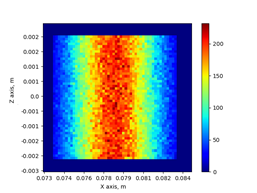
Fig.4. Visualization of the integral dose PyCAMFT in the registration plane with complete reflection of the bunch in the dipole magnet field in the case of an axially symmetric bunch (on the left) and a sheet bunch (on the right).
The ability of the PyCAMFT program to visualize the distribution of the irradiation dose of a selected plane at an arbitrary angle of rotation and arbitrary initial beam parameters can be claimed when using a program for the development and operation of devices for ion-plasma processing of materials, as well as medical equipment based on accelerating technologies.
3.2. Three-dimensional visualization using external software packages
In the program CAMFT [4], implemented in C ++, as an external tool for 3D-visualization it was intended to use the package MATLAB 8.1 [14]. Figure 5 shows an example of such a visualization of the calculation for a bunch of ions, the shape of which is approximated by an ellipsoid.
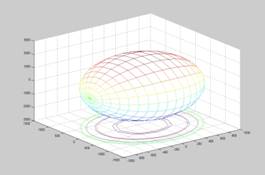
Fig.5. Using 3D visualization tools MATLAB for presentation a bunch of particles in the triaxial ellipsoid approximation.
The current version of PyCAMFT for 3D visual analysis of the results of calculations uses the program 3Ds MAX [15,16]. 3Ds MAX, developed by Autodesk for creating and editing 3D graphics, is an effective data analysis tool due to a user-friendly interactive interface. The 3Ds MAX program is multifunctional and has the same advanced 3D modeling, rendering and animation capabilities.
Figures 6 and 7 show the results of using the 3Ds MAX program for three-dimensional visualization of the initial bunch of complex composition in cylindrical geometry (Fig. 6) and the results of calculating the distribution of particles of one kind in the cross section of a bunch of tape geometry after a rotation in the magnetic field of the separator (Figure 7).
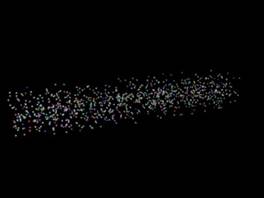
Fig.6. Visualization of a 3-component bunch of H +, B + and La + ions at the entrance to the separator field. The case of an axial-symmetric geometry.
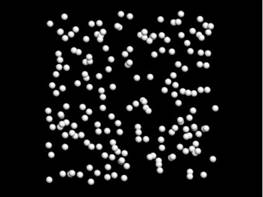
Fig.7. Visualization of the beam profile by one component (H +) after turning in the separator field. The case of sheet geometry.
Figure 8 shows the 3Ds MAX visualization window and the bunch animation script, which consists of three types of particles - single-charged hydrogen ions, boron and lanthanum. A bunch of this type is formed in a capacitive discharge in hydrogen with cathode sputtering, when lanthanum hexaboride LaB6 is used as the cathode material.
In Fig. 9 is a screenshot of the movement of particles in a magnetic field of 0.75 T in the case of rotation of the bunch as a whole by 180 °, the corresponding animation file is given in the materials of the article (see Appendix, file 0.75T.avi). White color corresponds to hydrogen ions, red - boron, blue - lanthanum. Figure 9 and animation allow us to estimate the magnitude and scale of the temporal and spatial separation of ions in a magnetic field, as well as the change in the geometry of the bunch, caused by the disperse properties of the field [10-13].
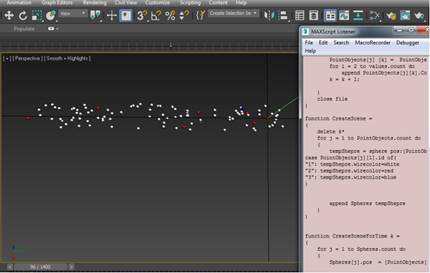
Fig. 8. The visualization window in 3Ds Max and the animation script.
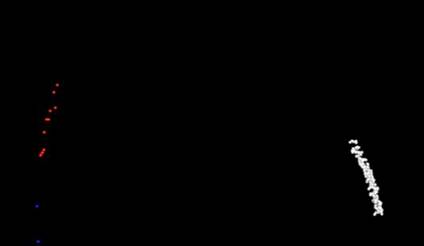
Fig. 9. A screenshot of the animation of the motion of a three-component bunch of ions H +, B + and La + in a magnetic field with an induction of 0.75 T.
The following initial conditions were used in the simulation: the extraction energy is 100 keV, the spread in the extraction energy is negligible. The ion temperature is determined by the ionization processes in the plasma source and is assumed to be 0.2 eV. The intensity is 106 particles per bunch. The distribution of the particle density in the bunch for each component is assumed to be uniform, the component ratio in the bunch is hydrogen H+ (93%), boron B+ (6%) and lanthanum La+ (1%). For animation, the intensity of the beam is reduced to 103 particles per bunch.
Acknowledgment
The work is partially supported by the Program 5/100 of Russian Academic Excellence Project of the NRNU MEPhI.
4. Conclusion
Visualization as an effective way of data analysis is actively used when creating software codes modeling physical processes. To visualize the results of modeling the dynamics of compound particles of charged particles in external electromagnetic fields, the PyCAMFT program uses both built-in and external means. As the basic built-in tools in the code, the tools of the Matplotlib library of Python (Anaconda distribution) are used. For 3D visualization and animation, 3Ds MAX software package with powerful animation and rendering capabilities is used as an external tool in the current version of the code. The visual representation of the data in the developed PyCAMFT program allows the user to easily analyze, scale and evaluate dynamic processes in complex compound bunches with arbitrary initial parameters in external fields of arbitrary geometry.
References
1. URL: http://www.phy.anl.gov/atlas/TRACK/
2. URL: http://mcnp.lanl.gov
3. PARMILA, LA-UR-96-4478, LANL, Los Alamos, New Mexico 87545, USA.
4. H.Y. Barminova, M.S. Saratovskyh. Modeling of the intensity of the magnetic field. J. Phys. Conf. Ser., 633 (2015) 012067.
5. URL: www.python.org
6. URL: www.openmp.org
7. URL: https://developer.nvidia.com/pycuda
8. I. A. Shalyutin. Development of a program for modeling the dynamics of ion bunches in magnetic fields using parallel computation methods. Graduation qualification work of the bachelor. NRNU MEPhI. May 2017.
9. URL: www.anaconda.com
10. E. E. Barminova, A. S. Chikhachev, Three-dimensional problem of emittance transformation of charged-particle bunches in a nonuniform magnetic field, Radioph. Quant. Electronics 34 (1991) 818.
11. E. E. Barminova, A. S. Chikhachev, 3-dimensional problem of emittance transformation of charged-particle bunches in nonuniform magnetic-field, Izv. Vyssh. Uchebn. Zaved. Radiofizika 34 (9) (1991) 1041.
12. E. E. Barminova, A. S. Chikhachev, Motion of bunches of charged particles in a transverse magnetic field, Radioph. Quant. Electronics. 33 (3) (1990) 277.
13. H. Y. Barminova, A. S. Chikhachev, Dynamics of a three-dimensional charged particle dense bunch, Phys. Rev. ST AB 16 (2013), 050402.
14. URL: www.mathworks.com
15. A. S. Prokopieva. Visualization of the dynamics of an ion bunch in a magnetic field. Educational and research work. NRNU MEPhI. May 2017.
16. URL: www.autodesk.ru
Appendix