USAGE OF VISUALIZATION IN THE SOLUTION OF MULTICRITERIA CHOICE PROBLEMS
A.P. Nelyubin1, T.P. Galkin2, A.A. Galaev2, D.D. Popov2, S.Yu Misyurin2, V.V. Pilyugin2
1Mechanical Engineering Research Institute of the Russian Academy of Sciences, Russian Federation
2National Research Nuclear University MEPhI (Moscow Engineering Physics Institute), Russian Federation
email: nelubin@gmail.com
Contents
2. Classification of methods for solving multicriteria choice problems
3. Visualization in methods of direct comparison of alternatives by preference
4. Visualization in methods of criteria aggregation
5. Visualization in methods of constructing preference relations
6. Visualization in methods for analyzing solutions in the space of criteria
Abstract
The article discusses the features of the process of solving multicriteria choice problems associated with the need for modeling preferences of decision makers. A general classification of methods of solving such problems is given. The visualization tools involved in these methods are described. We consider approaches to the visual sensitivity analysis of the solution in the criteria aggregation methods, visualization of partial preference relations on the set of alternatives, and visual investigation methods of the set of feasible solutions in the criteria space. Visual analysis plays a significant role in multicriteria problems and is an essential part of interactive methods of solving such problems. Interactive approach to the organization of the decision making process allows us to more accurately reveal the actual preferences of decision makers, and to make the best possible choice.
Key words: Multicriteria analysis, criteria importance, interactive approaches to solution of choice problem, decision support systems.
1. Introduction
Most complex management problems that require decision making are multicriteria. For example, when choosing the site of a potentially hazardous or harmful industrial facility (say, airport or chemical plant), in addition to the "resource" criteria, the impact of the functioning facility on the environment, social, and sometimes political consequences of the decision, must also be taken into account.
The choice problem in the general case is to find and select among a set of possible alternatives of some subset of the most suitable alternatives. Most often in practice, one needs to choose one or several alternatives. The initial set of alternatives can be finite or infinite. A finite set of alternatives can be small, and can be so large that all alternatives cannot be looked over for a reasonable time even by numerical methods. An infinite set of alternatives is most often a continuum, while the alternatives themselves are determined by a set of parameters that can take values from a certain range or interval. In such choice problems, it is necessary to first search for feasible (valid) alternatives that satisfy all constraints.
If a single choice criterion is defined as a function that matches each alternative to the degree to which it is suitable for choice, then the choice problem is solved by numerical optimization methods. In multicriteria choice problems, a vector of the values of each criterion function characterizes each alternative. Such vector estimates of alternatives can be incomparable. Therefore, in order to make a choice in multicriteria problems, an additional analysis of the criteria and alternatives is required.
This analysis should be carried out with the participation of the decision maker (DM), especially in complex strategic choice problems [1-4]. As a DM, a group of people, experts in the field, can act. The DM is interested in realization of the best choice; therefore, he/she carries the information on preferences. The problem is that these preferences cannot usually be formulated directly in an explicit form, especially in the form of quantitative ratios. Making a responsible decision is a special process, which is characterized by time duration and active thinking activity. At the beginning of this process, a DM has only an approximate idea of his/her preferences. During the analysis of the problem, these preferences can be clarified, refined and even changed.
In this process, the data representation plays a special role: information about alternatives, criteria, and preferences. The visual representation of such data is the most natural for a person, since it affects both logical and imaginative thinking. It is known that a person can keep in mind at the same time no more than 5-7 factors (alternatives, estimates) [1-2]. The graphical image allows him/her to aggregate a larger amount of information about the analyzed object. Therefore, to solve the problems of multicriteria choice, it is purposefully to use interactive graphical methods. In the process of dialogue with a computer multicriteria decision support system, the DM and experts more deeply understand the problem, the possibilities of achieving the goals, and clarify their preferences [4].
The reported study was funded by RFBR according to the research projects № 15-08-05493, № 16-29-04401, № 16-01-00404.
2. Classification of methods for solving multicriteria choice problems
There are many approaches to solving multicriteria choice problems. These approaches differ according to which model is used to describe the preferences of the DM and how the decision making process itself is organized.
In the most general case, the DM’s preferences are described by a choice function [3], which assigns to its arbitrary set of alternatives a subset corresponding to the formulation of the choice problem. Construction of such a choice function is possible only in problems of small dimension. Therefore, in practice, simplifying assumptions are made about the form of this function. Most often, all the criteria are aggregated into one generalized criterion, allowing to rank by preference an arbitrary set of alternatives. Among such methods are:
- selection of one main criterion;
- lexicographic ordering of criteria by importance;
- aggregation of criteria using weights of their relative importance;
- construction of the utility function.
Such methods for solving multicriteria choice problems are called a priori, since a fully restored choice function allows one to make choices on an arbitrary set of alternatives.
On the other hand, to solve a single choice problem, it is not necessary to completely restore the choice function. Methods, in which the preferences of the DM are established in the study of the existing set of alternatives, are called a posteriori. Among such methods are:
- building preference relations on a set of alternatives;
- analysis of variants in the space of criteria: study of the Pareto boundary, imposition of restrictions and tolerances.
By the approach to organize the process of solving the choice problem, the methods can be divided into single-step and multi-step (iterative) methods. A step is understood as a cycle consisting of two stages:
1. Clarifying information on the preferences of the DM in accordance with the model used;
2. Formation of conclusions and recommendations for the implementation of the choice on the basis of information received about preferences.
To solve complex and responsible problems of multicriteria choice, multi-step interactive methods are better suited. Simple iterative procedures in which the stages of constructing the model of preferences of the DM alternate with the stages of formal computations are often unreasonably ascribed as interactive methods for solving multicriteria problems [5]. In addition to the presence of several steps, interactive methods should provide feedback to the DM, i.e. the resulting recommendations at each step must be accompanied by some justification, argumentation [6], so that they can be analyzed to adjust preferences at the next step in the solution of the problem. At this stage of the problem analysis, the visualization tools play an important role. They allow to give the DM information about the current solution and how it depends on the specified preferences parameters in the form of an image.
3. Visualization in methods of direct comparison of alternatives by preference
With a small number of alternatives and criteria, we can sometimes try to compare the alternatives by preference, without making any assumptions about the relationship between the criteria among themselves. For these purposes, many different graphical representations of alternatives have been developed, allowing the DM to visually compare the gains and losses by different criteria for the compared alternatives. Let us consider only some examples of such representations.
Fig. 1 shows a diagram of efficiency profiles of alternatives. Each alternative is presented in the form of a two-dimensional graph of the dependence of the criterion value on the criterion number. The higher the overall efficiency profile of the alternative is, the more preferable the alternative should be.
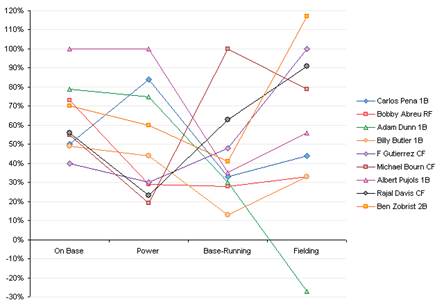
Fig. 1. Diagram of performance profiles: 4 criteria, 9 alternatives.
Fig. 2 shows a radar diagram. The criteria are arranged in a circle. Each alternative in the diagram is represented as a star whose ray length is equal to the value according to the corresponding criterion. The larger the star, the more preferable the corresponding alternative should be.
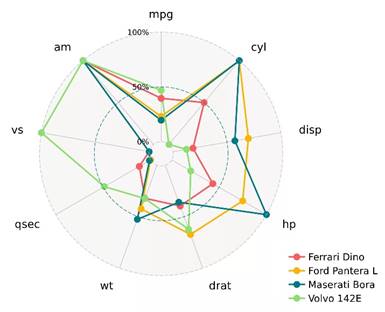
Fig. 2. Radar chart: 9 criteria, 4 alternatives.
Of course, with more criteria or alternatives, the use of such methods will be difficult.
4. Visualization in methods of criteria aggregation
Among the a priori methods for solving multicriteria choice problems, we consider one of the most common, which consists in constructing an aggregated criterion using weights of the relative importance of the criteria. Most often a linear convolution of the criteria is applied. It is used in such methods as SMART [7], Analytical Hierarchy Process [8-9], etc.
In such methods, visualization is used at different stages of clarifying information about the preferences of the decision maker and presenting the results. However, visualization has a special significance for analyzing the sensitivity (stability) of a solution to changing preferences parameters [10-11]. Simply because without visualization this analysis would be very difficult and would have considerably less efficiency.
Sensitivity analysis allows to identify preferences parameters, on which the result of choice depends to a greater or lesser extent. This analysis, as a rule, is carried out locally and allows to understand, whether the result will change at small deviations of the entered data. Therefore, it is sometimes called an analysis of the stability of the choice result.
In the sensitivity analysis, visualization serves to represent the dependence of the result of the choice (recommendations formed) on the entered preference parameters, in particular, the weights of the relative importance of the criteria. The interactive tools can also be used. Fig. 3 and 4 illustrate the sensitivity analysis in the Expert Choice system [10]. In the first example (Fig. 3), the dependence of the result of the choice on the value of the importance weight of one of the criteria is analyzed. For each alternative, the dependence of the value of the aggregated criterion on the weight of the criterion is presented. It is quite a strong assumption that the weights of the remaining criteria vary proportionally.
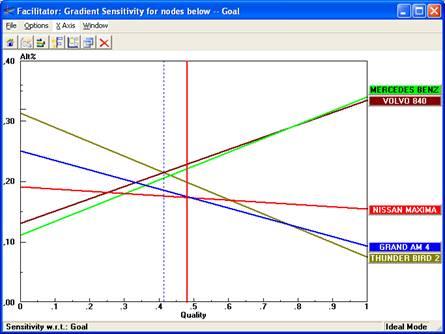
Fig. 3. Sensitivity analysis according to one of the criteria.
In the second example (Fig. 4), the dependence of the choice result on the set of weights of all criteria is analyzed. In this case, alternatives are presented in the form of efficiency profiles, and criteria weights in the form of bar charts.
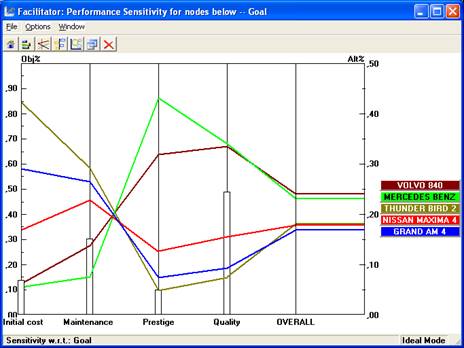
Fig. 4. Sensitivity analysis according to the set of criteria.
The presence of the visual sensitivity analysis tool transforms the a priori method into a multi-step and interactive one.
5. Visualization in methods of constructing preference relations
Preference relations on a set of alternatives are constructed in such methods as outranking (ELECTRE systems, etc.) [12], Criteria Importance Theory (DASS system) [13-15]. Visualization can be used to represent preferences in the form of oriented graphs. The alternatives are located at the vertices of the graph, and the edges connect them in the direction of domination (preference).
The Criteria Importance Theory allows you to operate with incomplete and inaccurate information about preferences. In this case, the preference relation may also be incomplete, i.e. not all alternatives are comparable. Then the corresponding oriented graph will not be connected. To solve the multicriteria choice problem, an iterative-fragmentary approach is used which consists in the sequential complication and consistent clarification of information on the preferences of the DM, as a result of which the relationship of preference is gradually extended with new elements. Fig. 5 shows an example of three steps of such a process.
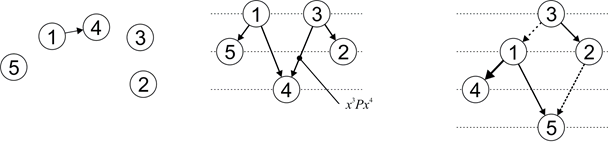
Fig. 5. The process of completing the graph of partial ordering of alternatives.
Visualization tools help to transform this iterative approach into an interactive one. The DM is convenient to see before itself the general picture of interrelations between alternatives. It is also important here how the graph is mapped onto the plane [16]. It makes sense to arrange alternatives from top to bottom in terms of their degree of dominance, so that the most preferable ones are immediately visible. Visualization also accompanies the methods of argumentation the solution and searching for the further directions of the process of solving the choice problem [17].
6. Visualization in methods for analyzing solutions in the space of criteria
Consider the general case of the multicriteria optimization problem, when a set of alternatives is specified by a set of n parameters, continuous or discrete, which can take values from the n-dimensional space of solutions X. The value of each parameter is constrained, usually in the form of an interval. The model of an optimized object or process can be either analytical or simulated. In this model, additional constraints on the set of parameter values may be imposed, i.e. it is possible that not all solutions of X are feasible. In addition, the model makes it possible to compute for each feasible solution x values for each of the optimization criteria K1, K2, … Km. Such a mapping of the parameter space X into the m-dimensional space of the criteria Y is schematically shown in Fig. 6 on the example of two criteria (m = 2).
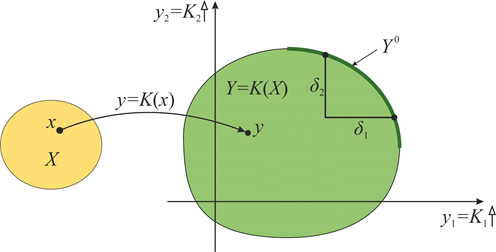
Fig. 6. Mapping of the parameter space into the criteria space.
In this scheme, it is assumed that the values for both criteria need to be maximized. Therefore, the best solutions are located on the right and above in the domain of feasible solutions Y(X) in the space of criteria. At this boundary, the Pareto optimal solutions Y0 are located. When choosing one best solution, it should be sought among the Pareto optimal [18]. The a posteriori methods for solving the choice problem in such a formulation are based on the investigation of this Pareto boundary with the use of visualization tools and interactive tools for visual analysis of solutions. For example, one can visually compare the gain of δ1 by the first criterion with the loss of δ2 by the second criterion in the transition from one solution on the Pareto boundary to the other (see Figure 6).
The authors of [19-21] develop the Feasible Goal Method – an interactive graphical method for searching for preferred solutions of multicriteria choice problems. The feasible goals are represented in the form of the Edgeworth-Pareto hull (EPH) envelope of this set. To construct the EPH they use different methods of approximation based on simplified, integral models of the problem being analyzed.
Visualization of the EPH is carried out using Interactive Decision Maps [20]. A decision map is a set of two-dimensional EPH cross-sections by two criteria for several values of the third criterion. Two-criteria cross-sections corresponding to different values of the third criterion can be superimposed on one image, with the color gradient indicating the change in the values of the third criterion (see Fig. 7).
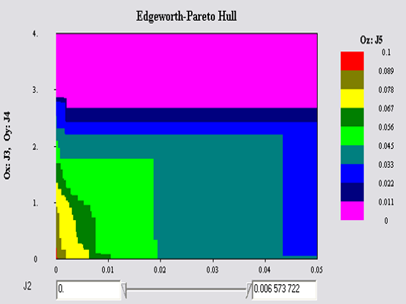
Fig. 7. Interactive Decision Maps.
With the help of Interactive Decision Maps, a visual analysis of the set of feasible goals is made. Interactive movement between Decision Maps for different values of the remaining criteria can be done with the slidebar (see Fig. 7). The most preferable (compromise) feasible goal is chosen using this interactive visual analysis.
Another approach to visualizing the Pareto boundary is to search through a sufficiently large number of solutions in the X domain and generate the corresponding points in the criteria space. Such a search can be carried out by methods of directed search for solutions, for example, by genetic algorithms [1, 5], by random search methods, and by the search for uniformly distributed points in the X domain [22].
In the MOVI system [23], the Parameter Space Investigation method is implemented by generating the uniformly distributed sequence of points [22]. Two-dimensional projections of the sets of feasible solutions and Pareto optimal solutions are represented (see Fig. 8).
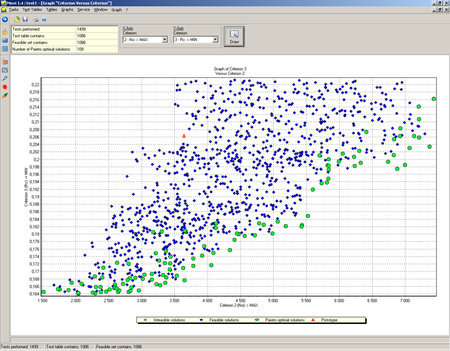
Fig. 8. Analysis of solutions in two-dimensional projection by two criteria in the MOVI system.
In addition, in the MOVI system, you can visually analyze the dependencies of the criteria on the parameters, as well as the area of concentration of the feasible and best solutions in the parameter space, in order to perform an in-depth search for solutions in these areas in the next steps of the interactive procedure of the problem solution. An example of solving the engineering problem of multicriteria optimization by this method can be found in [24].
The research on the creation of a new system for visual analysis of solutions in the space of criteria and parameters is carried out in the scientific visualization laboratory at MEPhI. It involves modern technologies for working with three-dimensional scenes (see Fig. 9).
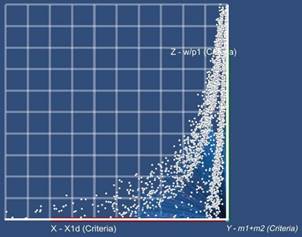
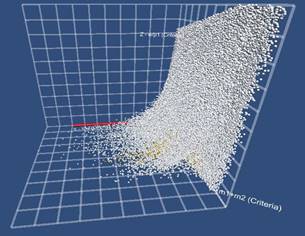
Fig. 9. Analysis of solutions in two-dimensional and three-dimensional projections of the criteria space in the new system Visual Analytics Tool.
There are following advantages of this approach:
- Ability to analyze 3-dimensional subspaces of criteria and parameters.
- Interactivity in the sense of active image analysis – the ability to rotate the scene, change the scale and other visualization parameters.
- Interactivity in the sense of setting the problem – the ability to change the initial data and constraints, while observing the corresponding change in results.
This allows:
- Have a general picture of the attainability of goals before your eyes.
- Compare the variants of solutions in aggregate: compare the scale of relative gains and losses, identify special "protrusions" and "dips" on the boundary of Pareto optimal solutions.
- Find complex dependencies of criteria on the (aggregate) of optimization parameters, inconspicuous on 2-dimensional projections.
- Identify clusters of solutions that are close in terms of the criteria and/or parameters.
- Explore the parameter space: identify promising domains for finding solutions; identify domains of instability in which solutions close in the parameter values differ greatly in the values of the criteria.
- Investigate the impact of constraints on the solution: identify the constraints to which the decision is sensitive; identify constraints that have little effect on the solution; understand what constraints should be weakened, and which can be strengthened without significantly worsening the results.
7. Conclusion
In this paper, it was shown how visualization tools can be used in completely different approaches to solving the problem of multicriteria choice. Visual analysis plays a special role in interactive decision making techniques. It is an essential part of this interactive process and determines the quality of decisions made.
The graphic image promotes a holistic perception of more complex information. Visualization tools in the interactive procedure help the DM understand and conceive the problem under consideration, monitor and control the progress of its solution. The visual representation of a set of solution variants of a multicriteria choice problem makes it possible to identify the interrelationships existing between them, to compare the differences in the values of the criteria, and to pick out the best compromise solution.
References
1. Trends in multiple criteria decision analysis / M. Ehrgott, J. Figuera, S. Greco (eds.). – New York: Springer, 2010.
2. Larichev O.I. Theory an methods of decision making. – Moscow: Logos. 2002. (in Russian)
3. Aizerman M.A., Aleskerov F.T. Choice of variants. Theory foundations. – Moscow: Nauka. 1990. (in Russian)
4. Podinovski V.V. Analysis of Multicriteria Choice Problems by Methods of the Theory of Criteria Importance, Based on Computer Systems of Decision-Making Support // Journal of Computer and Systems Sciences International. 2008, Vol. 47, No. 2, pp. 221–225.
5. K. Miettinen, F. Ruiz, A.P. Wierzbicki Introduction to Multiobjective Optimization: Interactive Approaches. In: Multiobjective Optimization. Interactive and Evolutionary Approaches, Lecture Notes in Computer Science, V. 5252, Springer, 2008. P. 27 – 57.
6. Hayes-Roth F., Waterman D.A., Lenat D.B. Building Expert Systems. In: The Teknowledge Series in Knowledge Engineering. Reading, PA: Addison-Wesley, 1983.
7. Edwards W., Barron F.H. SMARTS and SMARTER: improved simple methods for multiattribute utility measurement // Organization Behavior and Human Processes. 1994. Vol. 60. P. 306 – 325.
8. Saaty T.L. The Analytic Hierarchy Process. – N-Y: McGraw-Hill. 1980.
9. Saaty T.L. Decision Making with Dependence and Feedback. The Analytic Network Process. Pittsburg: University of Pittsburg. 2001.
10. Insua D.A., French S. A framework for sensitivity analysis in discrete multi-objective decision-making // European Journal of Operational Research. - 1991. - Vol. 54. - P. 176-190.
11. Ishizaka Alessio, Labib Ashraf, Analytic Hierarchy Process and Expert Choice: Benefits and Limitations // ORInsight, 2009, 22(4), pp. 201–220.
12. Roy B. The outranking approach and the foundations of ELECTRE methods. In: C. Bana e Costa (ed.). Reading in Multiple Criteria Decision Aids. Berlin: Springer. 1990. P. 155 – 183.
13. Podinovski V.V. Introduction into criteria importance theory in multicriteria decision making problems. – Moscow: PhysMatLit, 2007. – 64 с. (in Russian)
14. Podinovski V.V., Potapov M.A. Criteria importance in multicriteria decision making problems: theory, methods, soft, and applications // Otkrytoye obrazovanie. 2012. No. 2. pp. 55 – 61. (in Russian)
15. http://mcodm.ru/soft/dass/
16. Sergeev M.A., Nelyubin A.P. Methods of visualization of choice logic in multicriteria problems // Proceedings of XLI International conference Information technologies in science, education, telecommunication, and business IT+SE'2013. pp. 64 – 66. (in Russian)
17. Nelyubin A.P. Technology of interactive solution of multicriteria problems // Proceedings of XLI International conference Information technologies in science, education, telecommunication, and business IT+SE'2013. pp. 61 – 63. (in Russian)
18. Podinovski V.V., Nogin V.D. Pareto-optimal solutions of multicriteria problems. – Moscow: PhysMatLit, 1982. 254 pp. – The second edition 2007. 256 pp. (in Russian)
19. Lotov A.V., Bushenkov V.A., Kamenev G.K., Chernykh O.L. Computer and searching for compromise. The feasible goal method. – Moscow: Nauka, 1997 – 240 pp. (in Russian)
20. Lotov A.V., Bushenkov V.A., and Kamenev G.K. Interactive Decision Maps. Approximation and Visualization of Pareto Frontier. Kluwer Academic Publishers, Boston Hardbound, ISBN 1-4020-7631-2. February 2004, 336 pp.
21. http://www.ccas.ru/mmes/mmeda/soft/
22. Sobol I.M., Statnikov R.B. Optimal parameters choice in the problems with multiple criteria. Moscow: Nauka, 1981. – 110 pp. (in Russian)
23. http://www.psi-movi.com/
24. Ivlev V.I., Bozrov V.M., Misyurin S.Yu., and Nelyubin A.P. Parameterization of an Air Motor Based on Multiobjective Optimization and Decision Support // Journal of Machinery Manufacture and Reliability, 2013, Vol. 42, No. 5, pp. 353-358.