EVALUATIONS OF VISUALIZATION METAPHORS AND VIEWS IN THE CONTEXT OF EXECUTION TRACES AND CALL GRAPHS
V.L. Averbukh1,2, M.O. Bakhterev1,2, D.V. Manakov1
1IMM UrB RAS, Russian Federation
2 UrFU, Russian Federation
Contents
2. Visualization of execution traces and call graphs
3. Properties of visualization metaphors
3.1. Properties of city and landscape metaphors
3.2. Properties of molecule metaphor
5. Some issues of software visualization
Abstract
In this paper approaches to the evaluation of metaphors and view of Software Visualization systems are considered on the examples of representation of call graphs and execution traces of parallel programs. Execution traces map the dynamics of the certain program executions. Visualization and “replaying” of execution traces are important elements of debugging systems. The visual presentations of the Call Graph are widely used in the systems parallel program performance tuning systems. The visualization metaphors using to depict call graphs and execution traces are surveyed. “Traditional” (for example the City metaphor) and new (for example the Brain metaphor) metaphors are considered. The validity of visualization techniques is studied on basis of analysis of metaphor properties. It is important to understand what objects may be represented with one or another metaphor. The possibility of the visualization metaphors (for example City and Molecule metaphors) to represent large and huge volumes of data is analyzed. Shneiderman’s scheme is considered as method of evaluation of visualization. B. Shneiderman presents seven high level users needs that an information visualization application should support. (Overview, Zoom, Filter, Details-on-demand, Relate, History, Extract) The use of the Schneiderman's scheme presupposes the existence of large structured data volumes. Further some other approaches to the evaluation of metaphors and views are considered. Among them are the criterion mental structure conservation and the evaluation of system implementation efforts. The problems of Software Visualization for parallel computing are observed. The formalization of parallel computing and in particular performance tuning may be useful to resolve problems of Software Visualization.
Keywords: Software Visualization, Parallel Computing, call graphs, execution traces, visualization metaphors, Shneiderman’s scheme
1. Introduction
Software Visualization (SV) systems were actively developed as late as the 80th and the 90th years of the XX century. Much part of these systems is visual systems for performance tuning and program debugging in the field of parallel computing. But later it can be observed a certain recession in this domain [1]. The reasons of the recession are connected with a number of problems in particular connected with perception, analysis, and interpretation of images depicted huge volumes of data.
It appears that in the 90th the designers of visual debugging systems focused on the problems of capture of data in the frameworks (and under restrictions) of the then existing parallel computers. However, other problems exist, for example, the problems associated with visualization – how to choose and how to show entities of parallel programs, as well as to analyze and interpret them. In the case of parallel computation, the very definition of the program entities associated with its “erroneous” states is the tricky problem. The set and the essence of the analyzed software objects strongly depend on used parallel programming paradigm. In the case of performance tuning there is also a lot of problems, because the entities appropriated for analysis are hard to choose. There are various parallel program entities that are subjects of study, analysis and visualization. But in this paper, most of the focus is on consideration of only the program execution traces and call graphs. Execution traces and call graphs are used in one form or another by many debugging systems to describe the dynamics of the programs.
At the very beginning of Software Visualization evolution, when volumes of data were comparatively inconsiderable, designers used standard “Nodes and Arcs” approaches [2]. Ideas of performance tuning are based on the representation of statistics of parallel program executions. For these purposes statistical graphics, first of all, Gantt charts and Kiviat diagrams and their modifications are used. Note that complex views using various modifications of statistical charts to this day are the main most in the systems of performance tuning and performance debugging (including “industrial” ones), despite the obvious limitations when dealing with real high-performance programs [3-7].
Moreover, as early as the 80s more sophisticated views were used. Sometimes these views were built on the basis of the figurativeness of applications under consideration. Further in 2000th and 2010th years visualization metaphors were actively used. However, use of interesting metaphors was not always clear as users often need the simple picture representation which could be accurately interpreted. In this regard, the important issue is the choice and the evaluation of visualization techniques, the analysis of their applicability to those or other cases. Designers need to evaluate visualization techniques basing both on the qualitative analysis and some formalization.
In the next sections we’ll focus on visualization of event traces and call graphs as the important part of Software Visualization for parallel computing.
2. Visualization of execution traces and call graphs
Execution traces (also the term “Event Traces” is used) map the dynamics of the certain program executions. Visualization and “replaying” of execution traces are an important element of debugging systems. The visual presentations of the Call Graph are widely used in the systems parallel program performance tuning systems.
From the beginning of the development of Software Visualization the question of how to graphically represent program entities came up. In debugging systems realized in the 80s-90s of XX century methods based on charts or diagrams were used. System designers relied on the standard (“paper”) approaches to software visualization (for example control-flow diagrams, etc.) or shifted the task to users-programmers, providing a graphical toolkit. There are serious problems of scaling the views based on one or the other diagram and charts. The next step in Software Visualization may be associated with metaphor using. But using the original metaphor was not always justified because of the need of simple but clearly interpretable presentation methods. “Graph-based” metaphors have significant limitations in this regard also. Accordingly, traces are visualized in the form of dynamic “jumping” on the diagrams/charts [8]. (See Fig. 1,2.)
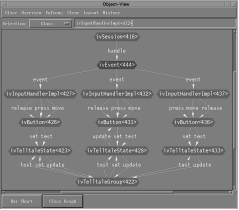
Fig. 1. The object graph shows how objects interact with each other [8].
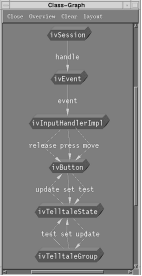
Fig. 2. The class graph shows how groups of objects interact [8].
There was also the use of “passage” (or “running") on the text of a program highlighting the current position. In the case of high-performance computing, such visualization techniques are hardly suitable. Call Graphs also were represented as very complex and convoluted schemes (See Fig. 3).
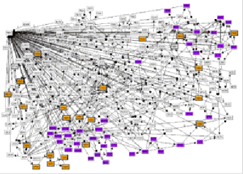
Fig. 3. Call graph of medium sized software system [2]
As already mentioned above further visualization metaphors were actively used. Consider the examples of metaphors depicting execution traces and call graphs and other entities of parallel programs.
In Zinsigh system three complimentary views help the user answer different questions. The Event Flow view shows the trace in its entirety or in detail. The user sees visual patterns representing phases of processing and the relative order of events. The Event Statistics view quantifies events, and presents distributions and averages enabling the user to identify outlier behavior. The Sequence Context view extracts patterns of interest from the trace and represents them along with frequency and performance data in succinct execution flow diagrams. The Event Flow views are depicted as cascade color lines (see Fig. 4). The Event Statistics views are used in the form of color element sets. Graph diagrams extended by texts are used to represent Sequence Context Views [9].
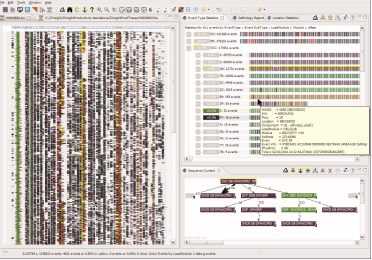
Fig. 4. The Event Flow view (left), the Event Statistics view (upper right) and the Sequence Context view (lower right) [9]
In [10-11] a dynamic analysis and visualization techniques is described. These techniques have to help developers in general to understand multithreaded software systems and in particular to identify performance bottlenecks. 2D views composed of diagrams and texts are used to depict execution traces of multithreaded programs and program structures. Developers may carry out analysis and interpretation in the course of (and by way of) the interaction with visual objects. Animation is used to improve perception and cognition of visualization. So in SYNCTRACE [12] system 2D views are used to depict traces of multithreaded programs. The views (some modification of circular charts) include the animation of execution for program codes under observation (see Fig. 5).
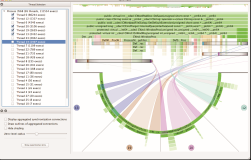
Fig. 5. Overview of the SYNCTRACE main window [12]
In [13-14] the use of two novel trace visualization techniques is proposed. The techniques are based on the massive sequence and circular bundle view, which both reflect a strong emphasis on scalability. The “Massive Sequence” view is offered to support users in navigation through traces and in interesting parts identification. Being a derivative of the information mural [15], it provides an overview of (part of) execution trace in which the directions of the relations are color coded using a gradient. Additionally, the massive sequence view allows zooming in on parts of the execution trace by the selection of fragment that needs closer inspection. “Circular Bundles” view reveals the original type of circular charts where all entities are projected on a circle, and relationships among them are reflected in form of weaving patterns (bundles) in inside the circle (see Fig. 6). This approach is applicable in three typical program comprehension tasks: trace exploration, feature location, and top-down analysis with domain knowledge.
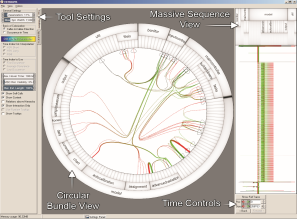
Fig. 6. Circular Bundle View. Full view of a trace [14]
There is the interesting example of 3D animation metaphor in Kanoko system where 3-D animation tool for parallel program performance tuning has been developed [16]. The Dynamic Systems metaphor was used. The animation uses mapping of physical structures to a dynamic system model, simulation of the system, and visualization/sonification of the simulation result. Processor elements, computational load of processor elements, a communication network and amounts of communication in a parallel computer can be mapped to bodies, mass of a body, a spring among bodies and attractive forces among bodies respectively. The animation method maps state values of trace data into quantities of states in a dynamic system model, then simulates the dynamic system, and makes the result of simulation visible and audible. Dynamic Systems metaphor is similar to Attraction/Repulsion metaphor and corresponds to Molecule metaphor and Physical Particles metaphor.
In a number of recent publications application of City and Landscape metaphors is considered. These metaphors are used to represent parallel program execution traces. In [17] trace representation for the case of multithread parallelism is described. Buildings represent static parts of a program. The trace is presented in the form of the ray-thread stretched between the buildings. Visualization of such errors as deadlock naturally looks like a painted intersection of these rays (see Fig. 7). In [18] similar ideas for visual representation based on 3D City metaphor are used. Components or subcomponents (e. g., packages in Java) form the districts in city metaphor. Buildings represent entities, i.e., components, subcomponents, or classes. The streets visualize the communication and are represented by pipes between entities. In [19] City metaphor is used to represent the architecture of a software system.
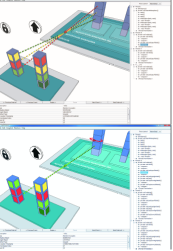
Fig. 7. City and Landscape metaphor for the dining philosophers problem.
The normal run (upper). The deadlock (lower) [17]
Brain Metaphor [20] should be noted as very interesting. The Brain visualization reveals clusters of source code that co-execute to produce behavioral features of the program throughout and within executions. A clustered visualization of source code is informed by dynamic control flow of multiple executions; each cluster represents commonly interacting logic that composes software features. Inspired by neural imaging of human brains of people who were subjected to various external stimuli, the animation has to reveal program activity during execution. The result has revealed the principal behaviors of execution, and those behaviors were revealed to be (in some cases) cohesive, modular source-code structures and (in other cases) cross-cutting, emergent behaviors that involve multiple modules (see Fig. 8).
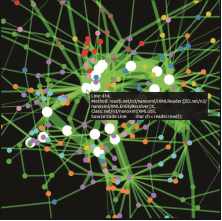
Fig. 8. THE BRAIN visualization of program execution [20]
Call graph visualization has to help Software developers answer questions about causality, ordering, type membership, repetition, choice, and other relationships [21]. This information is needed in processes of performance tuning and program debugging for parallel computing. Traditionally, two-dimensional views are used to present the call graphs. These views, as a rule, consist of charts connected by arrows. However, the two-dimensional representation of the call graph in the case of large and complex structures of the programs with a deep nesting level of function calls and lots of user-defined functions has problems with two-dimensional mapping of extended structure on the limited screen area and with the final pictures perception by user. In frameworks of two-dimensional visualization, one may cope with these problems using the additional tools for example interaction with the system during navigation on call graphs as in [21]. Problems with space on the screens may be overcame by adding another dimension.
In [22] and [23] 2½D visualizations of dynamic call graphs are described. In this case graph nodes are depicted as primitive images of buildings and the edges are drown as wires in the air. Resulting graphical displays are resembled in some way the displays received when using Factory metaphor (see Fig. 9).
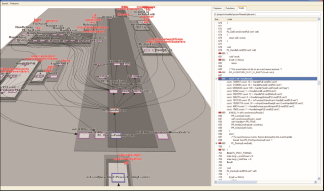
Fig. 9. Complex graphical view and textual code view of call graphs [23]
In ([24]) three-dimensional visual representations of call graphs are described. This visualization is based on Building metaphor when interconnected rooms of a certain complex building are represented (see Fig. 10). Three-level arrangement of rooms is used. All functions of the program are divided into three parts: user-defined functions with the heirs of UDFs; user-defined functions that do not have such heirs and system functions. Each part corresponds to a level in the resulting pictures. Each room is a visual representation of the function. In addition the function may be represented by an icon on the wall of the parent-function room. The view “inside” the room combined with the ability to “travel” inside the “building” between the rooms provides the most realistic pictures. The combination of these views may give an acceptable result.
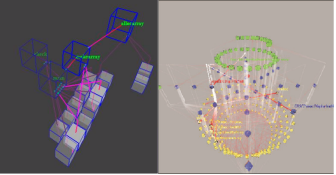
Fig. 10. Call Graph visualization based on Building metaphor [3]
There is the other approach to visualization of call graphs [24-25]. Suggested idea is to search analogies with natural objects. Nodes of a graph are represented as spheres and communications between them are represented as arrows. Let’s place in nodes-functions (which is usually represented like spheres) an electrostatic charge [25]. Connections between nodes are replaced by elastic interaction (see Fig. 11). Name this metaphor “Molecule metaphor” because at the given approach the visualization similar to the structure of benzol molecule models. All nodes are repulsed from each other, and attracted only if there is a connection between them. An elastic coefficient and a charge of nodes are introduced. An elastic coefficient affects the proximity of the nodes to each other and a charge affects the degree of remoteness of other nodes from this. These parameters need to be considered as static/structural characteristics. Thus there are two types of interactions: springy between bound nodes and electrostatic between all other nodes-“atoms”. Electrostatic interaction may reflect temporary features of the calling functions, then springy - a number of calls. Consideration of the “molecule” energy allows us to construct the effective drawing algorithm for about thousand of objects. The displays meet the symmetry criteria. Animation (molecule rotation) allows the better graph structure exploration. Color may be used to emphasize interesting features of visualized graphs. As announced, Molecule metaphor is similar in some way to natural Attraction/Repulsion metaphor and to Physical Particles metaphor [26]. (Also see [27].)
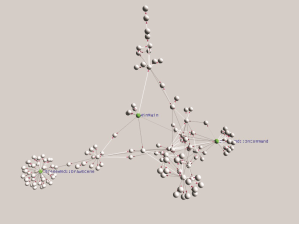
Fig. 11. Call Graph visualization based on Molecule metaphor [25]
As a rule the complex views are used in the systems for performance tuning and program debugging. These views consist of graphical objects built on the base of one or the other metaphor, program codes and/or descriptions of their structures. In some systems views are built according to the specific type of parallelism, such as in the SYNCTRACE system [28] where the visualization metaphor is specially constructed for the multithreaded parallel programs. In other cases only adaptation and extension of the existing metaphors take place. So in [29] slightly adapted City metaphor is used to represent multithreaded parallelism.
Note the interesting idea united the metaphor of Hierarchical Edge bundles and City metaphor. In the paper [30] the adaptation the existing 2D Hierarchical Edge bundles technique to represent relations in a 3D space on top of city metaphors is described. This visualization technique, inspired by the 2D Hierarchical Edge Bundles technique is converted into 3D Hierarchical Attraction Points which affect edge paths across the city visualization. This way, edges are grouped together, resulting in a more understandable visualization of relations. (See Fig. 12)
|
(a) Relations on top of the nested layout of the software city metaphor |
(b) Relations on top of the street layout of the software city metaphor |
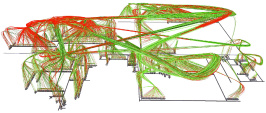
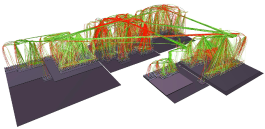
Fig. 12. Visualization of dynamic call relations on an execution of JEdit, Java JRE classes included. 2710 classes, 10870 edges representing 4 632 680 calls [30]
Let’s consider the conception of view in Computer visualization domain. Views are designed on the basis of the metaphors. A view includes a description of possible visualization objects, their relative positions on the screen, as well as the possible interaction with them [25]. The consideration of specific tasks of debugging and analysis is needed during the phase of the view development. The next two sections are devoted the analysis of visualization metaphors properties and evaluations of visualization system views.
3. Properties of visualization metaphors
The metaphor essence consists in interpretation and experiences the phenomena of one sort in terms of the phenomena of other sort. Computer metaphor is considered as the basic idea of likening between interactive visual objects and model objects of the application domain. Its role is to promote the best understanding of semantics of interaction and visualization, and also to determine the visual representation of dialog objects and a set of user manipulations with them. Visualization metaphors form the basis of views of specialized visualization systems whose design is the important part of whole design the “human factor” aspects of these systems [31].
Our interests lie in the evaluations of the metaphors. These evaluations are very important due the phases of the system design and of the method choice for visual representations of parallel programming entity.
Define the conception “Metaphor Action” to describe [potential] results of metaphor uses. This conception allows analyzing structurally specific computer metaphors. In turn the analysis is necessary to understand causes of successes of one and failures of another visualization and interface metaphors. Also the analysis of the logic of metaphor searching and choice enables to formulate evaluation criteria for “human factor” aspects of visualization systems.
The conception “Metaphor Action” is connected with answers to the following questions:
· How can this metaphor assist to represent the information?;
· How can this metaphor assist to interact with data or to manipulate them?
· What properties of metaphorical objects (that is visual and/or dialogue objects generated by the metaphor) take place?;
· What actions or ideas are arisen from the process of the user interaction (including observations of pictures) with metaphorical objects?
Objects of the new metaphorical domain, the relationship between them and the possible actions in this domain have a number of properties, which we call metaphor properties. [32]
The success or failure of debugging and performance tuning systems depends on many factors. Of course, the important factors are the comprehension of correspondence to system specifications and the system reliability. However at the design stage, an important task is the choice of methods of visual representation of objects and entities to be considered during debugging. One approach to the evaluation of visualization involves the examination of properties of visualization metaphors. We analyze the properties to consider the possibility of metaphor using for specific applications of Software Visualization. It is important to understand what objects may be represented with one or another metaphor. We need to analyze the possibility of the visualization metaphors (more precisely – the views based on the visualization metaphors) to represent large and huge volumes of data and details required to understanding the program’s operations. The positive effects of a 3D display and virtual and augmented reality environments are possible in these cases. Therefore it is important to analyze possible applications of metaphors in the frameworks of visualization systems using modern computer graphics environment, in particular the virtual reality environment. For all this, we need to describe how to verify the suitability of metaphor for solving problems under consideration [33].
Note on such metaphor properties as “ability to contain any objects inside itself”, “restriction of a perception context”, “closeness”, “inclusion in structure”, “presence a structure inside”, “naturalness of a metaphor”. These properties are connected with using within the framework of metaphors such basic image-schemas, as CONTAINER, UP-DOWN, BACKFRONT. These image-schemas and other visual characteristics are the base of depiction techniques in Software Visualization systems [32].
3.1. Properties of city and landscape metaphors
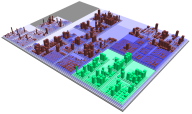
Fig. 13. The example of City view of the software system [34]
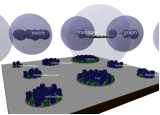
Fig. 14. The example of Landscape view of the software system containing packages, classes, methods and attributes [35]
In the cases of popular in Software Visualization systems City Metaphor and similar Landscape Metaphor (see Fig. 13-14) one may consider the following properties as:
Unlimited context
The user context isn’t artificially limited in City Metaphor and the metaphor itself, and it is defined rather rigidly – there are buildings, quarters, streets, districts. In Landscape metaphor a structure choice is nondedicated. In this case one may say about landscape nesting.
Naturalness
It is known that naturalness of a metaphor reduces efforts on the resultant image interpretation. In the cases of City and Landscape metaphors not only naturalness of spatial orientation, but naturalness of navigation takes place also. In case of a city metaphor the method of navigation is defined by the metaphor itself.
Organization of inner structure
Metaphors suggest the existence of an inner structure. In case of a City metaphor this structure is dictated by the metaphor itself, and it is defined rather rigidly – there are buildings, quarters, streets, districts. In Landscape metaphor a structure choice is nondedicated. In this case one may say about landscape nesting.
Key elements
Metaphors suggest a representation of large volume of information, and in most cases this information is rather homogeneous in visual sense. Users need the key elements to interpret this information. If we want to use a metaphor to reveal specific features and/or exceptions (for example bugs in programs), these elements have to be depicted by easy distinguished image-keys. One may design some key elements in frameworks of City or Landscape metaphors. In these cases some forms of guidance signs or markers may be used as key elements.
Resistance to scaling
These metaphors are stable in the case of increase in information volumes. Moreover, applications of City and Landscape metaphors are reasonable only in the cases of large information volumes.
In the cases of City and Industrial Landscape metaphor transport corridors help to design software visualization systems. Transport corridors may be used as means to represent control flows, data flows, and other relations between program constructions or parts of program complex.
Note that unlike in the case of Landscape metaphor, the choice of City metaphor strongly limits the set of possible views. Thus City and Landscape metaphors may form base to represent considerable volumes of the structured information with identifications of specific interest cases that is necessary in the systems for performance tuning and program debugging for parallel computing. Additionally possibility to fly over a city/landscape creates prerequisites to easy navigation. Flight with changes of height allows to carry out scaling and zooming. Interpretation of the graphical displays based on these metaphors seems to be simple.
3.2. Properties of molecule metaphor
Now let’s consider the properties of Molecule metaphor that also may be used to visualize execution traces and call graphs of parallel programs.
This metaphor may support visualization of large volumes of structured data (unlimited context). Interpretation of the physical Molecule metaphor and its modifications usually is simple and natural, although it requires the user to have (basic) knowledge of physics.
The relationships between objects of the visualized model also are represented naturally as links between atoms (naturalness). The views based on Molecule metaphor are resistant to scaling (resistance to scaling).
The metaphor support selection of the key elements for example, due to coloring or the size changing of the molecules elements and thickness of communications between them (key elements). Moving and navigating in the graphical displays related to Molecule metaphor may be performed by flying around molecule. There is the experience of visual “entering” a separate “atom” and viewing internal visual information inside a single sphere ([25]). It is possible to implement similar “entering” spheres in the frameworks of virtual reality environments (organization of inner structure).
Note that in general the use of Virtual Reality enhances the visualization based on City, Landscape and Molecule metaphors.)
Other approaches to the evaluation of visualizations are considered in the next section.
4. View evaluations
A number of papers are devoted to evaluation of views used in Information and Software Visualization. Note the early papers [36], [37] and [38] where the visualization metrics and evaluation approaches were described. Some of researches are linked with specialized cases or approaches. For example the paper [39] is devoted to evaluations of cartogram and in the papers [40],[41] and the aesthetic approach to evaluation visualization is considered. Note the papers on evaluation of graph visualization ant its aesthetics [42], [42]. There are some summarized papers on the evaluation of visualization, for example [43] and the paper [44] devoted to typology of abstract visualization. We are interested the papers [45] and [46] which contain the outline of visualization analysis based on Visual Information-Seeking Mantra (so called Shneiderman’s Mantra). B. Shneiderman presents seven high level users needs that an information visualization application should support [47]. In [48] these needs were refined to evaluate views of three-dimensional information visualization.
Let’s cite the outline of visualization analysis following [45].
Overview: Gain an overview of the entire collection of data that is represented. This is often a difficult problem in the case of visualizing the structural information of large systems. Constructing good visualizations of large connected graphs is an open research area.
Zoom: Zoom in on items of interest. When zooming, it is important that global context can be retained. This subsumes methods to drill down to lower levels of abstraction.
Filter: Filter out uninteresting items. Filtering by removing parts of the visualization will necessarily disturb the global context. Therefore, it is important whether the design supports some kind of abstraction of the removed parts.
Details-on-demand: Select an item or group and get details when needed. Getting details on a selected item is usually implemented by the embedding application. The detail representation is of less importance in large scale software visualization therefore, priority will be given to easy and fast navigation and rendering. The visual metaphors are designed such that there is no loss of meaning while zooming in or out.
Relate: View relationships among items. For a hierarchical data structure, it is necessary that the visualization shows parent-child relationships. This is one of the most important features of many software visualization systems. Software systems rely on many inter-related components, working together to solve problems.
History: Keep a history of actions to support undo, replay, and progressive refinement. A visitation path should be supported. That is a set of attributes, which describe the position of the camera, the light, and the zoom level. These viewpoints can be saved and reviewed. A sequence of such viewpoints can be played, thus representing a path within the visualization, which could represent the history.
Extract: Allow extraction of sub-collections and of query parameters. This task concerns saving the current state of the visualization. This is related only to the application and the underlying data set. How the data is visualized does not affect this.
Shneiderman’s Mantra implicitly describes the user’s activity during their usage of Information Visualization systems. It is supposed that if the system supports this set of operations, it may be used for Information and Software Visualization.
In [13] and [14] the criterion based on an expanded Shneiderman’s mantra is applied to the analysis of visualization of execution traces constructed on the basis of two synchronized view: (1) a circular bundle view for displaying the structural elements and bundling their call relationships, and (2) a massive sequence view that provides an interactive overview.
The summary table of how the two synchronized views satisfy each of these seven criteria is provided. In general these views correspond to the chosen criterion.
Let’s analyze now from a perspective “Shneiderman’s Mantra” the possibilities of visualizations based on City and Landscape metaphors.
Overview task may be realized by the flight over the city or landscape. Zoom task is implemented easily by lowering or lifting during the flight.
Filter task may be borrowed from cartography (and Information Visualization based on cartography techniques). There is the method of filtration on maps presented geographical data – to eliminate some types of information from the overall picture as for example human settlements may be eliminated from the map presented ground reliefs. The analogy of cartography shows that Landscape metaphor is preferred then City metaphor in the case of Filter task.
Details-on demand task, as well as Relate task may be implemented within the framework of the extended Room-Building-City metaphor by means “passing” down the street and “inputs” inside buildings and rooms.
History and Extract tasks may realized naturally in frameworks of City and Landscape metaphors.
In the case of the Molecule metaphor one may try to realize Overview task by using the possibilities of flying-around of molecules and “inputs” inside “atoms” (or certain “particles”).
City, Landscape and Molecule metaphors allow to develop the visualization systems satisfying some criteria based on Schneiderman's scheme. However, the full “Shneiderman’s Mantra” is implemented with difficulty. Note also some peculiarities when using the “Shneiderman’s Mantra” for evaluations of Software Visualization.
Schneiderman's scheme may be applied to evaluate Software Visualization in cases when corresponding systems are destined to be analyzed large volumes of abstract data similar to Information Visualization systems. In other cases these scheme is not applicable. Schneiderman's criterion is based on check of necessary, but not ampleness conditions of quality of Information Visualization. The use of the Schneiderman's scheme presupposes the existence of large structured data volumes. But in this case the resulted visualization has to be a manageable size. More importantly it is assumed that the user either knows what she/he searches or at least she/he is able to recognize it. In the case of “circular bundle” the new complicated abstract visualization technique (based on the new metaphor) is used. The user should always correlate the images with non-obvious representations of interesting data. Similarly the visualization techniques based on using different charts and diagrams in many cases generate abstract and nontrivial representations. In the case of high-performance computing the methods of visualization for execution traces may be ineffective, due to the complexity of both the analysis of codes execution, and large data volumes. Such considerations can be applied for many new abstract methods (visualization metaphors) for complex data representation. The views using modification of statistical diagrams and charts scale insufficiently. They can't map the execution of hundreds and thousands of parallel processes. Also let's state a remark about “natural” metaphors using. Interpretation of graphical displays implemented in the framework of the “natural” metaphors, for example, interesting “animation” Brain metaphor, often is not obvious. The naturalness of imagery in the cases of City and Landscape metaphors can sometimes distract users. Also, there are problems of perception and interpretation of large and huge data volumes. For example, the flickering and blinking animation displays observation may be unusual and unpleasant. Users of systems based on virtual reality can have discomfort in the form of dizziness and so forth. There is the problem of selecting the objects to be visualized in the debugging process. In the case of parallel computation the definition of program objects associated with its “bug” states is a difficult task. Set and the essence of the analyzed program objects differ markedly in the various paradigms of parallelism. The execution trace is only one of possible entities subjected to analysis and, as a consequence, to visualization. In the case of performance tuning there is also no clarity with selection of entities which can help to improve performance.
5. Some issues of software visualization
In the report [49] it was noted that the goal of visualization is to leverage existing scientific methods by providing new scientific insight through visual methods. Visualization should form (or facilitate to form) holistic mental models and as a consequence to create insight. The occurrence of insight is considered as one of the main criteria in evaluating the visualization quality [50]. Although, an evaluation of the presence or absence of insight is subjective but this factor is prominent in visualization. The insight in visualization is connected with user’s mental models. The insight forms the new mental model of entities under analysis and visualization. And on the other hand the insight is based on pre-existing user’s mental models. One of the main tasks of computer visualization is to develop the visual representations of the major entities of computational models for valid interpretation of modeling results. A process of interpretation is the exact generation of representative cognitive structures from visual images perception. This process is inverse or more exactly mutually clarifying to visualization. The representative cognitive structures draw on formal (or informal) descriptions of processes and entities under considerations which are well-known to designers and users of visualization systems.
For example in case of program debugging one may say about reasonably well-defined mental models of program execution dynamics. The visualization helps to understand right or wrong the program executes. In [26] the specialized visual means of software supporting development processes, and program debugging are described. Thus both graph-based views and the three-dimensional animations based on Particle metaphor similar to Molecule metaphor are used to represent various aspects of program executions. Resultant animated visualization considers both peculiarities of the hardware and programming languages, and mental models and requirements of software developers. (See Fig. 15.)
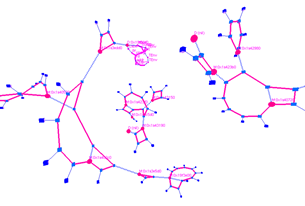
Fig. 15. Visualization of the graph of compilation [26].
The success of visualization is possible due to adequate mapping of the representative cognitive structures, where the preconceived mental picture of the phenomenon or process is rendered as images on the screen. These images in turn have to represent structures of modeling objects and data corresponded to them. Analysis of model objects structures has to help in views design. Views designed to represent object structures have to map relations between elements of model objects. Views mapping object structures define the techniques of their interpretation. The task of visualization in this case is to build the graphical image that allows correct reconstruction of mental image (representation) of the original object. If the wrong methods of visual representation of the original entities were selected, then because of the “bad” imagery the reconstruction will be difficult or even impossible. Also, it may happen that the wrong method of mapping the relations between the elements was selected. In this case, erroneous, although similar in composition to the original, cognitive structure will be reconstructed. Therefore, a criterion of correctness for choice (or design) of views is needed. The design of views may be based on the rule that the structure of the visual image should not conflict with the structure of the original object. During steps of the interpretation the relationships absent in the original objects should not appear. However, the reduction of dimension, as well as the reduction of the entire structure is possible in that case if the user (interpreter) was informed about these reductions. Naturally, when the element is not mapped, the relationship in which it was with the other elements, also not shown. This rule can be called criterion of structure conservation [51].
According to some experts’ opinion one may consider the structures of execution traces and of call graphs as linear structures. It may appear that the opinion is reasonably sufficient. But it is generally believed that execution traces and call graphs have a two-dimensional structure. In this case the criterion of structure conservation shows that 2D images are sufficient to represent adequately the two-dimensional structures of execution traces and call graphs. Perhaps this sufficiency is accounted for using of traditional two-dimensional views based on statistical diagrams for representations of these entities in modern performance tuning systems.
Approaches to formalized evaluations of Software Visualization views used in performance tuning and debugging of parallel programs are offered in [52]. In addition, it is noted that the parallel coordinates codes used in Information Visualization to depict the efficiency of economic models [53] may be used Software Visualization to depict the effectiveness of parallel computing. The concept “effectiveness” in economy may be determined through the ratio of the resulting product to its sources (resources). That way on the analogies of economy one may evaluate parallel programs. In the case of parallel programs, one may consider actual processor time or cache hit rates. In the case of fine partition for example on processor time or program length a value interval of resources has to converge to a point to the most effective value. In EXTRAVIS system (a tool for the visualization of large traces) the views used to to depict the execution traces, such as the massive sequence views [54] (see Fig. 16.) used approaches similar to the approaches of parallel coordinates codes used to depict “economic efficiency”.
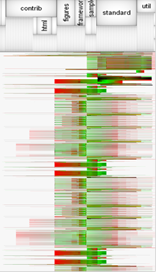
Fig. 16. EXTRAVIS’ massive sequence view [54].
Note another issue connected with possibilities of the visualization systems implementation based on various metaphors. Let's consider as an example the metaphor suggested as a part of our recent studies [55]. The analysis of parallel programs based on message passing paradigm requires consideration of a number of concurrently running processes whose work may depend on events occurring in a every single process.
One may consider the time as an axis that is analogous to traditional spatial axes. And the event stream may be depicted along this axis. Any change in this stream may break the whole chain of cause-and-effect relations. In this case the idea of the movement in time in both directions seems to be natural. One may consider a set of parallel processes as consistent streams of events flowing and changing along this time axis. In this case effects of an event in a process attract the reaction, mentioning both the process in which it has occurred, and other processes. It is possible to correct errors with returning back it time along the axis and the interfering with the event sequence at the moment.
This approach can be described as the “Time Machine” metaphor. Note that the use of the “Time Machine” metaphor does not require any knowledge of the source (science fiction novels). We have developed a prototype of the visualization component for the parallel process control and representation system. This system may be used for debugging of parallel programs. We use the 3D figurativeness for visualization of processes. Processes are represented in the form of the color cylinders connected among themselves by thin “threads” (similarly to visual representations in VisuaLinda system [56]). Globules representing data are moved along these threads. Statuses of processes are depicted by colors. The user may navigate along the time axis and change the processes statuses (see Fig. 17). The “time machine” metaphor may be considered as similar to traditional “Record-player” metaphor. But in the case of “Time Machine” there is the possibility of event changes described by well-known “Butterfly Effect” metaphor which is connected with the situation when small change of initial conditions attracts the big and often unpredictable effect.
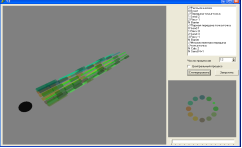
Fig. 17. Debugger based on “Time Machine” metaphor [55].
Time Machine metaphor was seemed perspective for software visualization of parallel computing. However after analysis of its implementation this impression may be changed. In this case further development of fully-fledged debugging and visualization facilities for parallel programs is needed, for example, trapping events, on-line visualization and other tools, similar to means implemented in the debuggers of the 1990-th years such as [57], [58]. Considering the possibility of implementation such “complicated” metaphors as Brain metaphor or “Circular Bundles” metaphor described above, it appears that these metaphors can be rather simply implemented for example by post-mortem visualization of the data collected during work of the parallel programs. Thus, one more way of visualization evaluation is needed – the evaluation of
implementation efforts. This evaluation may be important for designers of Software Visualization systems.
6. Conclusion
As pointed out above in the mid 90-ies of XX century researchers and specialists had high hopes for Software Visualization for parallel computing. Systems for performance tuning and program debugging for the then supercomputers were realized in a number of powerful research centers [57-61]. However, later certain stagnation in the field of Software Visualization emerged. Apart from reasons connected with realization problems it may be caused by factors related to user mental models, problems of the user perception of visual data. In the pre-design analysis the consideration of whole range of evaluations is necessary to take into account different factors. Contradictions between representation opportunities and visualization perception, analysis and interpretation abilities of the users exist. Interesting metaphors can give pictures difficult to interpret or demand big efforts when developing. Scaling problem remains unsolved for many techniques of Software Visualization for Parallel Computing. This problem is related to fundamental limitations on placing “big pictures” on the screen and in virtual reality environments, and the user perception and interpretation of “big data” generated by debugging and performance tuning systems.
The example of another approach to Software Visualization of parallel computing in particular visualization of scalability analysis is described in [62] where a concept of the scalability metric for parallel programs is introduced. The scalability metric is described as the function of several variables and is depicted as 3D surface. This technique allows to use three-dimensional representations of objects usual for the frameworks of Scientific Visualization. The interpretation of such views is familiar for specialists. In our opinion we need similar approaches in some sense. The formalization of parallel computing and in particular performance tuning may be useful to resolve problems of Software Visualization.
As pointed out above experience shows that the consideration of user’s mental model is needed to solve the problems of software visualization. In [63] the problems of user’s mental imagery and software visualization in teams developing high-performance software are described. In the specific case the user’s mental model is reflected in the form of visual maintaining of a program developing process.
Thus as of ways of overcoming of the recession in Software Visualization for parallel computing, the following tasks may be considered:
- design and/or the search for new metaphors and views of Software Visualization systems;
- researches in the domain of perception of large and huge volumes of visual data including problems of perception and condition in virtual-reality environments;
- analysis of user activity during interacting with systems of Software Visualization, the study of their mental models and the design of system’s views in accordance with these models;
- formalization of evaluation methods of visualization metaphors and views, development of methods for verification and validation of visualization, developing on the base of formal techniques new visualization techniques [52, 62, 64, 65].
However, in general, the simple answer to the common problems does not exist. We need of complex efforts of researchers of various areas and software developers to create effective systems of Software Visualization for Parallel Computing.
References
1. Charters S.M., Thomas N., Munro M. The end of the line for Software Visualisation?. Proceedings of the 2nd Workshop on Visualizing Software for Analysis and Understanding. Society Press. Pp. 10-112.
2. Knight C., Munro M., 2001. Software Visualisation Conundrums. University of Durham, Computer Science Technical Report 05/01, July 2001. http://vrg.dur.ac.uk/papers/getpaper.php3?id=27
3. Sigovan C., Muelder Ch.W., Ma K.-L. Visualizing Large-scale Parallel Communication Traces Using a Particle Animation Technique. Computer Graphics Forum. Volume 32, Issue 3. June 2013. Pp. 141-150.
4. Mohr B., 2014. Scalable parallel performance measurement and analysis tools - state-of-the-art and future challenges. Supercomputing frontiers and innovations. Volume 1. Number 2 (2014). Pp. 108-123.
5. Haugen B., Richmond S., Kurzak J., Steed Ch.A., Dongarra J. Visualizing execution traces with task dependencies. Proceedings of the 2nd Workshop on Visual Performance Analysis (VPA '15). Article No. 2.
6. Huynh A., Thain D., Pericas M., Taura K. DAGViz: a DAG visualization tool for analyzing task-parallel program traces. Proceedings of the 2nd Workshop on Visual Performance Analysis (VPA '15). Article No. 3.
7. Drebes A., Pop A., Heydemann K., Cohen A. Interactive visualization of cross-layer performance anomalies in dynamic task-parallel applications and systems. Proceedings of IEEE International Symposium on Performance Analysis of Systems and Software (ISPASS) 2016. Pp. 274 – 283.
8. Lange D.B., Nakamura Y., Object-Oriented Program Tracing and Visualization. IEEE Computer, V. 30, No 5 (May 1997). Pp. 63-70.
9. De Pauw W., Heisig S., Zinsight: a visual and analytic environment for exploring large event traces. Proceedings of the 5th international symposium on Software visualization, ACM, 2010. Pp. 143-152.
10. Trumper J., Bohnet J., Dollner J. Understanding Complex Multithreaded Software Systems by Using Trace Visualization. Proceedings of the 5th International Symposium on Software Visualization, ACM. 2010. Pp.133-142.
11. Trumper J., Telea A., Dollner J. ViewFusion: Correlating structure and activity views for execution traces.. Proc. of 10th Theory and Practice of Comp. Graph. Conf. Euro. Asso. for Comp. Graph., 2012. Pp. 45-52.
12. Karran B., Trumper J., Dollner J., 2013. SYNCTRACE: Visual Thread-Interplay Analysis. Proceedings of the 1st Working Conference on Software Visualization, IEEE Computer Society, 2013. 10 pp.
13. Cornelissen B., Holten D., Zaidman A., Moonen L., van Wijk J.J., van Deursen A. Understanding execution traces using massive sequence and circular bundle views. Proc. of the 15th IEEE Int. Conf. on Program Comprehension. IEEE, 2007, pp. 49-58.
14. Cornelissen B., Zaidman A., Holten D., Moonen L., van Deursen A., van Wijk J.J. Execution Trace Analysis through Massive Sequence and Circular Bundle Views. Journal of Systems and Software. Vol. 81. 2008. Issue 12, December. Pp. 2252-2268.
15. Jerding D.F., Stasko J.T. The information mural: A technique for displaying and navigating large information spaces. IEEE Trans. Vis. Comput. Graph., 1998, 4(3). Pp. 257-271.
16. Osawa N. An Enhanced 3-D Animation Tool for Performance Tuning of Parallel Programs Based on Dynamic Models. SPDP 98 Welches Or. USA. Pp.72-80.
17. Waller J., Wulf Ch., Fittkau F., Dohring Ph., Hasselbring W. SynchroVis: 3D Visualization of Monitoring Traces in the City Metaphor for Analyzing Concurrency. First IEEE Working Conference on Software Visualization (VISSOFT), 2013. 4 pp.
18. Fittkau F., Waller J., Wulf Ch., Hasselbring W. Live trace visualization for comprehending large software landscapes: The ExplorViz approach. Proceedings of the 1st Working Conference on Software Visualization (VISSOFT), IEEE Computer Society, 2013. 4 pp.
19. Kobayashi K., Kamimura M., Yano K., Kato K., Matsuo A. SArF Map: Visualizing Software Architecture from Feature and Layer Viewpoints. 21st IEEE International Conference on Program Comprehension (ICPC), 2013. Pp. 43-52.
20. Palepu V.K., Jones J.A. Visualizing constituent behaviors within executions. Proceedings of the 1st Working Conference on Software Visualization (VISSOFT), IEEE Computer Society, 2013. 4 pp.
21. LaToza T., Myers B. Visualizing call graphs. IEEE Symp. on Visual Languages and Human-Centric Computing, 2011, pp. 117-124.
22. Bohnet J., Dollner J. Visual exploration of function call graphs for feature location in complex software systems.. Proc. of Symp. Soft. Vis., 2006, pp. 95-104.
23. Bohnet J., Dollner J. Facilitating Exploration of Unfamiliar Source Code by Providing 2½D Visualizations of Dynamic Call Graphs. Proceeding of 4th IEEE International Workshop on Visualizing Software for Understanding and Analysis, 2007. VISSOFT 2007. Pp. 63-66.
24. Averbukh V.L., Baydalin A.U., Ismagilov D.R.,Kazantsev A.U., Timoshpolskiy S.P. Utilizing 3D Visualization Methophors. Proceedings of 14 International Conference “Graphicon”. 2004, Moscow, Russia. Pp. 295-298.
25. Averbukh V.L., Bakhterev M.O., Baydalin A.Yu., Gorbashevskiy D.Yu., Ismagilov D.R., Kazantsev A.Yu., Nebogatikova P.V., Popova A.V., Vasev P.A. Searching and Analysis of Interface and Visualization Metaphors. Kikuo Asai editor, Human-Computer Interaction, New Developments. Chapter 3. Vienna, INTECH. Pp. 49-84.
26. Averbukh V., Annenkova O., Bakhterev M., Manakov D. Analysis and assessment of visualization systems used in software for parallel computations. Voprosy Atomnoy Nauki i Tekhniki, series “Mathematical Modeling of Physical Processes”, (2015, issue 4). Pp. 58-70.
27. Malloy B.A., Power J.F. Using a Molecular Metaphor to Facilitate Comprehension of 3D Object Diagrams. IEEE Symposium on Visual Languages and Human-Centric Computing, Dallas, Texas, USA, September 20-24, 2005. Pp.233-240.
28. Karran B., Trumper J., Dollner J. SYNCTRACE: Visual Thread-Interplay Analysis. Proceedings of the 1st Working Conference on Software Visualization, IEEE Computer Society, 2013. 10 pp.
29. Waller J., Wulf Ch., Fittkau F., Dohring Ph., Hasselbring, W. SynchroVis: 3D Visualization of Monitoring Traces in the City Metaphor for Analyzing Concurrency. First IEEE Working Conference on Software Visualization (VISSOFT), 2013. 4 pp.
30. Caserta P., Zendra O., Bodenes D. 3D Hierarchical Edge Bundles to Visualize Relations in a Software City Metaphor. Proceedings of 2011 6th IEEE International Workshop on Visualizing Software for Understanding and Analysis (VISSOFT). 8 pp.
31. Averbukh V.L. Visualization metaphors. Program and Computer Softw. 27 (2001). Pp. 227-237.
32. Averbukh V.L. Approach to Semiotic Theory of Computer Visualization. The Advances in Computer Science: an International Journal (ACSIJ). Vol. 4. Issue 1. Pp. 44-55.
33. Averbukh V.L., Bakhterev M.O., Manakov D.V. Validity of Metaphors and Views of Software Visualization for Parallel Computing. 24th International Conference in Central Europe on Computer Graphics, Visualization and Computer Vision. WSCG 2016. Plzen, Czech Republic May 30 – June 3, 2016. Posters Proceedings. Pp. 53-56.
34. Wettel R., Lanza M. Visualizing Software Systems as Cities. 4th IEEE International Workshop on Visualizing Software for Understanding and Analysis, VISSOFT 2007. 24-25 June 2007. Pp. 92-99.
35. Balzer M., Noack A., Deussen O., Lewerentz C. Software Landscapes: Visualizing the Structure of Large Software Systems. Proceedings of the Sixth Joint Eurographics - IEEE TCVG Conference on Visualization VISSYM’04. 2004. Pp. 261-266.
36. Card S.K., Mackinlay J. The structure of the information visualization design space. Proceedings of the 1997 IEEE Symposium on Information Visualization. 1997. Pp. 92-99.
37. Brath R. Metrics for effective information visualization. Proceedings of the 1997 IEEE Symposium on Information Visualization (InfoVis '97). Pp. 108-112.
38. Chen Chaomei, Mary P. Czerwinski M.P. Empirical evaluation of information visualizations: an introduction. International Journal of Human-Computer Studies, 53(5). 2000. Pp. 631–635.
39. Nusrat S., Alam Md.J., Kobourov S.G. Evaluating Cartogram Effectiveness. 2015. arXiv:1504.02218v1 [cs.HC]
40.Ware C., Purchase H.C., Colpoys L., McGil Ml. Cognitive measurements of graph aesthetics. Information Visualization, 2002.1(2). Pp. 103–110.
41. Baum D. Introducing Aesthetics to Software Visualization. Short papers proceedings / WSCG'2015 - 23rd International Conference in Central Europe on Computer Graphics, Visualization and Computer Vision. 2015. Plzen 2015. Pp. 65-74.
42. Bennett Ch., Ryall J., Spalteholz L, Gooch A. The Aesthetics of Graph Visualization. Proceedings of the Third Eurographics Conference on Computational Aesthetics in Graphics, Visualization and Imaging. 2007. Pp. 57-64.
42. Huang Weidong, Eades P., Hong Seok-Hee Measuring effectiveness of graph visualizations: A cognitive load perspective. Information Visualization (2009) 8, 3. Pp. 139-152.
43. Carpendale Sh. Evaluating Information Visualizations. Information Visualization: HumanCentered Issues and Perspectives. Volume 4950 of the series Lecture Notes in Computer Science. 2008. Pp 19-45.
44. Brehmer M., Munzner T. A multi-level typology of abstract visualization tasks. IEEE Transaction on Visualization and Computer Graphics, 19(12). 2376 – 2385, 2013.
45. Maletic J.I., Marcus A., Collard M.L. A task oriented view of software visualization. Proceedings of International Workshop on Visualizing Software for Understanding and Analysis. 2002. Pp. 32-40.
46. Müller R., Zeckzer D. The Recursive Disc Metaphor: A Glyph-based Approach for Software Visualization. 6th Int. Conf. on Inf. Vis. Theory and Applications, IVAPP. 2015. Pp. 171-176.
47. Shneiderman B. The Eyes Have It: A Task by Data Type Taxonomy for Information Visualizations. Proceedings of the IEEE Conference on Visual Languages. 1996. Pp. 336-343.
48. Wiss U., Carr D., Jonsson H. Evaluating Three-Dimensional Information Visualization Designs. A Case Study of Three Designs. Proceedings of International Conference on Information Visualisation, London, England. 1998. Pp. 137-144.
49. McCormick B.H., DeFanti Th.A., Brown, M.D. (Eds) Visualization in Scientific Computing. Computer Graphics. Vol. 21. N 6. Novenber 1987.
50. North Ch. Toward Measuring Visualization Insight. IEEE Computer Graphics and Applications May/June 2006, Volume: 26, Issue: 3. Pp. 20-23.
51. Averbukh V.L., Bakhterev M.O., Baydalin A.Yu., Gorbashevskiy D. Yu., Ismagilov D.R., Kazantsev A.Yu., Nebogatikova P.V., Popova A.V., Vasev P.A., Searching and Analysis of Interface and Visualization Metaphors. Human-Computer Interaction, New Developments. / Edited by Kikuo Asai. Chapter 3, Vienna, In-teh. ISBN 978-953-7619-14-5, pp. 49-84, 2008.
52. Manakov D. Averbukh V. Verification of Visualization. Scientific Visualization. 2016. Quarter 1. Vol. 8. N. 1. Pp. 58 – 94.
53. Yau N. Visualize This. The FlowingData Guide to Design, Visualization, and Statistics. Wiley Publishing, Inc. 2011.
54. Cornelissen B., Zaidman A., Van Rompaey B., van Deursen A. Trace Visualization for Program Comprehension: A Controlled Experiment. Delft University of Technology. Software Engineering Research Group. Technical Report Series. Report TUD-SERG-2009-001. 2009.
55. Averbukh V.L., Mikhaylov I.O., Nebogatikova P.V. New Approaches to Visualization of Processes. XIV International Conference “Super-Computations and Mathematical Modeling” Abstracts. Sarov, 2012. Pp. 15-17.
56. Koike H., Takada T., Masui T. VisuaLinda: A Framework for Visualizing Parallel Linda Programs. Proceeding 1997 IEEE Symposium on Visual Languages. IEEE. 1997. pp. 174-178.
57. Hood R. The p2d2 project: building a portable distributed debugger. Proceedings of the SIGMETRICS symposium on Parallel and distributed tools. 1996. Pp. 127-136.
58. May J., Berman F. Retargetability and Extensibility in a Parallel Debugger. J. Parallel and Distributed Computing, 35 (2), June 15, 1996. Pp. 142-155.
59. Cheng D., Hood R. A Portable Debugger for Parallel and Distributed Programs. Proceedings of the ACM/IEEE conference on Supercomputing (Supercomputing '94). 1994. Pp. 723-732
60. Yan J., Sarukkai S., Mehra P. Performance Measurement, Visualisation and Modeling of Parallel and Distributed Programs using AIMS Toolkit. Software - Practice and Experience. V. 25, N 4 (April 1995). Pp. 429-461.
61. Reed D., Scullin W., Tavera L., Shields K., Elford Ch. Virtual Reality and Parallel Systems Performance Analysis.IEEE Computer, V.28, N 11, (November 1995) pp. 57-67.
62. Teplov A.M. An approach to the comparison of parallel program scalability. Numerical Methods and Programming. 2014. Vol. 15. Issue 4. Pp. 697-711.
63. Petre M. Mental imagery and software visualization in high-performance software development teams. Journal of Visual Languages and Computing, 21 (3), 2010. Pp. 171–183.
64. Averbukh V.L., Bakhterev M.O., Manakov D.V. Validity of Metaphors and Views of Software Visualization for Parallel Computing. 24th International Conference in Central Europe on Computer Graphics, Visualization and Computer Vision. WSCG 2016. Plzen, Czech Republic May 30 – June 3, 2016. Posters Proceedings. Pp. 53-56.
65. Manakov D.V., Averbukh V.L., Vasev P.A. Visual text as truth subset of the universal space. Scientific Visualization. 2016, Quarter: 4, Vol. 8. N. 4. Pp. 38 – 49.
ОЦЕНКА МЕТАФОР ВИЗУАЛИЗАЦИИ И ВИДОВ ОТОБРАЖЕНИЯ В КОНТЕКСТЕ ПРЕДСТАВЛЕНИЯ ТРАСС ВЫПОЛНЕНИЯ И ГРАФОВ ВЫЗОВОВ.
В.Л. Авербух1,2, М.О. Бахтерев1,2, Д.В. Манаков1
1ИММ УрО РАН, Россия
2УрФУ, Россия
Аннотация
Работа посвящена вопросам оценки метафор визуализации и видов отображения систем визуализации программного обеспечения. Оценки проводятся на примерах визуализации трасс выполнения и графов вызовов параллельных программ. Проведен обзор как традиционных (например, города и молекулы) метафор, так и новых идей, придуманных специально для случая визуализации трасс (например, метафора мозга). Рассматриваются подходы к оценке, основанные на свойствах метафор визуализации. Свойства метафор комнаты, здания, города и метафоры молекулы рассматриваются с позиций их использования для представления сверхбольших объемов структурированной информации о работе параллельных систем. Далее рассмотрены оценки визуализации с позиций, так называемой, мантры Шнейдермана – схемы визуального поиска, используемой при поиске и анализе информации в больших объемах данных. (Overview, Zoom, Filter, Details-on-demand, Relate, History, Extract.) Указывается на ограничения оценок, сделанных по данной схеме. Кроме этого, в работе рассмотрен ряд проблем проектирования систем визуализации программного обеспечения параллельных вычислений. Указано на необходимость формализации подходов к оценкам визуализации.