MULTISENSORY ANALYTICS FOR SEVERAL INTERCONNECTED SCALAR FIELDS ANALYSIS
E. Malikova1, A. Pasko1,V. Adzhiev1,V. Pilyugin2
1National Centre for Computer Animation, Bournemouth University, Bournemouth, United Kingdom
2National Research Nuclear University "MEPhI", Moscow, Russian Federation
Contents
1. Multisensory visualization in modern research. Related works
2. An approach to multisensory data analysis pipeline. Visual-auditory analysis case
3. Multimedia coordinates based approach for visual-auditory analyses
4. Framework main features, cases examples
Abstract
In our day it's hard to imagine modern research in sophisticated scientific area without use of visual analytics tools. However, humans are able to receive and analyze information about world around them not only through their eyes, but with help of other sensory stimuli as well and there is no reason why scientific data analyses should be an exception. As a result, there is a lot of research done recently in area of multimodal interfaces that are сcharacterized by various sensory stimuli involvement and especially in visual-auditory interfaces development. In this work we introduce multisensory analytics approach, discuss theoretical issues, introduce main concepts of software tools implementing our approach, describe one of the possible auditory-visual mappings methods for particular case of scalar fields analyses - simultaneous interconnected scalar fields analyses and give practical examples.
Keywords: scientific visualization, multisensory analysis, FRep, sonification
1. Multisensory visualization in modern research. Related works
Visual analysis of graphical representation of data has practically become a part of modern scientific research. It should be taken into consideration that researchers, as all people of creative professions, are predisposed to spatial creative thinking, so in the process of analysis of scientific data, they usually readily refer to various spatial and graphic images. This is one of the reasons, why scientific visualization and it's successor visual analytics as a method of data analysis has proven to be a very efficient tool often used by researchers. A quite general definition of visualization is "a binding (or mapping) of data to a representation that can be perceived" [1] is used more often nowadays and thus visual analysis is extended to become multisensory analysis. Among the sensory stimuli other than visual, the usage of sound has been widely investigated since early 80-s [2], [3]. Some fundamental works, were most advantage and disadvantages of auditory interfaces were summarized and main future directions of work in this area were defined in 90-s [4]. The human auditory perception is considered most quantitative because of its sensitivity to subtle changes in the sound characteristics. The technique of data representation using variable sound characteristics such as pitch, volume, note duration, rhythm and others is called data sonification [5]. Let us look at sonification method advantages and some stages of this research area development more closely. The most evident thing about auditory system is that it has always been the human's early warning system, which may operate in the background mode, what is especially important in situations when researcher visual system is entirely concentrated on some other process. In a small survey was made on the situations when using audio analysis may be even more effective than visual perception. The main classes of data that fall in this category are time-varying data and multidimensional data. The auditory perception brings the unique advantage to distinguish even small variations in the parameters of the single sound wave and to compare sound waves and thus can efficiently complement standard visual analyses, and help solving perceptional issues it often has to face [7], [8]. As it was already noticed in [9] currently, it is considered that any person may be trained to develop an ear for music and ability to adequately judge on all its nuances allows one to take advantage of the most advanced extended sound analysis capabilities as well. In [10] the procedures of time-varying data representation in the graphical form using a musical accompaniment are considered. In the paper [11], there are examples of the presentation of scientific data in the form of musical fragments. This is largely a matter of sensory capabilities of a researcher, but in general in some cases just sound mapping and analyses can be successfully carried out. We will consider such possibility in this article, however, we are mostly concentrated on efficiently combining auditory and visual perception approach, that allows one to significantly enhance the ability to conduct analysis, taking advantages of two sensory organs that work differently, and to perceive the same information in different ways complementing each other. An extension of visualization through creating additional perceptual human inputs or more general a combination of several sensory stimuli for data representation is called data perceptualization [12], [13] (or data sensualization [14]). The typical combinations are between visual and auditory stimuli, visual and tactile/haptic stimuli [15], or three of these stimuli applied together [14]. As it was already mentioned in this article, we will concentrate on a visual-auditory data analysis practical case, although theoretical formalizations of establishing correspondences between the initial data and multiple sensory stimuli for multisensory analysis are assumed and were given in [16]. However, the problem of formalization of multiple sensory stimuli analysis and interpretation of analysis results in terms of initial data should be solved separately for each sensory stimuli.
2. An approach to multisensory data analysis pipeline. Visual-auditory analysis case
To obtain a multisensory representation we need to create a spatial scene [9], which is an assembly of spatial objects with their geometric, optical, sound and others descriptions. Then corresponding visual, sound and other stimuli can be generated using some specialized rendering procedures for further multicensory analysis. Based on the visual analytics process as presented in [17] and the idea of an intermediate multidimensional geometric representation of initial data [18], we proposed [9] the following interpretation of the basic multisensory analysis process 1.
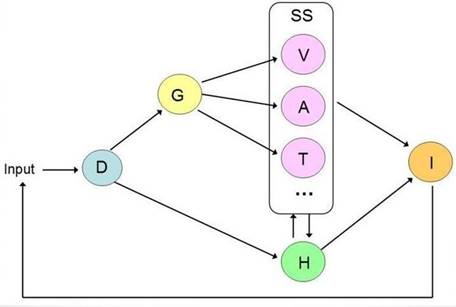
Fig. 1. Multisensory analysis process.
In the Fig. 1 perceptualization process is presented as a transformation (mapping) M: D -> I from initial data D to insight I, which is the goal of the entire process. The mapping M is a superposition of mappings from one set to another in the diagram. Thus, the initial data undergo geometric interpretation and are mapped to the set G of multidimensional geometric models. The next step is to generate several sensory stimuli SS for human perception. The mappings from G to SS are facilitated by the introduction of a spatial scene, which is an assembly of spatial objects with their geometric, optical, auditory, tactile and other properties (multimedia objects). Note that the geometric objects in the spatial scene can have their dimensionality reduced to 2D and 3D using geometric cross-sections and projections, which allows for applying well-known graphical rendering algorithms. When such a spatial scene is constructed, various sensory stimuli can be generated using corresponding rendering procedures: visual stimuli V (graphical images), auditory stimuli A (sounds), tactile and haptic stimuli T, and others. A final insight I can be either directly obtained from the generated sensory stimuli through human perception and analysis, or it is obtained in a combination with generating a hypothesis H and its analysis including automated methods. Note that the hypothesis H can be also represented with visual and other sensory stimuli. The entire process has iterative character, which is shown by the feedback loop in the diagram. The user may tune not only the parameters of the data input, but also the introduced geometric models, the hypothesis, the selection of sensory stimuli and the type and parameters of rendering procedures. Applying the presented general approach the process of data analysis involving both human vision and hearing, we need to do the following:
1. To obtain a mapping of the given data onto its representation in the form of images and sound. To obtain a necessary model of a spatial scene, its geometric and optical models need to be extended by a sound model. Such a spatial scene augmented with sonification needs to be put in correspondence to the given data and then sound rendering can be applied with output to speakers or some other sound output device for further analysis.
2. To analyze the rendered images and sound and to interpret the results of this analysis in terms of the initial data.
The definition of corresponding sound mappings that can be concretely analyzed and easily interpreted by researchers is also a question that should be studied. Here we suggest that a researcher in common case should be trained to interpret some not quite evident sound mappings similar to musicians training their ears for further music analysis in modern practice . In our work, we take advantage of musicians' approach adopting well-known concepts of music analysis and writing used by musicians from simple properties of sound analysis (pitch, volume, duration, etc.) to music properties analysis (tone, interval between tones, etc.). These concepts are taken as the base of sound mapping and accordingly of sound analysis. 2 presents some musical (sound) characteristics that musicians may distinguish auditory and describe quantitatively: tone, note duration, interval between two notes are most often used ones.
|
|
|
|
(a) Aurally measure interval between two notes and determine tone. For this a musical scale used in musical composition should be defined first of all (minor, major,based on C,D,F note and etc.) |
(b) Aurally measure note duration. For this rhythm should be defined |
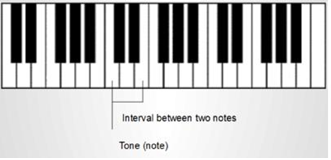
Fig. 2. Musical sound characteristics musicians may distinguish aurally
In this article, only simple cases of sound analysis, cases that for advanced analysis require some musical training (e.g., to determine interval and note) will be considered. From authors point of view, a camera, a sound receiver, a haptic cursor and other similar elements need to be explicitly placed in the spatial scene as spatial models of the human organs of perception. Thus, a spatial scene includes spatial objects representing data as well as other spatial objects representing their influence on human senses. Rendering of the spatial scene generates information for output devices provided for consideration by humans, namely a screen, speakers, a haptic device and others.
3. Multimedia coordinates based approach for visual-auditory analyses
Although some efforts have been made on the development of data perceptualization, a formal framework for establishing correspondences between data and multiple sensory stimuli has not been yet proposed. In [16] we introduced a framework based on the concept of multimedia coordinates introduced previously in [19] and applied in multidimensional shape modeling. The approach is formalization of mapping from a multidimensional geometric model to a multimedia object that can be treated as a multidimensional object with Cartesian, visual, audio, haptic and other types of multimedia coordinates. To operate with multimedia coordinates, one can introduce a system of normalized numerical coordinates (a unit cube) and its one-to-one correspondence to the multimedia space (Fig.3).
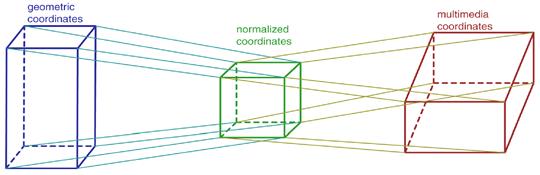
Fig.3. Mapping from geometric to multimedia coordinates using normalized coordinates.
By selecting a real normalized value, one can use the corresponding value of the multimedia coordinate [16]. Each geometric coordinate variable takes values within a given interval and multimedia coordinates also have their own variation intervals as well. So to de ne the mapping, one has to establish a correspondence between these intervals through the normalized numerical coordinates. Thus a space mapping between geometric coordinates and multimedia coordinates establishes correspondence between the multidimensional shape and the multimedia object. In this way, a correspondence can be also established between the given scientific data and a multimedia object, because introducing a multidimensional geometric model is one of the steps in the visualization pipeline presented previously. As for multidimensional geometric model involved in multisensory visualization we used approach based on a constructive method to the creation of function evaluation procedures for geometric shapes, called the Function Representation (FRep) [20] and it's extension HyperVolume [21], where the object is represented not by a single function, but by a vector-function with one component responsible for the object geometry and other components serving as point attribute functions representing such object properties as material, color, transparency, sound characteristics and others.
Thus both multimedia coordinates and hypervolume model for describing multimedia object are quite interconnected within presented approach used. To visualize a multidimensional geometry (or scalar fields) special methods and geometric modelling techniques controlled quite well within multimedia coordinates concept are used. Usually they are:
1. use of several semitransparent colored isosurfaces (see example ( Fig.4 (a)) in case when dimensionality of geometric object is not greater than 4D.
2. projections on a subspace
3. cross-sections (see example Fig.4(c)).
|
|
|
|
(a) Visualization of scalar order-parameter field distribution |
(b) Visualization of electron density and electrostatic potential field of HCN molecule |
|
|
|
|
(c) Visualization of dynamic electron dencity field of Ñ2H2 molecule with use of spreadsheet technique |
|
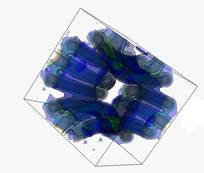
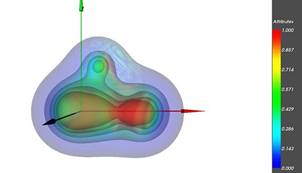
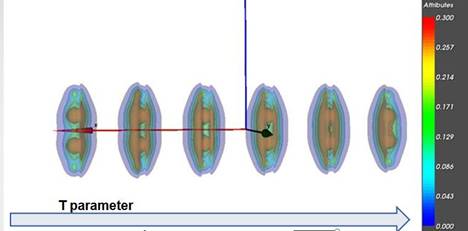
Fig. 4. Examples of static and dynamic scalar fields visualization
For more effective analysis these geometric operations may be defined interactively, through providing some specialized interactive widgets (plane, hypercube widgets to de ne cross-section and etc.). Also, some special types of spatial scene may be introduced to provide special graphical representations called matrices of cross-sections or spreadsheats. An according type of multimedia coordinates was introduced in [19] and is called spreadsheet coordinates. This type of coordinates allows for spreadsheet-like spatial organization of elementary images or shapes in the regularly or irregularly placed 1D, 2D or 3D nodes.
As in this work we have to deal with two scalar fields simultaneous analyses, let us consider a simple case HCN molecule. Quite a common approach of it’s two scalar fields analysis electron density and electrostatic potential is to draw isosurfaces of electron density filed and color their points with according values of electrostatic potential field. Here we have specific types of multimedia coordinates:
1. "x "y" and "z" types correspond to world coordinates in the Cartesian coordinate system. They are used to describe a set of 3D isosurfaces f(x,y,z)=c, where c is a value of electron density field in this point
2. "c" type corresponds to a photometric coordinate, namely the color, representing a value of electrostatic potential field .
It should be noted that we have to reduce dimensionality not only to obtain graphical representation, but as well to map our data into sound and other type of sensory stimuli. In [9] we demonstrated basic interactive techniques, when sound with predefined by data characteristics is produced in selected point. In this article we are concentrating on more extended that in general may be used by researches without preliminary theoretical knowledge in music analyses, although this knowledge will make analyses more efficient and extended, and on base of them analyses may be carried out even without visual information. We'll give detailed examples and explain analyses process in details. As previously [9], we propose some generalizations on base multimedia coordinates approaches for specific type of multidimensional data multisensory analysis - scalar fields, bringing together some most well-known interactive, photometric and geometrical techniques and demonstrating how they can be extended by other multisensory techniques on the example of sound.
4. Framework main features, cases examples
The presented below results of visual-auditory analyses were obtained with developed framework, based on HyperVolume object that influences various sensory stimuli (visual and sound in particular case) conception as base for computer scene model in multisensory analyses pipeline. The framework is designed on base of OpenSource projects VTK [24], Hyperfun [23] and OpenAL [25] in a form of API for writing standalone applications using C++ and scripting languages Hyperfun and Python. Considering two interconnected scalar fields simultaneous analysis (Fig.4(b)), we've tried two approaches to scalar fields data mapping to sound characteristics:
1. direct sound characteristics mapping (frequency, volume) and generating wave with specified parameters. This an approach we've tried in our earlier works that helped us to make basic judgements on changes on specific mapped value (it's growing or falling and etc.) [16]
2. mapping to abstract musical terms and operating them in entire analyses process. Notes, intervals, musical scale, musical instrument used, etc. As it will be demonstrated below this approach provides possibilities for more extended analyses.
As it was noted previously, in multimedia coordinates concept multimedia coordinates also have their own variation intervals, for example, color varies inside the color space (RGB cube). It's a well-known that to judge about geometric value mapped into color an according color scale is used. Similarly, in music theory, there is an approach to judge about notes on base of their position on a specified scale (Cmaj for example), in other words, relative to the tonic, the first and main note of the scale from which each octave is assumed to begin. So in music terminology, that we adapt each note has a scale degree, that is it's position on scale. Example of C-major scale with according scale degrees C D E F G A B, in which C is the tonic). Usually such degrees are quite easy to learn to distinguish aurally after some special tuning for specified scale (a basic exercise in musical training). It is possible to assign a scale degree to the 12-tone chromatic scale, but this distinguishing such degrees and intervals variety is more di cult and demands training. In our framework we've chosen as base for sound analysis Cmajor scale of 1-3 octaves. Notes sound generated on piano, guitar, flute or other instruments of user choice. As we mainly concentrate on a simple rendering cases, easy to perceive and analyze, the cases believed that practically anyone (without no damage of hearing system) can be capable to perceive and analyze after some simple harmonic ear training ( musical school level) we introduce following data preprocessing steps in order to take into consideration perception issues of musical training and analyses as well: If we consider visual analyses of scalar fields, on base of visual information we mainly carry out two forms of analyses:
1. shape analyses
2. feature analyses, in particular change in form.
Sound analyses also permits to judge about these and in particular efficient in all sort of changes detection as it was mentioned above. But we are limited by value of interval between notes that we may distinguish aurally to perform more extended analyses (not only to judge it value is growing or decreasing or by what value it changed). Usually we aurally quite easy distinguish changes by interval from whole tone (for some well-trained users it is semi tone ). And it's easier to work with scale of 2 octaves or one. The obtained scalar values are mapped into degrees on Cmaj 1-2 octave scale. So, for example 1 octave, that has 8 degrees represent values within selected [xmin, xmax] range. So [xmin, xmax] range is spitted on 8 subranges [Ximin, Ximax] in order each degree represents scalar value within according subrange. Like this researcher may judge on approximate scalar value aurally by according not (degree on Cmaj scale). As well in order to improve analyses we suggest user may remove unnecessary information he may neglect in analyses process. So, we suppose user may do following recommended image preprocessing steps, before mapping to sound:
1. ImageThreshold to remove scalar values not falling into selected range [xmin,xmax] we are interested in or may perform rst step analyses without. For example, if we deal with some CT of medical organ within body it has signal within given range and we want to analyze only shape boundaries and its internal structures.
2. Morphological operations on selected boundary to remove small island like parts and smooth shape boundary, to reduce noise caused artifacts
These preprocessing steps are conditional, however they may significantly increase analyses efficiency. The example will be given below (Fig.5,6).
It should be noted that in general approach is quite similar to basic techniques used for organ segmentation in image processing as entire procedure of segmentation helps in particular to analyze organs better visually. The used sound mapping technique we implement is similar to one used in medicine as well, where 3D image scan is previewed and analyses mostly as a set of 2D image slices, where scalar value is defined at each pixel with color. We project in general case multidimensional geometry to 4D space x,y,z,f and build with defined step it's crossections zi=ci that represent 2D sound images where instead of pixel position we have sound source defined by x,y values and f is mapped according musical degree on Cmaj scale. We x one by one some yj=cj values within y range and moving sound automatically with defined step xi along x axis with xed yi we sonify our 2D image line by line, thus obtaining what we call “sound matrix”. Below on Fig. 5 is presented 2D image slice of simple 4D scalar field, presented on 4 and notes of according played sound matrix 5x5, that duplicates the same information that we analyses visually.
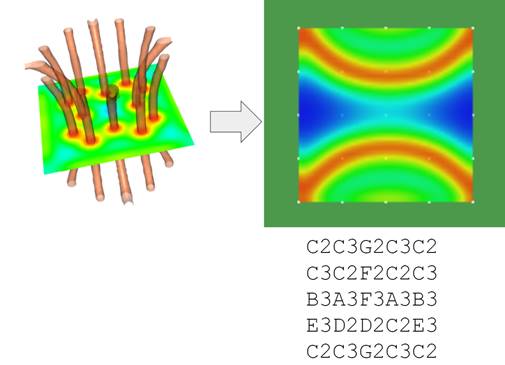
Fig.5 Visualization of scalar second order parameter field distribution selected crossection and according sound matrix with defined resolution 5x5
To simplify auditory-visual analyses the scalar field was preprocessed with image threshold technique in order to exclude from analyses all values greater than 0.5 (on image marked with white color), so C3 (C note of first octave) is played in all this range. Below on Fig.6 is presented matrix 6x6 with a bit greater resolution, still it’s easier to perceive it and analyze as a lot of data out of scope was removed as well the function value itself was inverted for perception purposes in order to start analyses with smallest value.
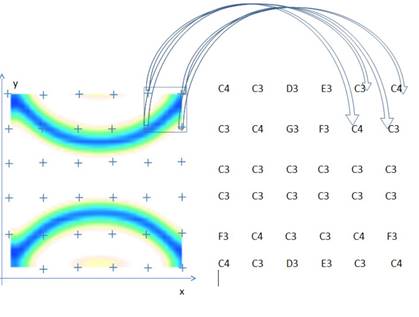
Fig. 6: Visualization of scalar second order parameter field distribution selected crossection and according sound matrix with defined resolution 6x6
It should be noted that various approaches depending on musical practical knowledge of researcher that analyses data with sound should be taken into consideration as well. So to move from basic analyses of scalar field main features (approximate form, symmetry) into details, we suggest the analyses process being interactive in general case, so it's complexity may vary. This may suggest mapping to bigger interval, or readjusting or removing some preprocessing steps described above, or increasing sound matrix resolution to perform more detailed shape analyses. This may as well include additional interactive selection of image region of interest and it's sonification, a technique that will be demonstrated further.
As in our case we mostly concentrate on use of the advantages and particularities of human hearing system (alarming system, that may operate is silent mode, those perception principles are quite various comparing to visual system) in analyses process in order to enhance it's efficiency we suggest it's most useful combination with visual analyses . It should be noted that visual information content may duplicate those mapped in sound, or some extended techniques for image features extraction and visualization may be used as combination with sound analyses.
In example below, we'll concentrate on molecular fields as their form in crossection in general case is quite simple (one or several spheres) and in case of such fields usually some general features are subject of study (symmetry, how fast is changing and etc.).
In [9] we've studied in detail a auditory-visual analyses of two molecular scalar fields, presented on Fig.4(b) that are supposed to by analyzed together (a quite usual task in physical or medical research led). In studied auditory-visual analyses case the sound wave was generated by a sound terminal with the frequency corresponding to the location of the point sound source and perceived by the user as a specific sound tone. Each sound tone generated at the location of the point source was defined on selected 2 octaves musical Cmajor scale Fig.6. Here we receive following tones presented in 5(a) and can graphically present their place on musical scale Fig.6(b). Here a basic guitar tuner was also used to illustrate the current note value Fig.6(a).
|
|
|
|
(a) The use of an interactive sphere widget to de ne sound frequency w and volume v of the generated sound defined by the functions A2 and A3 values at xed values of world coordinates x,y,z. |
(b) Presentation of according notes on Cmajor scale (2 octaves) on piano. A researcher with well-trained musical ear and appropriate ¾auditory tuning on Cmajor scale can easily aurally determine these notes and their place on piano musical scale and judge about how quantitatively sound was changed |
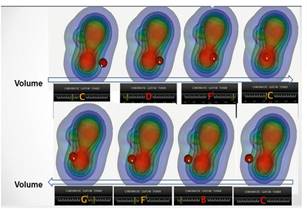
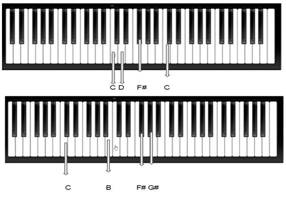
Fig. 7. Exploration of two scalar fields dependency and change with pitch and volume
We may as well study both scalar fields slice by slice, obtaining crossections with z=zi while moving along z axis with defined step. Such mapping will help us to de ne region where both scalar fields take biggest values and detect that their intensity spread can be characterized as caused by point source type (atoms position) for both fields, but those centers are a bit shifted in electron density field (a shift that is even hard to distinguish visually). The alternative to this approach may be selection of region of interest, where both fields take biggest value and simultaneous visualization of selected crossections of one field (electron density) and sonification through sound matrix mapping of obtained crossection of second field (electrostatic potential) as presented on Fig.8. This will permit us to immediately and easily detect the main trend as sound matrix of second field will demonstrate practically symmetrical trend. As well, to judge about difference in scalar field value change more efficiently we may compare generated sound matrices for two scalar fields, but for such analyses Fig.9.
|
|
|
|
a |
b |
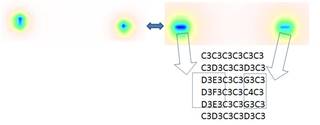
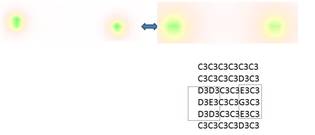
Fig.8 Visual auditory analyses by selected crossections (a,b) and sound matrixes of two scalar fields electron density and electrostatic potential accordingly of CNH molecule
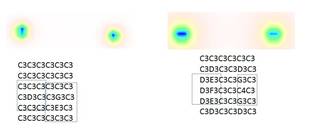
Fig.9 Visual-auditory analyses by selected crossections of two scalar fields. Sound matrix comparison
5. Conclusions
In conclusion it may be said that the formalization of the mapping between the multidimensional geometric models and the spatial scene available for rendering multiple sensory stimuli is a big research question, still to be address. However, we have shown a possible solution in the case of the initial data represented by scalar fields (real functions of several variables) and illustrated this by the case study of the scalar fields analysis using interactive visual-auditory display on base of two possible techniques. Various types of interactive visual-auditory or auditory widgets, not only those based on combination of described two, as well as various types of sound mappings can still be studied as well as possible image preprocessing techniques that are used to simplify analyses. We are planning to continue to involve the concept of multimedia coordinates as a way to establish even more complex correspondences between initial data, the introduced multidimensional geometric models and multiple sensory stimuli.
References
1. Foley J., Ribarsky B. Next-generation data visualization tools, in Scienti c Visualization, Advances and Challenges. L. Rosenblum et al. (Eds.), Academic Press, 1994.
2. Yeung E. Pattern recognition by audio representation of multivariate analytical data. Analytical Chemistry, vol. 52, No.7, 1980, pp. 1120 1123.
3. Bly S. Presenting information in sound. Proceedings of the CHI '82 Conference on Human Factors in Computer Systems, ACM, 1982, pp. 371-375.
4. Kramer G, Auditory display: sonification, audi cation, and auditory interfaces. Proceedings of the Santa Fe institute studies in the science of complexity, Vol. XVIII, 1994, Addison-Wesley.
5. Kaper H., Wiebel E., Tipei S. Data sonification and sound visualization. Computing in Science and Engineering, vol.1, No.4, 1999, pp.48-58.
6. Scaletti C., Craig Alan B. Using sound to extract meaning from complex data. In Proceedings SPIE, 1459. 1991. pp. 207 219.
7. Gaither K.; Ebert D.; Geisler B.; Laidlaw D. In the Eye of the Beholder: The Role of Perception in Scienti c Visualization. Visualization, 2004. IEEE.
8. Johnson C. Top scientific visualization research problems IEEE Computer Graphics and Applications, Volume: 24, Issue: 4, July-Aug. 2004 https: //www.cs.unc.edu/~taylorr/Comp715/papers/ johnson_top_problems.pdf
9. Malikova E., Pilyugin V., Adzhiev V., Pasko G., Pasko A. Multisensory Analytics: Case of Visual-auditory Analysis of Scalar Fields. Proceedings of the 12th International Joint Conference on Computer Vision, Imaging and Computer Graphics Theory and Applications (VISIGRAPP 2017) - Volume 3: IVAPP, pp. 322-329, ISBN: 978-989-758-228-8
10. Mezrich J. J., Frysinger S., Slivjanovski R. Dynamic representation of multivariate. time series data, Journal of the American Statistical Association 1984. Vol. 79, N. 385. pp. 34 40.
11. Lodha Suresh K., Beahan J., Heppe T. and etc. MUSE: A Musical Data Sonification Toolkit. In Proceedings of International Conference on Auditory Display (ICAD). 1997. pp. 36 40.
12. Grinstein G., Smith S. Perceptualization of scienti c data. Proc. SPIE 1259, Extracting Meaning from Complex Data: Processing, Display, Interaction, 1990, pp. 190-199.
13. Ebert D. Extending visualization to perceptualization: the importance of perception in e ective communication of information. The Visualization Handbook, C. Hansen and C. Johnson (Eds.), Academic Press, 2004, pp. 771-780.
14. Ogi T., Hirose M. Multisensory data sensualization based on human perception. VRAIS '96 Proceedings of the 1996 Virtual Reality Annual International Symposium, 1996, pp. 66-71.
15. Maciejewski R., S. Choi, D. Ebert, H. Tan. Multi-modal perceptualization of volumetric data and its application to molecular docking, WHC '05 Proceedings of the First Joint Eurohaptics Conference and Symposium on Haptic Interfaces for Virtual Environment and Teleoperator Systems, 2005, pp. 511-514.
16. Adzhiev V.,Malikova E., Pasko A., Pasko G., Pilyugin V. Multidimensional scalar fields data analysis by means of multisensory visualization. The 26-th InternationalConference GrahiCon2016,September 19-23,2016,NNGASU,Nizhny Novgorod,Russia,pp.142-146
17. Keim D., Mansmann F., Schneidewind J., Thomas J., Ziegler H. Visual analytics: scope and challenges, Visual Data Mining. Lecture Notes in Computer Science, volume 4404, Springer, 2008, pp 76-90.
18. Pilyugin V., Malikova E., Adzhiev V., Pasko A. Some theoretical issues of scienti c visualization as a method of data analysis, Transactions on Computational Science XIX, Lecture Notes in Computer Science, vol. 7870, Springer-Verlag, 2013, pp. 131 142.
19. Adzhiev V., Ossipov A., Pasko A. Multidimensional shape modeling in multimedia applications, in MultiMedia Modeling: Modeling Multimedia Information and Systems, ed. A.Karmouch, World Scienti c, 1999, pp. 39-60.
20. Pasko A., Adzhiev V., Sourin A., Savchenko. Function representation in geometric modeling: concepts, implementation and applications. The Visual Computer, vol.11, No.8, 1995, pp.429-446.
21. Pasko A., Adzhiev V., Schmitt B., Schlick. C. Constructive hypervolume modeling, Graphical Models. vol. 63, No. 6, 2001, pp. 413-442.
22. Pasko A.A., Savchenko V.V Projection operation for multidimensional geometric modeling with real functions, Theory and Practice of Geometric Modeling Blaubeuren II conference, W. Strasser (Ed.), October 14-18, 1996, Tuebingen, Germany.
23. HyperFunproject. HyperFun project.
24. VTK project. http://vtk.org
25. OpenAL Programmers Guide. http://connect.creativelabs.com/openal/Documentation/OpenAL_Programmers_Guide.pdf