VISUALIZATION OF SUPERSMOOTH SURFACES TEXTURE BY THE METHOD OF FLICKER-NOISE SPECTROSCOPY
N.I. Kargin1, A.S. Gusev1, S.M. Ryndya1, A.D. Bakun1, A.E. Ieshkin2, A.A. Akovantseva3, P.I. Misurkin4, S.G. Lakeev5, I. Matushchenko1, S.F. Timashev1,5
1National Research Nuclear University MEPhI, Moscow
2Lomonosov Moscow State University, Moscow
3Institute of Photonic Technologies, Research Center of Crystallography and Photonics RAS, Moscow
4N.N. Semenov Institute of Chemical Physics RAS, Moscow
5Karpov Institute of Physical Chemistry, Moscow
Contents
3. Main fns relations for extracting the information contained in afm scans
Abstract
A method of parameterization of supersmooth surfaces used in micro- and nanoelectronics as substrates, as well as light-reflecting elements of technical devices is proposed. The method is based on the flicker-noise spectroscopy (FNS) as the general phenomenological approach to extracting information from the chaotic temporal or spatial signals. According to FNS, the information about surface texture is contained in correlation components of the signals in different ranges of spatial frequencies - low frequency (resonance) and high-frequency, representing a sequence of different types of irregularities (spike-, jump-like, derivative discontinuities) at all levels of the hierarchy of the spatial structure of the studied systems. As the model objects, the topology of the surface of which was investigated by atomic force microscopy, the glass-ceramic samples were used before and after the ion-cluster treatment. Processing of optical glass ceramics by gas cluster ions was carried out in order to reduce the surface roughness. During the research it was determined that the ion-cluster processing at selected exposure modes leads, firstly, to the smoothing of surface defects of experimental samples as measure of which can serve the values of FNS parameters σ and Sc(L0-1), and, secondly, to its "planarization" as measure of which can serve the value of root-mean-square deviation.
Keywords: flicker-noise spectroscopy, atomic force microscopy, surface texture parameterization, glass ceramics, gas cluster ions treatment.
1. Introduction
Modern methods of scientific visualization of the surface of various objects in materials science, biology, medicine and other fields of science and technology presuppose the receipt of arrays of primary digitized data and the subsequent use of analysis methods that make it possible to extract from the primary data the adequate information about the features of the structural organization of the surface, about the changes in the texture of the surface under various external influences on the systems under investigation. Usually solid-phase open systems are interesting which surface undergoes complex rearrangements under the influence of external factors and characterized by spatial intermittency [1]. It is facilitated by non-linear relationships between the fragments of the systems under consideration with unavoidable dissipative processes and inertia. The corresponding character of the surface relief in different ranges of spatial frequencies is represented by a sequence of irregularities of two types: relatively moderate in magnitude jumps and spikes which more significant in magnitude and more localized in space. The intermittent nature of the texture of surfaces is inherent both to a variety of natural objects, and to the surfaces of various materials for microelectronics and engineering systems that are formed under various treatments.
The formation of supersmooth surfaces characterized by the
height magnitude ![]() on the level of nanometers and
less is one of the key challenges in substrates producing for epitaxy of
functional layers of micro- and nanoelectronics and for deposition of
light-reflecting coatings of various technical devices etc. The surface of
functional layers formed on substrates has nano- or submicron thicknesses and
reproduces features of the surface structure of the substrate, which
necessitates, especially if to speak about the development of technology,
implementation of metrological control of the basic 3D parameters of the
surface topography.
on the level of nanometers and
less is one of the key challenges in substrates producing for epitaxy of
functional layers of micro- and nanoelectronics and for deposition of
light-reflecting coatings of various technical devices etc. The surface of
functional layers formed on substrates has nano- or submicron thicknesses and
reproduces features of the surface structure of the substrate, which
necessitates, especially if to speak about the development of technology,
implementation of metrological control of the basic 3D parameters of the
surface topography.
2. Problem
As it known, the main feature of technological process of obtaining supersmooth surfaces of semiconductors and dielectrics is the multistage process of grinding and polishing with a gradual reducing of «roughness» level to a minimum. In this case a complex of nonlinear interactions of micro- and nanofragments of different abrasives with the surface being polished takes place. These interactions determine the dynamics of a surface formation as a sequence of irreversible changes of system states at each level of the spatiotemporal hierarchy (in all manifesting itself spatial-temporal scales in the analyzed process) in an intermittency mode. This means that the rather sharp relief irregularities ("nanospikes" and "nanosteps") should inevitably be appeared on overall "smooth" plain of emerging supersmooth surfaces. How the presence of such irregularities of the relief is functionally significant (critical) in each case will depend on the specifics of the created product and the density of these irregularities on the resulting surface. But in any case the methodology of the AFM images analysis of supersmooth surfaces along with standard characteristics should include the identification of such type irregularities.
In contrast to the simple linear parameters defined by GOST 2789-73 "Surface roughness. Parameters and characteristics" (Ra – root mean square profile deviation, Rz – ten point height of irregularities, Rmax – maximum profile height), such possibilities are included in the phenomenological approach to solving the complex of problems of multiple systems dynamics parametrization by flicker noise spectroscopy, including the formation of complex structures of surface in nanoscale range [2 - 5]. According to FNS, the information about surface texture is contained in correlation links of components of the signals under research in different bands of spatial frequencies: low-frequency (resonance) and high-frequency, which are presented by sequences of different type of irregularities (spike-, jump-like, derivative discontinuities) on all levels of spatial hierarchy of the investigating systems. To obtain metrologically significant information about structure of such surfaces in the nanometer scale, contained in AFM images of the surface formed in the large set of digitized relief profiles, it is necessary to tune out adequately from the inevitably present noise – low-frequency relief components, the spatial frequency of which are less than fx ~ (100 nm)-1. Below the basic principles of such operations will be described, and the methodology of introduction of the entire set of 3D parameters of the surface in the nanometer scale (section 2) will be presented, the use of which will be demonstrated on the example of one of the known substrates – sitall (section 3).
3. Main fns relations for extracting the information contained in afm scans
Modern methods of scanning probe microscopy, primarily atomic force microscopy (AFM), have the ability to present the topography of fluctuating surface reliefs in the form of 3D arrays of digitized profiles h(x; y) [6 - 8]. The initial information about surface relief is registered while moving the sensitive element (probe) along x coordinate of each of N scans (usually N = 512 or 1024) on the interval 0 ≤ x ≤ L (L is a characteristic size of digitizing image window), with pitch Δl = L/N for the entire set of scans, each of which corresponds to a fixed value of the y coordinate.
According to FSS methodology the basic information contained in the dependencies of the heights h(x) of each surface relief profile on the current x coordinate is associated with a correlational dependence between the values h(x) and subsequent values of the profile heights h(x + Δ), Δ > 0. For this reason we can interpret the local values h(x) as dynamic variables of the system under study and link the surface parameters in the analysis of each relief profile to the image of autocorrelation function:
![]() , (1)
, (1)
where Δ – parameter of spatial shift, the angle brackets mean averaging over the L – Δ interval:
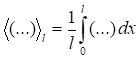 . (1а)
The procedure of averaging over the interval L means that all the characteristics that will be elicited in the analysis of dependences ψ(Δ) should be considered as mean at the specified interval. It should be kept in mind that in the general case, each profile of the surface relief is a sequence of chaotic height values h(x) in the form of irregularities-spikes and jumps on the background of changing at relatively large distances envelopes – resonant (regular) components. The core of FNS methodology is to define and derive information relevant to the discussed relationships between subsequent values of dynamic variables with previous and also contained in the aggregate of the resonant spatial frequencies and nonspecific chaotic, more high-frequency components of the signals under research.
To define the information confined in ψ(Δ) it is suitable to analyze some transformations (projections) of this function: incomplete cosine transform S(fx) of autocorrelator (power spectrum):
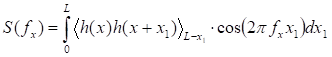 (2)
(2)
(here we assume that <h(x)> = 0; fx – spatial frequency), and the difference moment of second order F(2)(Δ) (transient structural function of Kolmogorov):
![]() . (3)
. (3)
At that, dependencies characterizing of chaotic components Fc(2)(Δ) of F(2)(Δ) function are formed exclusively by irregularities- jumps of a dynamic variable at each level of the system hierarchy, and not only the irregularities-jumps, but more rapidly changing irregularities- spikes contribute to the formation of the chaotic components of the Sc(fx) of dependencies S(fx). The informational "passport" characteristics of the analyzed surfaces, which characterize chaotic components of Fc(2)(Δ) and Sc(fx), are derived from the comparison of calculated and experimental dependencies S(fx) and F(2)(Δ) and can be implied as lengths of correlations and parameters defining the rate of attenuation (correlation links) on these correlation lengths for irregularities of various types. Taking into account the time intervals of averaging in the dependencies (2) and (3) to ensure statistical reliability of the input parameters we will constrain the magnitudes of fx and Δ from above: 0 ≤ Δ ≤ ¼L; 1/L ≤ fx ≤ ¼fd, where fd, is the spatial sampling frequency when obtaining AFM images. We also introduce the concept of "stationary structure" characterized by the same set of parameters at each spatial level of hierarchical organization (at different scales). Thus, in contrast to the geometric scale-similarity (scaling) of theory of fractals and multifractals the dynamic self-similarity is introduced across the levels of hierarchy, essentially multivariate, since each of the dependencies S(fx) and F(2)(Δ) in the general case may be characterized by the combination of two or more parameters.
Write down the interpolation expressions for chaotic components of the structure function of 2nd order Fc(2)(Δ) and the power spectrum Sc(fx), which are revealed in clear form in the absence of low-frequency components in the profile of surface relief. We will assume that there is only one characteristic scale at the sequence of jumps and spikes of relief. Then:
![]() (4)
(4)
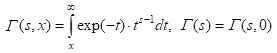 .
.
Here G(s) and G(s, x) are the gamma function and incomplete gamma function (x ³ 0 и s > 0) respectively; s – mean-square deviation of the measured dynamic variable from the average value (the dimension [h]); H1 is the Hurst constant, which characterizes the rate at which the dynamic variable loses the "memory" about its value in spatial intervals smaller than the correlation length L1. In this case, L1 can be interpreted as the characteristic distance at which the dispersion of measured surface profile heights is formed. As a reference value H1 = 0.5 can be considered. At this value H1 the nature of the loss of correlation ("memory") in fixed values of h at each subsequent displacement of the probe corresponds to memory loss in Fick diffusion process. The degree of correlation decreases slower when H1 < 0.5 and faster than Fick diffusion when H1 > 0.5.
The interpolation dependence for the total chaotic contribution to the autocorrelator spectrum Sc(fx) is represented in the form:
![]() . (5)
. (5)
Here Sс(0), L0 and n0 – the phenomenological parameters which are introduced for describing the power spectra when processing experimentally obtained spatial series. The convenience of such representation caused by the fact that in the high frequency region the contributions to the power spectrum from the chaotic component of the signal generated by spike- and jump-like irregularities may be comparable. That is why, as a measure of the chaotic component of the signal at high spatial frequencies the parameter Sc(L0-1) has been selected.
As mentioned above, the problem of parameterization of surface relief profiles in the complex chaotic structures consists in extraction from the spatial series h(x) of all possible combination of parameters related not only to the chaotic component but also to the set a specific low-frequency envelopes, resonant components varying on larger spatial scales. Further we will continue to represent the height profile h(x) corresponding to each scan in the form of a linear superposition of chaotic high-frequency component of hc(x) and slowly changing resonance component hr(x):
![]() . (6)
. (6)
In this case the autocorrelator function and power spectrum can be represented as follows:
![]() . (7)
. (7)
Whereupon it is natural to assume that the resonant components hr(x) corresponding to the specified frequency range can be considered as a set of harmonics that form a stationary profile of heights.
With that said, we determine the resonant component of autocorrelator ψr(∆) using incomplete inverse cosine-transformation from the resonance contribution Sr(fx):
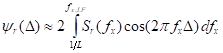 , (8)
, (8)
where the interval of integration [1/L, fx,LF] defines the scope of "resonance" frequencies. The main contribution to (8) generates in the frequency range fx,LF £ (0.1-0.2)fd and the formal increasing of the upper limit in (7) up to the value fx,max = 0.5 fd almost does not affect the dependence of ψr(∆). Find the resonant component Fr(2)( ∆) on the basis of (7) taking into account the stationary nature of hr(x) profile:
![]() . (9)
. (9)
Then the chaotic component Fc(2)(∆) of differential moment of the 2nd order for which the interpolation expression (4) is true can be represented in the form:
![]() . (10)
. (10)
On the basis of (4) - (10) it is possible to consistently solve the problem of separation of contributions of resonant and chaotic components with the full parameterization of the investigated height profiles. From the comparison of experimental (3) and calculated (7) dependencies using the method of least squares the parameters σ, L1 and H1 are determined which characterize the contribution to structural function defined by jump-like irregularities. The parameter H1, as well as the parameters σ and L1, are selected from the best matching of calculated curve F(2)(Δ) with the experimental one in the whole considered interval of Δ. Thus, an input parameter H1 is somewhat different in meaning from the Hurst parameter, usually introduced to describe the dependencies F(2)(Δ) for small Δ. It also should be emphasized that the parameter σ is a measure of jump-like irregularities of the studied profile and characterizes the root mean square deviation of profile heights from the base profile generated by the combination of resonant low-frequency components of the chaotic dependencies h(x). It should be noted that since FNS methodology considers a multi-parameter self-similarity of fixed dynamic variables (heights of relief profile in this case) at the levels of the hierarchy, then there are no constraints for all phenomenological parameters including H1 and n that occur in the fractals theory, when 0 ≤ H1 ≤ 1 and n ≤ 3.
Two main parameters:
1. The σ parameter, nm, is a measure of jump-like irregularities of the studied profile. It characterizes the root means square deviation of the profile heights from the base profile generated by the set of resonant low-frequency components of the chaotic dependencies h(x); this parameter is defined as the "stepwiseness" factor of chaotic component of the surface profile.
2. The parameter Sc(L0–1), (nm)2μm, is a measure of "high frequency" irregularities of the studied profile the most rapidly changing on the scale of 1-100 nm features of relief; this parameter will be called the texture "spikiness" factor.
Additional 3D parameters of the surface which are associated with jump-like (the parameters L1, H1) and spike-like irregularities (parameters L0 and n0) of the surface relief in the nanometer range:
3. Parameter L1 is the characteristic distance at which the dispersion of measured surface profile heights is formed.
4. The parameter H1 is the Hurst constant which characterizes the rate at which the dynamic variable loses the "memory" about its value in spatial intervals smaller than the correlation length L1.
5. The parameter L0 is the characteristic distance at which the correlation links in the sequence of spike-like irregularities are lost (the correlation length).
6. The flicker noise parameter n which characterizes the rate of loss of correlations (decreases with increasing of n0).
4. Experimental data
The possibilities of FNS approach for determining the parameters of supersmooth surfaces are demonstrated by carrying out of AFM studies of the lithium aluminosilicate sitall samples CO-115M which is intended for manufacturing the elements of precision reflective optics. It should be mentioned that each of the investigated substrates was previously subjected to mechanochemical treatment by the abrasive with 0.1 ¸ 0.4 mm grain size at the final stage. The polished surface of this glass-ceramics contains defects of various types, characterized by different spatial scales:
- the traces of mechanochemical influence in the form of the anisotropic linearly structured features which have remained after abrasive polishing;
- individual spikes (pits) under local distortions of homogeneity;
- residual chaotic relief;
- nanoparticles corresponding to crystallites of b-eucryptite LiO2×Al2O3×2SiO2 occurred on the surface of sample.
For removal (flattening) the above mentioned surface defects we used the method of gas cluster ion beam (GCIB) polishing [9 - 12]. The use of the accelerated cluster ions beams as a supplement or replacement of the conventional chemical-mechanical planarization allows avoiding its main drawback – the formation of residual relief with the magnitude of heights of order of 1 nm. The advantages of the method also include less labour inputs and good compatibility with planar technology of semiconductor devices and integrated circuits.
The treatment of the experimental samples was carried out with "nAccel 100" (Exogenesis) apparatus in which the gas clusters are formed by adiabatic expansion of the process gas (argon) in the vacuum through a supersonic nozzle with critical cross-section diameters of 50 microns. Gas clusters were ionized by electron impact and accelerated by a potential difference of 10 – 30 kV. Then the beam of accelerated cluster ions was transported into the sample chamber, where it interacts with the surface. The current density in the center of the beam at 30 kV accelerating voltage was 2 µA/cm2, the profile of the current distribution is Gaussian with FWHM of about 12 mm. The residual gas pressure during the experiments in the sample chamber did not exceed 4 × 10⁻² Pa. The weight separation of the ionized particles was not carried out. A typical scheme of GCIB equipment is shown in Fig. 1.
A distinctive feature of the applied accelerator is the possibility of processing the surface by a beam of accelerated neutral atoms (ANAB) [13]. To do this, an electrostatic capacitor is placed in front of the sample chamber, deflecting the charged particles contained in the beam.
Therefore the target is bombarded only by the beam of accelerated neutral atoms, formed by partial destruction of the cluster ions as a result of collisions with molecules of residual gases. In this case, the absence of correlation between the hits of individual atoms excludes the excitation of shock waves and the formation of "craters" on the surface. The treatment of glass ceramics with ANAB led to the best results in the experiments performed.
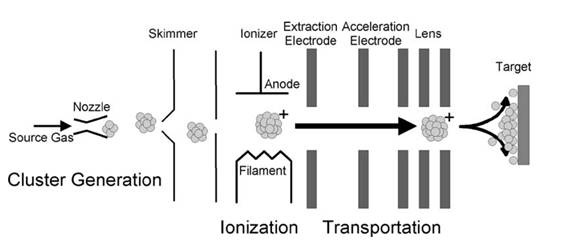
Fig.1. The typical scheme of GCIB equipment [14]
A scanning probe microscope Asylum Research MFP-3D StandAlone (USA) was used to obtain AFM images of pre- and postprocesed samples. Silicon cantilevers Asyelec01 were used to obtain the topography of the investigated objects (the length of the beam 240 μm with a stiffness factor of 2.2 N/m, the resonant frequency within 45 ÷ 95 kHz, the radius of curvature of the cantilever tip less than 30 nm). Scanning to obtain 1024 rasters that form the image was carried out in the semi-contact mode in constant amplitude (topography) in air at an ambient temperature in the range of 22 - 25°C and relative humidity of about 50-56%.
The AFM images of the surface of glass-ceramic samples (initial and after ANAB treatment) were obtained in the 10×10 µm2, 5×5 µm2 and 3×3 µm2 scales (three images in each format). Examples of the obtained AFM images (scan size 10 × 10 μm) are shown in Fig. 2a (the original sitall sample) and in Fig. 3a (the sample after ANAB processing). To determine the local 3D parameters of the surface of sitall samples from digitized AFM images the methods certified by the FSUE "Ural Scientific Research Institute of Metrology" (certificates №№ 223.0263/01.00258/2010 - 223.0267/01.00258/2010) were used. According to these methods a set of 1024 rasters of image is first divided into m = 256 subgroups with an equal quantity of rasters N = 4: from 1st to 4th, from 5th to 8th..., 1021 to 1024, and mean average profile hi(x) (i = 1, 2, 3, ... , 256) is calculated for each of these subgroups. Here index i indicates the subgroup of rasters counted from the bottom (or left) edge of the image if the rasters are formed along the x (or y) axis. Each average profile hi(x) is determined by a set of 3D parameters Pk = {σ, L0, L1, H1, n0, Sc(L0–1)}k, (k = 1, 2, ..., m) in the nanometer range. Then the set of Pk is divided into K = 8 groups of R = 32 elements in each group{Pk}, and average parameters are calculated for each such group.
A set of FNS surface parameters (3 for initial samples and 3 for the samples after ANAB processing respectively) obtained on the basis of FNS analysis of AFM images (10×10 µm2, 5×5 µm2 and 3×3 µm2 scan sizes) and average values of these parameters are presented in Tab. 1 and Tab. 2. The examples of FNS dependencies on the basis of which the FNS parameters were determined are given in Fig. 2 b - f and Fig. 3 b - f.
Table 1. FNS parameters for selected areas of the original sitall surface obtained from the analysis of AFM images.
|
Sample |
<h>, nm |
σ, nm |
Sc(L0-1), (nm)3 |
H1 |
L1, μm |
L0, μm |
n0 |
|
10×10 μm 2 |
|||||||
|
P92_13_0000 |
3.56 |
0.43 |
0.77 |
1.18 |
0.143 |
0.140 |
2.9 |
|
P92_13_0004 |
6.84 |
0.63 |
0.70 |
1.41 |
0.131 |
0.090 |
3.2 |
|
P92_13_0007 |
7.18 |
0.71 |
1.72 |
1.39 |
0.110 |
0.083 |
3.4 |
|
average |
5.86 |
0.59 |
1.06 |
1.33 |
0.128 |
0.104 |
3.2 |
|
rms deviation |
2.00 |
0.15 |
0.57 |
0.12 |
0.017 |
0.031 |
0.22 |
|
5×5 μm 2 |
|||||||
|
P92_13_0002 |
2.58 |
0.36 |
0.45 |
1.11 |
0.103 |
0.091 |
2.83 |
|
P92_13_0005 |
3.82 |
0.45 |
0.28 |
1.25 |
0.067 |
0.056 |
3.08 |
|
P92_13_0008 |
3.46 |
0.40 |
0.29 |
1.27 |
0.070 |
0.065 |
3.02 |
|
average |
3.29 |
0.40 |
0.34 |
1.21 |
0.080 |
0.071 |
2.97 |
|
rms deviation |
0.64 |
0.04 |
0.09 |
0.09 |
0.020 |
0.019 |
0.13 |
|
3×3 μm 2 |
|||||||
|
P92_13_0003 |
1.85 |
0.31 |
0.29 |
0.95 |
0.077 |
0.070 |
2.71 |
|
P92_13_0006 |
2.95 |
0.39 |
0.24 |
1.22 |
0.054 |
0.049 |
2.93 |
|
P92_13_0009 |
2.17 |
0.32 |
0.21 |
0.99 |
0.060 |
0.050 |
2.82 |
|
P92_13_0010 |
2.08 |
0.31 |
0.23 |
0.93 |
0.059 |
0.051 |
2.74 |
|
average |
2.26 |
0.33 |
0.24 |
1.02 |
0.061 |
0.055 |
2.80 |
|
rms deviation |
0.48 |
0.04 |
0.04 |
0.14 |
0.010 |
0.010 |
0.10 |
Table 2. FNS parameters for selected areas of surface after ANAB treatment obtained from the analysis of AFM images.
|
Sample |
<h>, nm |
σ, nm |
Sc(L0-1), (nm)3 |
H1 |
L1, μm |
L0, μm |
n0 |
|
10×10 μm 2 |
|||||||
|
P92_13_0000m |
1.52 |
0.30 |
0.69 |
0.90 |
0.217 |
0.190 |
2.72 |
|
P92_13_0003m |
1.77 |
0.33 |
0.98 |
0.92 |
0.207 |
0.188 |
2.67 |
|
P92_13_0006m |
1.68 |
0.30 |
0.73 |
0.96 |
0.174 |
0.155 |
2.74 |
|
average |
1.65 |
0.31 |
0.80 |
0.93 |
0.199 |
0.178 |
2.71 |
|
rms deviation |
0.13 |
0.02 |
0.16 |
0.03 |
0.023 |
0.020 |
0.02 |
|
5×5 μm 2 |
|||||||
|
P92_13_0001m |
1.52 |
0.28 |
0.50 |
0.794 |
0.164 |
0.128 |
2.58 |
|
P92_13_0004m |
2.56 |
0.28 |
0.37 |
0.958 |
0.105 |
0.101 |
2.74 |
|
P92_13_0007m |
1.47 |
0.26 |
0.41 |
0.837 |
0.127 |
0.110 |
2.59 |
|
average |
1.85 |
0.27 |
0.43 |
0.863 |
0.132 |
0.113 |
2.64 |
|
rms deviation |
0.62 |
0.01 |
0.07 |
0.085 |
0.030 |
0.014 |
0.08 |
|
3×3 μm 2 |
|||||||
|
P92_13_0002m |
1.43 |
0.27 |
0.44 |
0.81 |
0.125 |
0.104 |
2.54 |
|
P92_13_0005m |
1.41 |
0.25 |
0.29 |
0.89 |
0.090 |
0.086 |
2.61 |
|
P92_13_0008m |
1.35 |
0.24 |
0.21 |
0.86 |
0.092 |
0.076 |
2.62 |
|
average |
1.40 |
0.25 |
0.31 |
0.85 |
0.102 |
0.089 |
2.59 |
|
rms deviation |
0.04 |
0.02 |
0.12 |
0.04 |
0.019 |
0.014 |
0.04 |
|
a |
b |
|
c |
d |
|
e |
f |
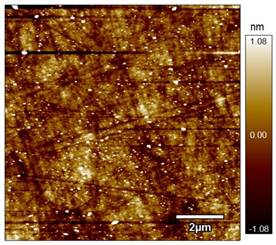
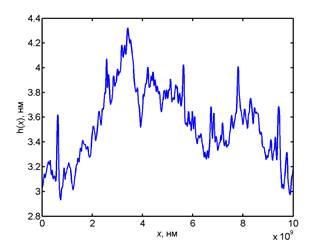
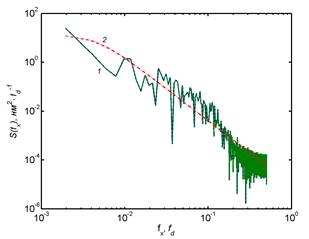
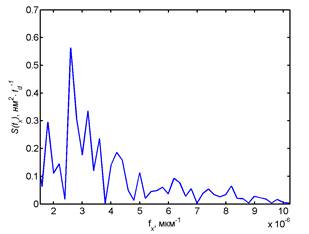
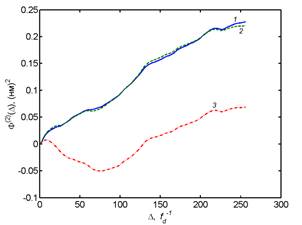
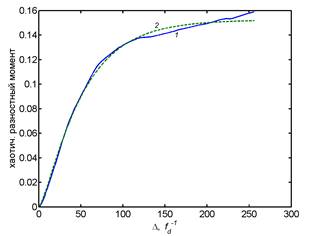
Fig. 2. AFM image and 3D parameters of the surface fragment MEPhI_P92_13_00:
a) AFM image (10×10 µm2);
b) the average dependence of the heights h3(x) of relief profile;
c) the modulus of the spectrum S(f), general and
its chaotic component respectively, calculated for the heights h3(x)
of relief profile: 1 – experimental dependence; 2 –interpolation dependence (5)
for the chaotic component, plotted for the parameter values: Sс(L0-1)
= 0.109 ![]() (nm)2∙
(nm)2∙![]() 1.06 (nm)3, L0
= 35.6
1.06 (nm)3, L0
= 35.6 ![]()
![]() 0.35 μm, n0 =
2.6;
0.35 μm, n0 =
2.6;
d) the modulus of the regular part of the spectrum S(f) in the field of low spatial frequencies for the heights h3(x) of a relief profile;
e and f) structure functions for the heights h3(x)
of the relief profile F(2)(Δ),
full and chaotic component respectively calculated by the interpolation
equation (4): 1 – experimental dependence; 2 – dependence estimated with σ
= 0.28 nm; H1 = 0.71; L1 = 48.3 ![]()
![]() 0.47 μm; 3 – contribution of specific
frequencies.
0.47 μm; 3 – contribution of specific
frequencies.
|
a |
b |
|
|
|
|
c |
d |
|
e |
f |
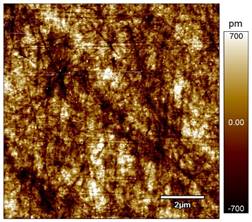
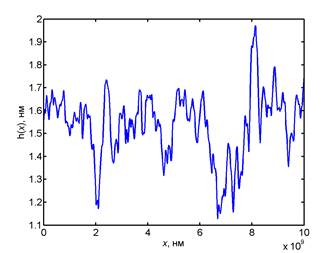
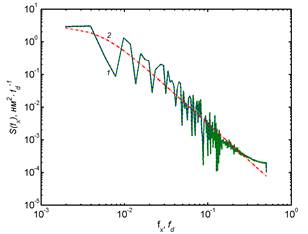
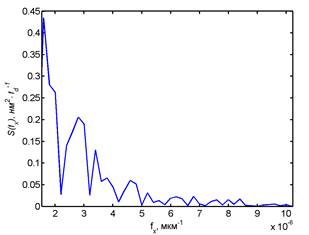
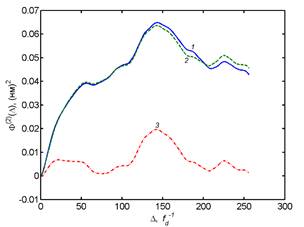
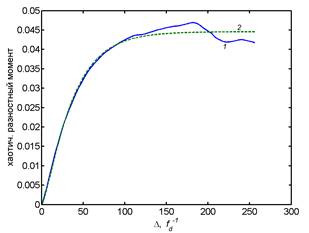
Fig. 3. AFM image and 3D parameters of the surface fragment of MEPhI_P92_13_13_8min_15keV sample:
a) AFM image (10×10 µm2);
b) the average dependence of the heights h5(x) of relief profile
c – f) all the symbols are the same as in Fig. 1. The
dependencies are plotted with the following parameter sets: Sс(L0-1)
![]() 0.42 nm3, L0
0.42 nm3, L0
![]() 0.31 μm, n0
= 2.3; σ = 0.15 nm; H1 = 0.74; L1
0.31 μm, n0
= 2.3; σ = 0.15 nm; H1 = 0.74; L1
![]() 0.32 μm
0.32 μm
As it follows from the comparison of the FNS parameters presented in the Tables 1 and 2, the treatment under the selected mode leads to the significantly changes of the surface topography of the experimental samples expressed in the smoothing of the irregularities of the relief. Indeed, the average differences <h> of the fixed relief depths in the image windows of 3×3 µm2 and 10×10 µm2 are 2.26 and 5.86 nm for the initial sample and 1.40 and 1.65 nm after the treatment. The two main FNS parameters of σ and Sc(L0–1) also changed markedly. The values of this parameters were 0.59 nm and 1.06 (nm)3 for the initial sample and decreased after the ion cluster treatment down to 0.31 nm and 0.80 (nm)3, respectively. They were measured in 10×10 µm2 scale. It is also important to specify the values of the root-mean-square deviations of the FNS parameters. These deviations characterize, in fact, the degree of "heterogeneity" or the measure of violation of the "planarity" of the relief. For the parameters σ and Sc(L0-1) in the 10 × 10 μm2 window the relative RMS deviation values δ in relation to the mean values were 25% and 54% for the initial samples, whereas after the treatment the values of δ were 6% and 20%, respectively. Thus, the treatment of the surface of the sitall by cluster ions of argon leads to "planarization" of the initial surface.
5. Conclusion
The main goal of this research was to solve the purely methodological task of presenting the possibilities of the method of ion-cluster processing as the final stage of super-smooth surfaces preparation of substrate materials, which are usually used for the formation of functional elements for optoelectronic and optic devices on their basis. And also in the presenting of the FNS method to ensure appropriate control of the "planarization" of the surface. As the experience of the authors [15] shows, in order to ensure standardization of the surface of real products with a characteristic area of ~ 1 cm2 by the control of 3D relief parameters the analysis of about 10 AFM images for a particular window (usually with a side from 2 to 15 μm) requires because of the unavoidable heterogeneity of the formed reliefs of surfaces before their finish processing. Data presented in Table 2, in fact, demonstrate this circumstance. In the cases considered, this was revealed in the analysis of the AFM image of the P92_13_0002m sitall sample after ion-cluster treatment in a 3 × 3 μm2 window. Here it should be borne in mind that the spots of the surface of the initial sample and the same sample passed through the ion-cluster processing fixed by the AFM method are geometrically spaced. And as follows from the value of the "spikiness" factor Sc(L0-1) for sample P92_13_0002m this fragment was markedly different from most other fragments of the original surface, and the smoothing procedure for the chosen duration was insufficient for it. Noted difference was manifested in the fact that the relative value of the root-mean-square deviation for this parameter exceeded the corresponding value (17%) for the initial sample and amounted to 39% after treatment. Obviously, fixing of such deviations is more likely when the number of fragments analyzed is more than 3, as was the case in this paper.
This study was supported by the Ministry of Education and Science of the Russian Federation, identification number RFMEFI57814X0064. This work was carried out using the equipment of MISIS Shared-Use Equipment Center "Materials Science and Metallurgy" and MEPhI Shared-Use Equipment Center "Heterostructural microwave electronics and wide band gap semiconductor physics". Samples of glass ceramics for research were donated by JSC Polyus Research Institute.
References
1. Timashev S.F. Flicker-noise spectroscopy: information in chaotic signals. Fizmatlit, 2007. 248 p.
2. Mirsaidov U., Timashev S.F., Polyakov Yu.S., Misurkin P.I., Polyakov S.V., Musaev I. Analytical method for parameterizing the random profile components of nanosurfaces imaged by atomic force microscopy Analyst. 2011. Vol. 136. N 3. P. 570-576; (http://dx.doi.org/10.1039/C0AN00498G).
3. Timashev S.F., Polyakov Yu.S., Lakeev S.G., Misurkin P.I., and Danilov A.I. Fundamentals of Fluctuation Metrology. Russian Journal of Physical Chemistry A, 2010, Vol. 84, No. 10, pp. 1807–1825 (http://dx.doi.org/10.1134/S0036024410100183).
4. Kuznetsov, Y.I., Vershok, D.B., Timashev, S.F., Solov'eva, A.B., Misurkin, P.I., Timofeeva, V.A., Lakeev, S.G. Features of formation of magnetite coatings on low-carbon steel in hot nitrate solutions Russian Journal of Electrochemistry, 2010, Vol. 46, No. 10, pp. 1155–1166 (http://dx.doi.org/10.1134/S1023193510100113).
5. Timashev S. F., Polyakov Yu. S. Review of flicker noise spectroscopy in electrochemistry. Fluctuation and Noise Letters. 2007. Vol. 7. N 2. P. R15 - R47; (http://dx.doi.org/10.1142/S0219477507003829, http://arxiv.org/abs/0812.0030).
6. Binning G., Quate C. F., Gerber Ch. Atomic force microscope. Phys. Rev. Lett., 1986. Vol. 56. P. 930 – 933.
7. Magonov S.N., Whangbo M.-H. Surface analysis with STM and AFM: experimental and theoretical aspects of image analysis. VHC, 1996. 318 p.
8. Bykov V.A. Instruments and methods of scanning probe microscopy for the study and modification of surfaces: diss. ... Doct. Tech. Sciences. - M., 2000. - 393 p.
9. Insepov Z. Cluster Ion-Solid Interactions: Theory, Simulation, and Experiment. CRC Press, Taylor&Francis Group, Boca Raton, FL, USA, 2016. – 272 p. – ISBN-10: 1439875421
10. Yamada I., Historical milestones and future prospects of cluster ion beam technology, Applied Surface Science, Volume 310, 15 August 2014, Pages 77-88, ISSN 0169-4332, http://dx.doi.org/10.1016/j.apsusc.2014.03.147. (http://www.sciencedirect.com/science/article/pii/ S0169433214006989).
11. Popok V.N., Energetic cluster ion beams: Modification of surfaces and shallow layers, Materials Science and Engineering: R: Reports, Volume 72, Issues 7–8, 22 August 2011, Pages 137-157, ISSN 0927-796X, http://dx.doi.org/10.1016/j.mser.2011.03.001. (http://www.sciencedirect.com/science /article/pii/ S0927796X11000131).
12. Yamada I., Matsuo J., Insepov Z., Aoki T., Seki T., Toyoda N., Nano-processing with gas cluster ion beams, Nuclear Instruments and Methods in Physics Research Section B: Beam Interactions with Materials and Atoms, Volumes 164 – 165, April 2000, Pages 944-959, ISSN 0168-583X, http://dx.doi.org/10.1016/S0168-583X(99)01163-5. (http://www.sciencedirect.com/science/article/pii/S0168583X99011635).
13. Kirkpatrick A., Kirkpatrick S., Walsh M., Chau S., Mack M., Harrison S., Svrluga R., Khoury J., Investigation of accelerated neutral atom beams created from gas cluster ion beams, Nuclear Instruments and Methods in Physics Research Section B: Beam Interactions with Materials and Atoms, Volume 307, 15 July 2013, Pages 281-289, ISSN 0168-583X, http://dx.doi.org/10.1016/j.nimb.2012.11.084. (http://www.sciencedirect.com/science/article/pii/S0168583X13001304).
14. Seki T., Matsuo J., Takaoka G.H., Yamada I., Generation of the large current cluster ion beam, Nuclear Instruments and Methods in Physics Research Section B: Beam Interactions with Materials and Atoms, Volume 206, May 2003, Pages 902-906, ISSN 0168-583X, http://dx.doi.org/10.1016/S0168-583X(03)00896-6. (http://www.sciencedirect.com/science/article/pii/S0168583X03008966).
15. Timashev S.F., Lakeev S.G., Misurkin P.I., Polyakov Yu.S., Timashev P.S., Tomashpolsky Yu.Ya., Sadovskaya N.V., Terentyev G.I., Medvedevkovsky S.V., Solovieva A.B., Kargin N.I., Vorontsov P.S., Ryndya S.M., Timofeeva V.A. Parametrization of the structure of chaotic surfaces in the nanometer range from atomic force microscopy data. Zavodskaya Laboratoriya. Diagnostika materialov. 2013. V.79. №3. P. 26 - 38. (http://zldm.ru/upload/iblock/50a/1028686120137903026.pdf).