WAYS TO VISUALIZE THE QUALITY OF KNOWLEDGE BASE FOR ENTERPRISE AUTOMATION BY THE EXAMPLE OF SITUATIONAL INSTRUMENTAL EXPERT SYSTEM
A. Dzengelewski
National Research Nuclear University MEPhI (Moscow Engineering Physics Institute), Russian Federation
Contents
1.1. Existing tools of visualization of knowledge bases
1.2. Objectives of knowledge base visualization
1.3. Domain of business automation tools
2. SIES as a tool for development of knowledge bases
2.1. The structure of SIES knowledge base
2.2. Visualization of SIES knowledge base
2.3. Image of nested situations
2.4. Features of the knowledge base of business automation
Abstract
In this article possible indicators of quality of knowledge bases are examined. Among the indicators, usually used for databases, it is proposed to use additional indicators such as "connectivity". The automation of enterprises is considered in the capacity of a domain knowledge base. It is shown that for creation of a modern and efficient corporate information system (CIS), it is necessary to identify goals and automation areas properly and then to choose the required modules or automation system.
Ways of visualization of quality indicators (completeness, consistency, currentness and connectivity) of the knowledge base of situational instrumental expert system (SIES) are proposed. Indicators of quality of knowledge base are considered in general as well as for sections of the knowledge base SIES (situations). The described ways of visualization of quality of the knowledge base are based on nested circles that graphically reflect the quality of the knowledge base. In the paper graphic examples are given, colors are used for completeness and consistency, and relative sizes of nested circles are used to evaluate connectivity. An algorithm of geometric construction of nested circles centers is proposed.
The Zachman Framework was used for description of automation tools. In this case, the knowledge base SIES is expanded by models of goals, organizational structure, data, functions, networks and processes. The indicator of "completeness" of this knowledge base is expanded by evaluating the presence of models at different levels (contextual, conceptual, logical) stored in the knowledge base. Examples of visual representation of the knowledge base of SIES in the field of automation of enterprises using the indicators (completeness, consistency, currentness and connectivity) are shown.
Keywords: visualization, knowledge base (KB), expert system (ES), situational instrumental expert system (SIES), completeness, consistency, currentness, connectivity, corporate information system (CIS), Zachman Framework.
1. Introduction
In recent years, capabilities of business automation are booming. Their development is difficult to track without knowledge of formalization mechanisms. The solution is to use an expert system focused on the most simple and affordable way to access knowledge.
One of the ways to improve the convenience of working with complex information is to use computer graphics and visualization capabilities.
1.1. Existing tools of visualization of knowledge bases
There are many papers about visualization of knowledge. For example, article [1] describes an algorithm for converting a multi-dimensional space to two-dimensional knowledge base in order to produce a visual image. Article [2] represents an imaging system as a separate module that can be connected to an expert system. Article [3] gives an example of visualization tools used by IBM Watson artificial intelligence system. Paper [4] states the importance of visibility principle in semantic networks and it describes tools that can be used to visualize semantic networks. Some of these tools can be used for all complex geometrical objects.
Variety of modern tools and visualization capabilities can display geometric objects now. An overview of such systems is given in [5].
In this paper possible ways to visualize the quality of knowledge are considered using the example of the Situational Instrumental Expert System (SIES) that has a knowledge base, which contains recommendations on how to choose business automation tools.
1.2. Objectives of knowledge base visualization
The following purposes for graphical visualization of knowledge base can be defined:
¾ ability to visualize existing structure of knowledge domain;
¾ ability to find quickly the first chapter in the knowledge base during user consulting or expert knowledge acquisition;
¾ ability to visually evaluate quality of the knowledge base.
The evaluation of quality of the knowledge base seems to be the most useful purpose.
Currently there are a number of systems to support data quality that contain tools to visualization data quality. Among them, for example, Informatica Data Quality, SAP Information Steward, IBM Quality Stage. These systems are listed as leaders in the review of Gartner Magic Quadrant for Data Quality Tools [1]. The key data quality indicators are presented in [6] and their short variant is shown in Table 1.
Table 1. Data quality dimensions
|
Name |
Value |
||
|
1 |
accuracy |
fields contain only correct information |
|
|
2 |
completeness |
all appropriate rows in data sets are present |
|
|
3 |
consistency |
data values in one data set are consistent with values in other data set |
|
|
4 |
currentness |
information is current with the world that it reflects |
|
|
5 |
precision |
data are stored with a desired degree of accuracy |
|
|
6 |
reasonableness |
data relevant within the operational context |
|
|
7 |
referential integrity |
permissible use of references to other data |
|
|
8 |
timeliness |
time expectation for accessibility and availability of information |
|
|
9 |
uniqueness |
no entities exist more than once within the data set |
|
|
10 |
validity |
data format is consistent with the domain of values |
Visual assessment of the knowledge quality is the next stage in the development of this field. It is clear that knowledge can be assessed using at least the set of indicators for data. There are additional qualities which are relevant only for knowledge. For instance, connectivity, reliability, length of inference chain, etc.
It should be noted that the actual quality of knowledge can be evaluated either directly by experts or automatically. Next, the automatic (formal) methods of evaluation of knowledge will be discussed. The following indicators will be considered:
¾ Completeness;
¾ Consistency;
¾ Connectivity;
¾ Timeliness.
In particular, the possibility of assessing the quality of knowledge will be presented using situational instrumental expert system that contains knowledge base of business automation tools.
1.3. Domain of business automation tools
Nowadays constantly developing software market offers a large number of enterprises automation systems (applications). Proposed applications have differences in functionality, cost characteristics, timing and implementation methods [7], [8]. Emergence of such areas as "Mobile applications", "Internet of Things", "Big data", "Social networking" and other leads to creation of new applications and to development of existing automation systems.
At the same time, many producers follow the transition of enterprises from the use of monolithic applications to integration of individual services in accordance with the approach of SOA (Service Oriented Architecture) [9]. Services represent separate software modules with well-defined interfaces, weakly connected with each other. There is a special class of "middleware" platforms (middlware) that allows managing data services. As a result, the ideal corporate information system (CIS) is a set of properly selected systems or modules each of which solves a problem in the most effective way.
As it has been shown in [10], the most important tasks on the step of tools selection:
1. Formalization of goals of the automation project;
2. Determination of the automation area;
3. Formation of requirements to the site of the automation;
4. Selection of the right system or module for the automation area.
The greatest effect will be achieved when all of these tasks are complexly solved.
2. SIES as a tool for development of knowledge bases
2.1. The structure of SIES knowledge base
Currently, there is a number of expert systems that could support the knowledge base described in the article. The most comprehensive overview is presented in [11]. It is proposed to use Situational Instrumental Expert System (SIES) as a solution to the problem of choice of application [12, 13, 14, 15].
SIES uses semiotic relational-network model of knowledge
representation. Nodes of uniform semantic network are situations (S).
Situations have connections with other situations. Their connections determine
the execution order of situation acts. Each situation has a set of rules.
In the antecedent part of situation, there are the possible combinations of
characteristic values of the situation. In the consequent part of situation,
there are chains of actions (A) and (or) references to other
situations. The knowledge base conditions are classifying by suggested
actions during the interactive input of knowledge. The terminology of
questions (![]() ) and
responses (
) and
responses (![]() ) is
used for the organization of the dialogue system. This option is the most
user-friendly for users and experts, which are untrained in the field of
knowledge engineering.
) is
used for the organization of the dialogue system. This option is the most
user-friendly for users and experts, which are untrained in the field of
knowledge engineering.
Considering the work with the situation in the context of communication of expert, system and user, we are coming to the following model:
S = < {Q}, {R}, {A} >, (1)
Here we use notation of the following sets:
{Q} – Questions from system to user;
{R} – Responses from user to system;
{A} – Actions which are performed after the situation has been handled.
Action (A) is defined as an element of the Boolean (set of all subsets) of a set of procedures:
![]() (
2 )
(
2 )
Here Qp is the number of procedures. In this case, the action may consist of a single procedure, or several procedures, or empty set of possible procedures.
In turn, the procedure (P) represents the following type of data:
![]() (
3 )
(
3 )
Here ![]() is Operation:
is Operation:
![]() (
4 )
(
4 )
Here C is Consultation, ![]() is
reference to other Situation.
is
reference to other Situation.
In [14] this approach is described in more details.
The described model of the knowledge base demonstrates that the quality of a single situation can be evaluated as well as the quality of the knowledge base as a whole.
1) For a single situation:
¾ Completeness: total number of rules; the proportion of the number of rules with nonempty procedures (which contains at least one recommendation);
¾ Consistency: the ratio of situation rules with multiple procedures (in these cases one condition corresponds with few recommended actions);
¾ Connectivity: the number of references to the situation and from the situation;
¾ Timeliness: the period that has passed since the date of situation knowledge verification.
2) For the knowledge base as a whole:
¾ Completeness: quantity of situations; number of ties between situations, number of all quantity rules; the proportion of completed situations;
¾ Consistency: the ratio of all knowledge base rules with multiple procedures;
¾ Connectivity: the number of connections between the situations;
¾ Timeliness: the average time passed since the last actualization of a situation.
It should be noted, if the situation consists of relevant questions and have full version of their responses, the formal correctness of the knowledge will be close to the actual.
Let us view an example of visualization of the listed characteristics of knowledge base.
2.2. Visualization of SIES knowledge base
According to the described model, knowledge base is a directed graph, where vertices are situations and ribs are operations which are references to other situations.
Let us consider possible visualization objects of SIES. Among them are:
¾ whole set of situations;
¾ set of situations and ties between them, united by a common section or the head situation;
¾ separate situation, including the following: questions, answers, consultations.
In general, a set of SIES situations can be represented as a simple hierarchy, which can help you to go quickly to the right situation (Fig. 1).
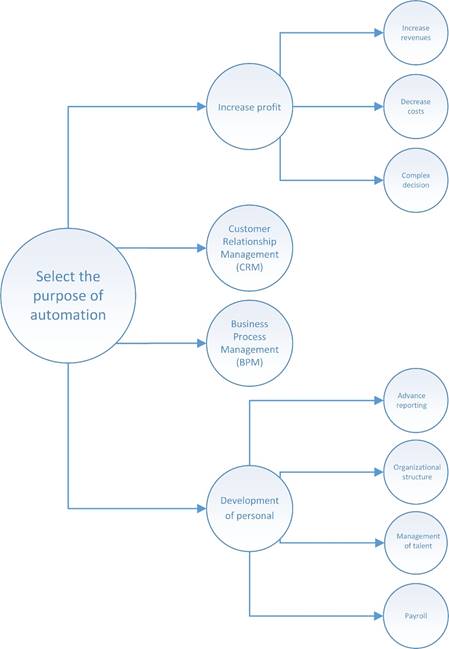
Fig. 1. Example of a set of situations in the form of a graph
An alternative way of presenting a tree of situations is use of nested circles, each of which corresponds to a single situation. If one situation refers to a few others then referenced situations can be depicted as circles included in their parent situation (Fig. 2).
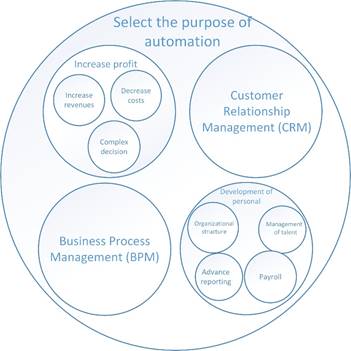
Fig. 2. Example of a set of situations in the form of nested circles
This way will be used next because it is more intuitive and compact for the complex structure of the knowledge base.
In case if we represent situations in the form of circles, their size, wall thickness and color will reflect the following characteristics of situations.
1. Formal completeness and consistency, according to the colors of the spectrum (Fig. 3):
¾ Blue: complete and consistent;
¾ Green: full, but contradictory;
¾ Yellow: incomplete but consistent;
¾ Pink: incomplete and contradictory.
2. Actual completeness (number of rules / questions / recommendations) and connectivity (number of references to other situations) using the following graphical elements:
¾ Size of a circle in comparison with neighboring circles;
¾ Wall thickness.
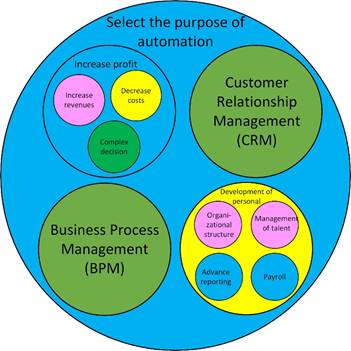
Fig. 3. Example of a graphic image using the color notation
Different indicators may be important in a particular case. It is proposed to give a user or an expert an opportunity to choose most important characteristics for a graphical display. Furthermore, only size of the circle will be used as a quantitative indicator in order to save the space of the image (Fig. 4).
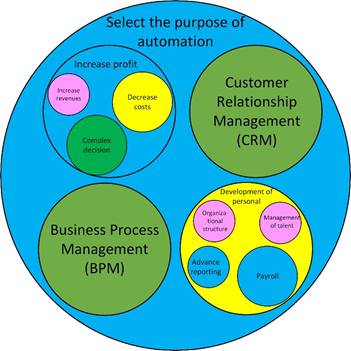
Fig. 4. Example of a graphic image of a set of situations using color and size
2.3. Image of nested situations
In order to place correctly circles, corresponding to internal situations, inside the circle, corresponding to the external situation, it is necessary to solve a geometrical problem. The task is interesting only where the number of sub-situations more than one.
To solve this problem, the circle should be divided into sectors, the number of which equals to the number of sub-situations. A circle’s size is proportional to the number of nested situations on the next level. Fig. 5 (Increase a profit) illustrates 3 nested situations, and the number of sub-situations on the next level equals to 2 for «Increase revenues», 4 for «Decrease costs» and 4 for «Complex decision».
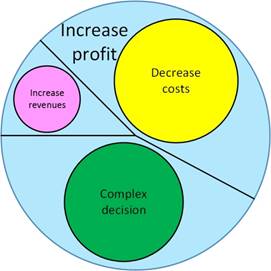
Fig. 5. Placement of inscribed circles in the sectors of the outer circle
The area of each of the sectors should be proportional to the number of reference situations on the second level of nesting. Then a circle should be inscribed into each of the selected sectors.
To determine the radius of the enclosed circle Ri, and the location of the center of the circle i, we will use the formula for calculating the radius of a circle, inscribed in the sector. The calculation of this formula is shown, for example, in [17], Section 6.5.2.
As a result, the size of the radius can be received by the formula (5).
![]() = R
* sin (
= R
* sin (![]() /2) /
/2) /![]() (sin (
(sin (![]() /2)
+1) (5)
/2)
+1) (5)
Here
i – identifier of the embedded situation;
![]() –
radius of the circle, inscribed in the sector;
–
radius of the circle, inscribed in the sector;
R – radius of the outer circle;
![]() –
angle, corresponding to the sector of the inscribed circle.
–
angle, corresponding to the sector of the inscribed circle.
Accordingly, the size of the sector angle, that is used to picture a nested situation, can be calculated by the formula (6).
![]() =
= ![]() * 360
/
* 360
/![]() (6)
(6)
Here
![]() –
central angle of the sector i.
–
central angle of the sector i.
![]() – situation
that should be displayed in the nested circle;
– situation
that should be displayed in the nested circle;
![]() –
situation, referenced by situation
–
situation, referenced by situation ![]() (graphically
embedded in situation
(graphically
embedded in situation ![]() );
);
![]() –
number of cases
–
number of cases ![]() ,
embedded in situation
,
embedded in situation ![]() ;
;
![]() –
number of cases, embedded in situation
–
number of cases, embedded in situation ![]() .
.
The length of the sector, corresponding to ![]() . The
desired center of the circle, inscribed into the sector that corresponds to
nested situation
. The
desired center of the circle, inscribed into the sector that corresponds to
nested situation ![]() is
located on the radius of the outer circle. This radius passes through the
center of the sector. Center of the circle, inscribed in the sector, is at a
distance equal to radius
is
located on the radius of the outer circle. This radius passes through the
center of the sector. Center of the circle, inscribed in the sector, is at a
distance equal to radius ![]() from
the point of intersection of the outer circle and the embedded circle (Fig. 6).
from
the point of intersection of the outer circle and the embedded circle (Fig. 6).
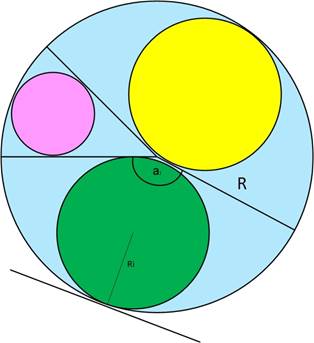
Fig. 6. Placement of a circle inscribed in the sector
2.4. Features of the knowledge base of business automation
A paradigm «Enterprise Architecture» was considered to describe the knowledge about automation of enterprises. This paradigm has different approaches to the description of business automation systems, e.g. Zachman Framework model [17], TOGAF methodology [18], ARIS methodology [19].
All these approaches are united by the need to describe the following main domains:
¾ Motivation (Why?) – Goals and measures;
¾ People (Who?) - Organizational structure of users;
¾ Data (What?) – Enterprise data;
¾ Function (How?) – Function of enterprise systems;
¾ Network (Where?) - Nets, technology architecture;
¾ Time (When?) – Sequences of business functions and business processes.
Examples of knowledge base sections in relation to specific sections of automation are presented in [10]. Thus, the model of the Situation of CIS knowledge base should be supplemented with a variety of domain models:
SCIS = < {Q}, {R}, {A}, {M}> (7)
Here
{M} = < {Mmotivation }, {Mpeople }, {Mdata }, {Mfunctions },{Mnetwork }, {Mtime }> (8)
Consequently, another important assessment of knowledge is obtained, i.e. presence and number of models of the business domain.
Each set of models can be based on Zachman Framework levels [17]. It is possible to use the following 3 Zachman Framework matrix levels to constructe the knowledge base:
1. Context;
2. Conceptual;
3. Logical.
In accordance with Zachman Framework rules [17], the levels of description should be filled consecutively. Therefore, we obtain descriptions of either the 1st, or the 1st and the 2nd, or from the 1st to the 3rd layers. In this case, the completeness of domain knowledge can be represented as a circle divided into six sectors with different degrees of filling (Fig. 7). This figure shows the situation with the completed context level for the domains "People" and "Functions", a conceptual level for the domain "Time", the logic level for domains "Motivation", "Data" and "Network."
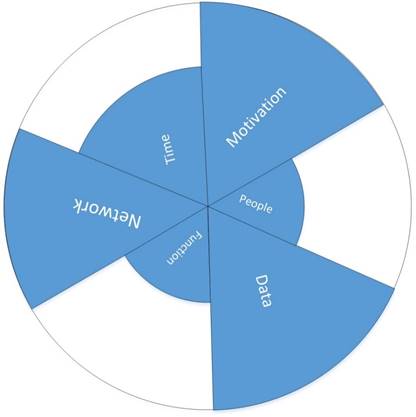
Fig. 7. Example of graphical representation of completeness of sets of models of the automation area
Fig. 8 describes notation for the previously discussed set of situations. It should be noticed that the asses of the presence of models is meaningful only for the lower level situations that correspond to the specific domains of automation.
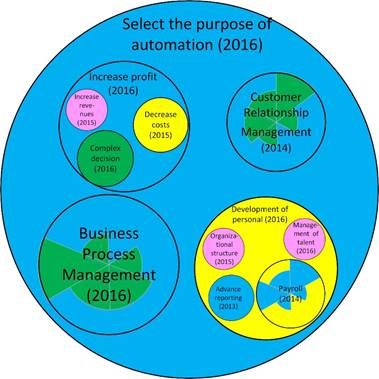
Fig. 8. Example of how to use colors, size and shape to represent a set of situations
The last year when the situations were updated was used to reflect the degree of currentness of the knowledge base, used in Figure 8. The year fro the external situation is the last year for the internal situation.
3. Conclusion
Nowadays more than 100 sets of requirements are formed for the enterprise areas (e.g. "Accounting for fixed assets") and for business areas (e.g. "Bank Management").
Apart from making a choice of the system the knowledge base can be used on the following stages of the CIS creation:
1. Enterprise survey planning;
2. Implementation of the system planning;
3. Determination of missing features and functions that require improvements in the selected enterprise automation system;
4. Adjustment of the selected automation system to the implementation of the layout;
5. Determination of how to use the system.
Formation of the knowledge base is carried out during the course "Corporate information systems" [20] where student have to do homework, and the course is designed to promote using of expert systems in colleagues and universities [10], [21], [22].
A student of the Department of System Analysis of MEPhI, Bulat Galiev, (bullbuster@ya.ru ) designed the layout module of knowledge base visualization, which is available on the site gnev41.github.io.
References
1. Shhurevich E.V. Vizualizacija i analiz baz znanij intellektual'nyh sistem [Visualization and analysis of the knowledge base of intelligent systems]. Programmnye produkty i sistemy, no. 2, 2009. [In Russian]
2. Dejnega L.Ju., Dejnega R.V., Dubrovin V.I. Vizualizacija znanij v jekspertnyh sistemah [Visualization of knowledge in expert systems]. Intellektual'nye sistemy, vol. 2, no. 6, pp. 89-93, 2003. [In Russian]
3. Paramonov O. Iskusstvennyj intellekt IBM Watson budet borot'sja s kiberprestupnost'ju [artificial intelligence IBM Watson will fight cybercrime]. URL: https://xakep.ru/2016/05/13/watson/#.VzXXWIY_Uw8.linkedin. [Data obrashhenija: 16 05 2016]. [In Russian]
4. Unificirovannyj sposob vizualizacii semanticheskih setej [The unified method of visualization of semantic networks]. [V Internete]. URL: http://www.ostis.net/wiki/Vvedenie v proekt 11 . [Accessed: 09 06 2015]. [In Russian]
5. Strikhanov M.N., Degtyarenko N.N., Pilyugin V.V., Malikova E.E., Matveeva M.N., Adzhiev V.D., Pasko A.A. Opyt komp'juternoj vizualizacii nanostruktur v NIJaU MIFI [Computer visualization of nanostructures experience at nrnu "mepHi"]. Scientific Visualization, t. 1, № 1, pp. 1-18, 2009. [In Russian]
6. Saul Judah, Ted Friedman. Magic Quadrant for Data Quality Tools 2014. Gartner Group, 2014.
7. Mark Mosley, Michael Brackett, Susan Earley, Deborah Henderson. The DAMA Guide to the Data Management Body of Knowledge, NJ USA: DAMA International, 2010.
8. Aglickij I.S., Aglickij D.S. Rossijskij rynok informacionnyh tehnologij: problemy i reshenija [The Russian market of information technologies: problems and solutions]. Lamindo, 2000. [In Russian]
9. Gareev A.F., Dzengelevskij A.E., Melenevskij B.L., Evstratov M.K., Evsjukov A.A., Maslov D.S. Principy postroenija sovremennyh KIS [Principles of modern CIS]. Moskva, 1998. [In Russian]
10. Majerson D.M. Rabota s Web-servisami v korporativnyh SOA [Working with Web-services in enterprise-wide SOA]. http://cmcons.com/articles/soa_i_web-servisy, 2008.
11. Dzengelevskij A.E., Rumjancev V.P., Nizametdinov Sh.U. Ispol'zovanie bazy znanij v uchebnom kurse [Using the knowledge base in a training course]. Informatizacija obrazovanija i nauki, pp. 95-115, 3 2012. [In Russian]
12. Rybina G.V. Osnovy postroenija intellektual'nyh sistem [Fundamentals of Intelligent Systems]. Finansy i statistika, 2010. [In Russian]
13. Dzengelevskij A.E. Jekspertnaja sistema dlja vybora statisticheskih procedur [Expert system for selecting statistical procedures]. vol. 3, Second All-Union Conference "AI-90", reports, 1990, pp. 58-60. [In Russian]
14. Dzengelewski A., Rumjantzev V., Zarovny A. The Situation Expert System, t. Annual Report'92 of Moscow Engineering Physics Institute, Moscow: , MEPhI,, 1992, str. 185-191.
15. Dzengelevskij A.E. Matematicheskoe i programmnoe obespechenie situacionnoj jekspertnoj sistemyMathematical and software situational expert system. the title of Ph.D. Dissertation, MEPhI, 1993. [In Russian]
16. Dzengelevskij A.E. Ispol'zovanie situacionnoj instrumental'noj jekspertnoj sistemy dlja vybora sistemy avtomatizacii [Using situational tool expert system to select the automation system]. 2005. [In Russian]
17. Dzengelevskij A.E. Predstavlenie znanij s pomoshh'ju modificirovannoj tablicy reshenij [Knowledge representation using a modified table of solutions]. Union Conference 2 - according to expert systems, Proc. rep., 1990, pp. 71-72. [In Russian]
18. Grushevskij S.P. Inscribed and circumscribed circle around the triangle. URL: http://mschool.kubsu.ru/cdo/shabitur/kniga/geometr/6_5/6_5.htm. [In Russian]
19. Zachman J.A. The Zachman Framework: A Primer for Enterprise Engineering and Manufacturing, Electronic book published March 2003. www.zachmaninternational.com. 2003. [In Russian]
20. TOGAF Version 9: The Open Group Architecture Framework (TOGAF). Open Group, 2011. URL: http://pubs.opengroup.org/architecture/togaf9-doc/arch/. [Accessed: 01 12 2015]. [In Russian]
21. Sheer, Avgust-Vil'gel'm, Modelirovanie biznes-processov [Business process modeling]. Serebrjanye niti. 2000. [In Russian]
22. Dzengelevskij A.E. Metodicheskie ukazanija k vypolneniju domashnego zadanija po discipline «Korporativnye Informacionnye Sistemy». Funkcional'nyj analiz uchastkov avtomatizacii predprijatij [Methodical instructions to carry out homework on the subject "Corporate Information Systems". Functional analysis of business automation stations]. MEPhI, 2005. [In Russian]
23. Dzengelevskij A.E., Nizametdinov Sh.U., Rumjancev V.P. Ispol'zovanie professional'noj jekspertnoj sistemy v VUZe [The use of professional expertise in the university system]. Cybernetics and university. Collection N 27. pp. 49-59. 1992 [In Russian]
24. Dzengelevskij A.E. Podhod k organizacii obuchenija tehnicheskogo specialista po kursu «Korporativnye informacionnye sistemy» [The approach to the organization of technical training for the course "Corporate Information Systems"]. Interactive science, pp. 86-91, 1 2016. [In Russian]