USING ONTOLOGY-BASED ADAPTABLE SCIENTIFIC VISUALIZATION AND COGNITIVE GRAPHICS TOOLS TO TRANSFORM TRADITIONAL INFORMATION SYSTEMS INTO INTELLIGENT SYSTEMS
S. Chuprina1, O. Nasraoui2
1 Perm State University, Russia
2 University of Louisville, USA
chuprinas@inbox.ru, olfa.nasraoui@louisville.edu
Content
3. Concept of proposed approach
4. Transformation traditional information systems into intelligent ones
Abstract
We present a novel environment for knowledge modeling and visualization for domain ontology design based on meta-knowledge representation (meta-level) that was also implemented within an ontological paradigm framework. Meta-knowledge representation makes the visual ontology editor more adaptable to the user’s individual preferences. This improved adaptability is expected to help domain experts, knowledge engineers, and researchers in their quests to design a domain ontology from scratch, to enhance an existing ontology, or to construct a new ontology based on existing ones, by means of visualizing the results of ontology mediation, merging, and alignment. Improved adaptability also improves collaborative visualization tools for the ontology design process. To demonstrate the practical viability of the proposed approach, we describe the main features of a novel adaptable ontology-based visual ontology editor, called ONTOLIS, and its role in creating a bilingual ontology for the computing domain.
Keywords: scientific visualization, semantic visualization, cognitive graphics, visual ontology editor, bilingual ontology, adaptable system, ONTOLIS, transformation to intelligent information system
1. Introduction
Visualization spans different areas of computer graphics and animation and in its broadest terms, is understood to be any technique for creating images that represent abstract data. This paper deals with scientific visualization and intelligent graphical techniques to improve the adaptation level of visual ontology editors. We use the term "scientific visualization" in the broadest sense, encompassing not only scientific computing and process visualization but also business (Information visualization), advanced data analytics (Data visualization), and knowledge engineering (knowledge modeling and ontology design visualization).
Hence, in general, the term "scientific visualization" may be used to refer to any technique involving the transformation of data into visual information in such a way as to convey important aspects of a process or facts that are the subject of research, or observations in a well understood, compact and easily comprehensible way. Taking into account this point of view and regarding the process of ontology construction as an intelligent process, we present our efforts in using fundamental, as well as modern trends emerging from different branches of "scientific visualization", including information visualization and the related field of visual analytics in order to develop a visual editor for ontologies, named ONTOLIS. The primary concerns of this editor consist of adaptive and interactive methods that provide personalized and enhanced visualization.
In this paper, we propose a knowledge modeling and visualization environment for domain ontology design based on meta-knowledge representation (meta-level) that was also implemented within an ontological paradigm framework. Due to its meta-knowledge representation, the visual ontology editor is more adaptable to the user’s individual preferences. Improved adaptability can help domain experts, knowledge engineers, and researchers in their efforts to design an entirely new domain ontology, to enhance an existing ontology, or to construct a new ontology based on existing ones, by means of visualizing the results of ontology mediation, merging, and alignment. In addition, improved adaptability enhances collaborative visualization tools for the ontology design process.
To demonstrate the practical viability of the proposed approach, we describe the main features of an adaptable ontology-based visual ontology editor, called ONTOLIS, and its role in a real life project centered on “Development Models and Tools to Transform Traditional Information Systems into Intelligent Systems via use of a Bilingual Ontology in the Computing Area”.[1]
2. Motivation and objectives
Ontology technologies have recently reached a good level of maturity with their applications proliferating in areas such as artificial intelligence and computer science, economics, education, ecology, healthcare, and many others. In fact, ontology-driven applications have already demonstrated their success in knowledge management, intelligent information resource integration, natural language processing, bio-informatics, e-commerce, etc. (see, for example, [1, 2]).
Ontologies represent key elements of the Semantic Web and Linked Data, allowing data to be shared and reused across applications, enterprise, and community boundaries. The main idea of the Semantic Web is to formalize data and information representation in a machine-readable way. This formalization aims at making the Web meaningful based on a formalized notation of content, followed by a formalization of the underlying structure, and provides a rule and meaning inference mechanism to make the Web accessible for both machines and humans (see [3] and the extensive list of references in [4]). To support semantic mappings, ontologies provide an explicit definition of meaning of the information to be exchanged.
Ontologies describe the concepts and relationships in an area of knowledge using a logic-based language and have a related graphical representation. A logic-based language enables automated reasoning, while a graphical representation enables not only viewing an ontology in a graphical form, but also the ability to analyze, construct, and adjust this ontology in order to improve its quality within a visual editor environment. This in turn makes it easier to understand and less intimidating. In this sense, ontologies integrate the benefits of logical and graphical knowledge representation methods. There are many visual ontology editors that enable the creation of an ontology in graphical form, without the necessity of writing an appropriate ontology description using a logical language. The graphical representation, in this case, is automatically transformed into related declarations using an ontology representation language notation (this language is often a standard OWL[2]).
A detailed overview on the subject can be found in several comprehensive surveys and reviews of existing approaches for adaptive and semantic visualization [4-7]. These surveys pointed to several gaps and limitations in both research areas. In fact, according to a survey of existing ontology visualization systems [4], none of the existing systems support the high level of investigation and cognitive search tasks, proposed by Marchionini in [8].
Our goal is to show how to combine traditional ontology visualization tools with the advanced adaptable visual editor ONTOLIS to improve the user’s explorative and investigative ability during the ontology construction process. ONTOLIS has been developed at Perm State University (Russia) [9] and is currently being improved to add collaborative ontology construction capability[3].
Until recently, ontology construction was the purview of a small number of experts. In recent years, however, more and more researchers and organizations in an expanding range of domains are recognizing the importance of ontology engineering methods in meeting their objectives. Making ontology design more useful to a wider range of people for a more diverse range of purposes is one of the key challenges to be addressed in the development of ontology-driven systems. The domain scientists and users of technology (including casual users) have an essential role to play in the design of any ontology based system, not only for an improved understanding of an application domain, but also for direct participation in the ontology design.
Different users and different use cases, however, demand different visualization and interaction techniques to facilitate ontology creation. It is therefore necessary to develop an ontology visualization environment that can be adapted to specific user requirements. First of all, it is necessary to categorize various types of visual ontology tools and their implementation mechanisms that may need to be adapted and then to develop a basic adaptation mechanism that enables extending the adaptive capabilities of the system based on the specification of these categories. We describe this in the next section.
It should also be noted that an outstanding feature of ontology-driven system development is the ability to make changes in the program behavior to automatically adapt the system to solving a certain class of problems for a new knowledge domain (in the case of using domain ontologies), or even to solving a new problem within an existing knowledge domain (in the case of using application ontologies) without source code modification.
3. Concept of proposed approach
As we have discussed above, graphical visualization helps to browse and understand the structure of ontologies. Also, because they are semantically rich, visual ontology editors make these semantics even more explicit. According to [5], there is increasing focus on developing tools to graphically visualize ontologies and thus aid in their exploration, assessment, and analysis. Our emphasis in this paper is related to the adaptability and expandability of ontology visualization tools. We should therefore start by demonstrating the mechanisms used for implementing these features in a popular knowledge-modeling and ontology development tool, called Protégé[4] [10, 11].
Protégé provides an intuitive editor for ontologies where classes are organized in a specialization/generalization hierarchy through “is-a” (or inheritance) links. Each class is allowed to have zero, one, or multiple parent classes and has properties describing various features of the modeled class. Properties are typed (strings, numbers, boolean, enumerations, or instances of other classes are allowed) and may have restrictions on the value ranges. Each class may have instances corresponding to individual objects in the domain of discourse (instances) and each instance has a concrete value for each property of the class it belongs to. The aggregation of classes and their instances forms the knowledge base of a subject domain.
Figure 1 shows a screenshot of Protégé with the visualization of part of a bilingual ontology (Russian and English languages are used) describing the main concepts and their relationships from the subject domain of Genetic Algorithms[5]. Different parts of this ontology will be shown as examples to illustrate the features of our approach.
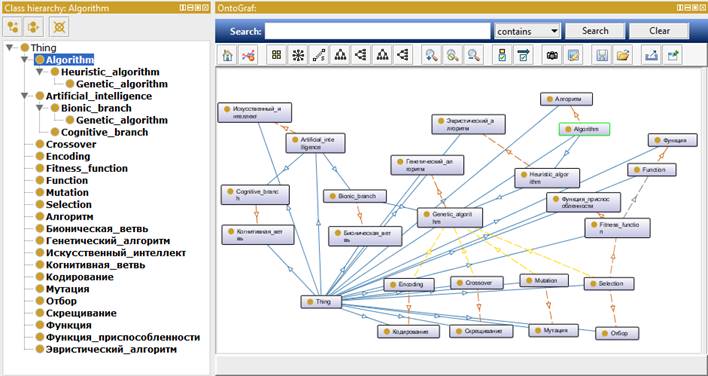
Fig. 1. Part of a bilingual ontology of the Genetic Algorithms domain within Protégé
The task of visualizing the full set of ontology features is not an easy one, and it is necessary to take into account the following properties of an ontology [5]:
- Hierarchy. A type of organization that, like a tree, branches into more specific units, each of which is “owned” by the higher-level unit immediately above it.
- Property representation. More than a hierarchy, as its concepts are described by using restrictions on properties.
- Level of detail. Possibility to choose until which level an ontology is to be provided.
- History. The concepts that were chosen in the previous steps.
- Filtering. Ontologies could contain hundreds of properties. The user can be interested in only the subset of the ontology, based on the central concept and the properties of the user’s choice.
- Multiple geometrical views. The representation of the graph in different geometrical models to better understand the structure of the ontology.
- Zoom semantic/geometric. To see more or less details during ontology exploration. With the geometric zoom, the visualized object is scaled when the user zooms in/out. The semantic zoom provides the possibility to see more/less details of the object by zooming in/out.
In order to support visualization of the above properties and additional features, such as extra ontology management tools, multimedia support, querying and reasoning engines, problem solving methods, etc., Protégé has an increasing number of plug-ins. Table 1 illustrates a small part of the possibilities offered by different Protégé plug-ins for visualization of classes, instances, and role relations. As can be seen in this table, it is often necessary to run different plug-ins to get different kinds of visualization of the nodes and links.
Table 1. Some ontology visualization characteristics in Protégé tools (adapted from [ 2]).
|
Protégé Tool name |
Protégé Class browser |
Protégé OntoVis visualization |
OntoSphere |
Jambalaya |
Protégé TGVizTab |
|
Ontology Technique used |
indented list |
node-link and tree |
node-link and tree |
zoomable |
focus+context |
|
Dimension |
2D |
2D |
3D |
2D |
2D |
|
Classes & Instances |
Classes – nodes of indented, expandable and retractable tree. Instances – in a separate window |
Rectangle nodes with different color for classes and instances |
Classes and instances are represented as spheres |
Represented as rectangles inside their parent node |
Classes and instances are represented as labels of different colors |
|
Role relations |
Supported through the properties window only |
They are represented with labelled links |
In Concept Focus View links are used to denote role relations |
Supported through the propertied and as directed links with their label visible as a tool tip |
Links with labels on mouse over are used |
We propose a different approach that does not exclude the use of plug-ins, but makes it possible to use the different visual techniques within one ontology representation to meet the special needs of ontology engineers, domain experts and causal users while also taking into account the layout, interactive, and pragmatic aspects of visualization. After analyzing the possible types of adapting a visual ontology editor’s capabilities to the user’s needs, we came to the conclusion that at the top level of aggregation, they can be summarized in three main interconnected categories related to the answers to the following questions:
- How to adapt the visual editor to new forms of concepts and their relation representation from the graphical point of view (layout aspect);
- How to adapt the visual editor to new reactions to the different kinds of events such as click, double-click, etc., and to the different types of graphical objects and groups of objects (interactive aspect);
- How to adapt the visual editor environment to new methods of interpretation of the ontology visual representation, including the generation of appropriated axioms (pragmatic aspect).
The groups of graphical objects (nodes and links), mentioned above, may have different methods of grouping. It may be a simple group of selected visual objects; but in more complex cases, groups may be organized according to customizable syntactical or semantical rules. For example, it may be a group of nodes having a common parent node. A high-level interface to add declarations of such rules to the visual ontology editor environment is an essential part of the approach.
The meta-level descriptions of both visual and programming entities that are affected by the answers to the above questions, are considered as meta-knowledge (“knowledge about knowledge”). In our opinion, an ontology is very suitable for the purpose of representing such meta-knowledge. Hence, we named the resulting ontology a “meta-ontology”.
We have applied the ontology engineering methods directly to the development of an ontology editor environment. The main idea of our approach is that all kinds of mechanisms, controlling the visual operations of the ontology editor, should be based on the editor’s knowledge (meta-knowledge) about itself (some kind of ontological declarations about supported classes, visualization methods, list of processed events, methods of contextual event processing, settings, etc.) To represent such kind of knowledge, we also use an ontology (named “meta-ontology”, as mentioned above), which is implemented by means of the same basic visualization tools that are used to develop the domain ontologies. Hence, the ontology editor’s software uses meta-knowledge in the form of a “meta-ontology” to control its own work. This in turn allows not only adapting the ontology editor to new users' needs and expanding the functionality of the editor, but also reducing the gap between domain experts and ontology engineers.
Usually, domain experts, who are involved in the ontology design process, are not comfortable with the direct ontology construction using a common visual ontology editor’s environment. On the other hand, ontology engineers may not be as familiar as domain experts with the application domain being modeled. To bridge the gap between domain experts and ontology engineers, we offer the ontology engineers simple means (node-link and tree) to describe knowledge at the meta-level ("meta-ontology"). These means are the same means used to visualize graphic objects at the domain level in the knowledge area (domain ontology), with the additional opportunity to add to the graphical object representation at the meta-level, the specification of new forms of layouts, reactions to events, and functions implemented in them.
We show how the same fragment of bilingual ontology from the subject domain of Genetic Algorithms, presented in Figure 1, looks within ONTOLIS as shown in Figure 2. Figures 3-6 show the steps needed to add to the “meta-ontology”, the new layout feature (in our example it is “offset”). Extension “.ONT” is the extension of ontology representation files, including the representation of meta-knowledge in the internal level of the ONTOLIS framework; file conversion from this extension to standard OWL is automatically provided (in both directions). ONTOLIS also provides export/import from OWL to ONT format and it is possible to expand the set of export/import possibilities to other formats including proprietary ones with the help of a high-level interface.
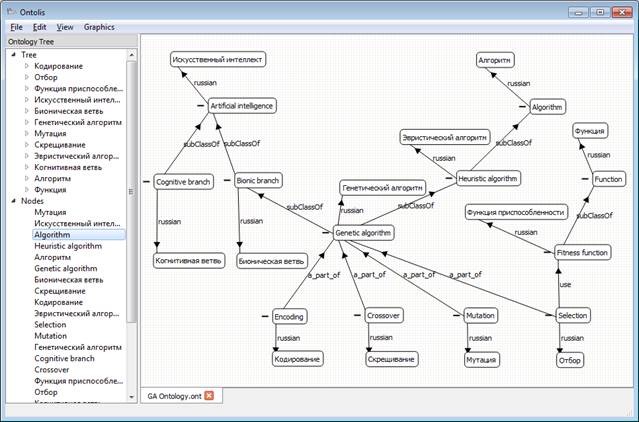
Fig. 2. Part of a bilingual ontology of the Genetic Algorithms domain within ONTOLIS
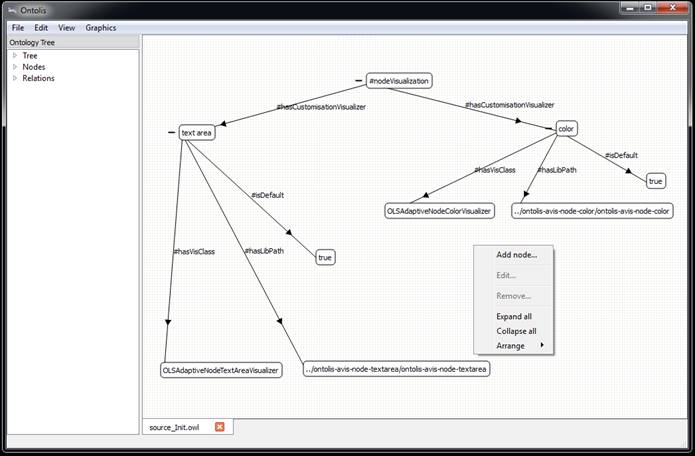
Fig. 3. Step #1
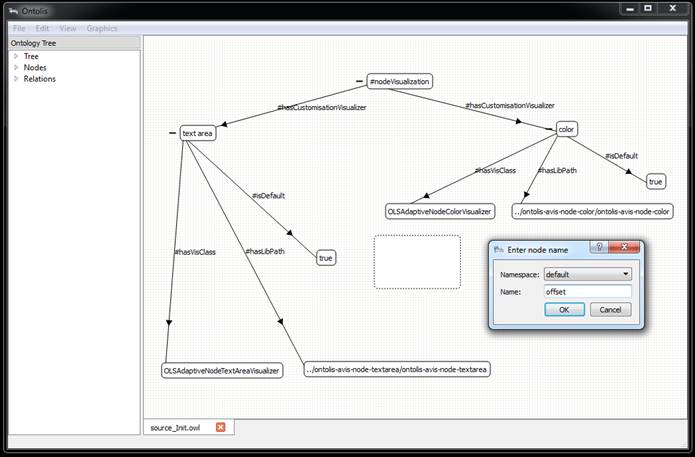
Fig. 4. Step #2
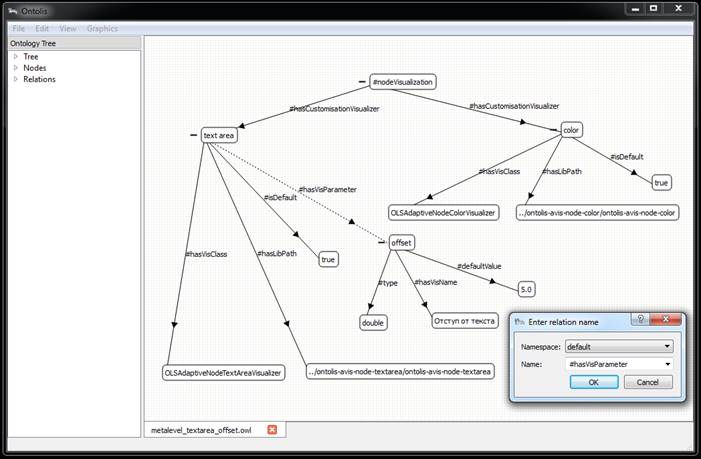
Fig. 5. Step #3
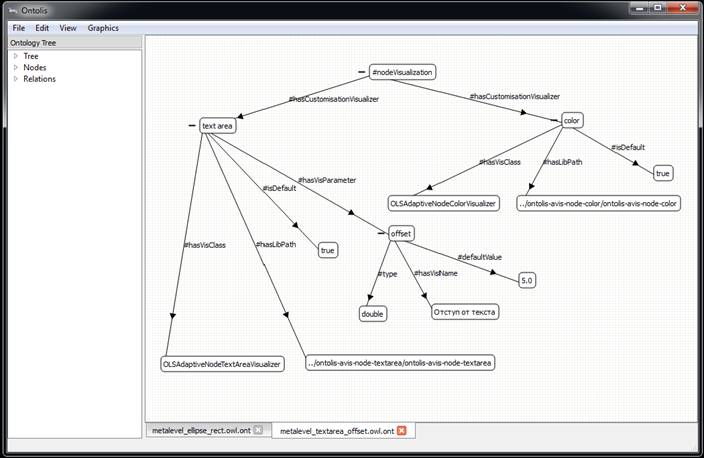
Fig. 6. Step #4
Figures 7-10 show a step-by-step depiction, illustrating how the changing of layout meta-level specifications drives the changing of layouts on the domain ontology visual representation level. Note that figure 7 shows the initial state of layout meta-level specifications for node visualization where “rounded rectangle” representation is used as default.
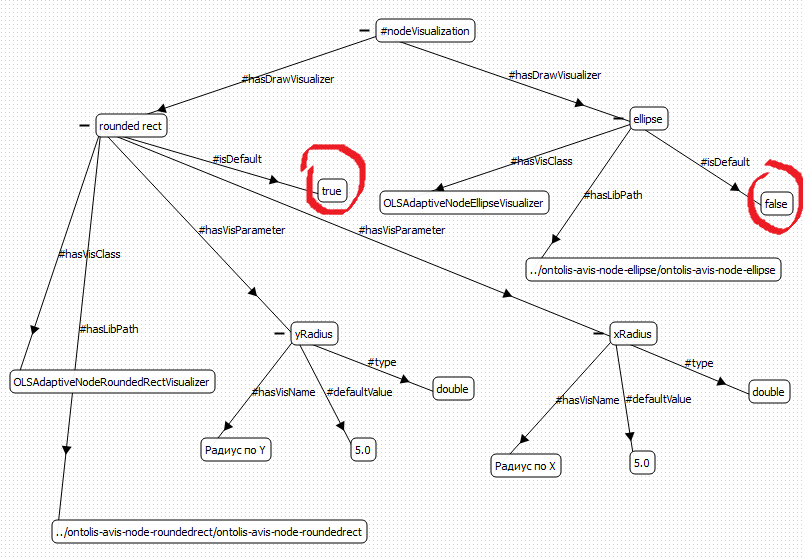
Fig. 7. Part of the initial state of layout meta-level specifications
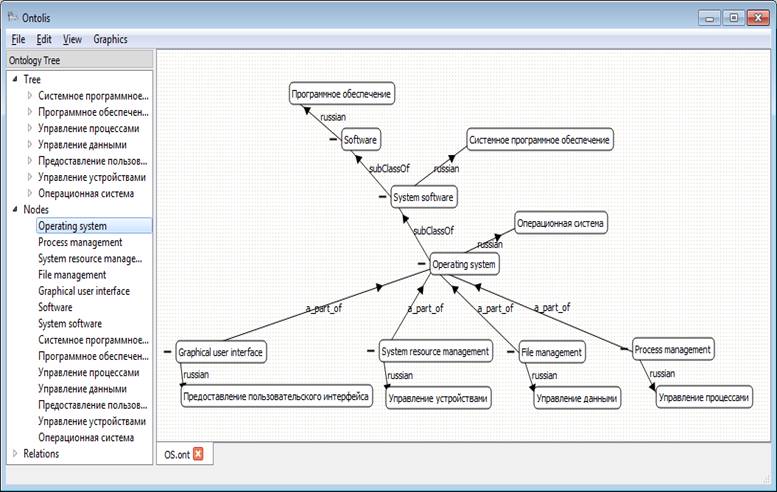
Fig. 8. Part of the bilingual ontology of the Operating System domain according to the meta-level specifications shown in figure 7
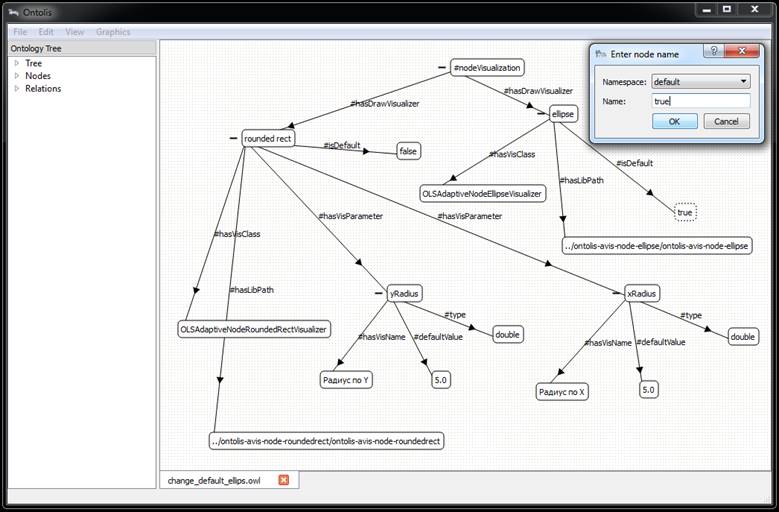
Fig. 9. Part of the layout meta-level specifications after the changes
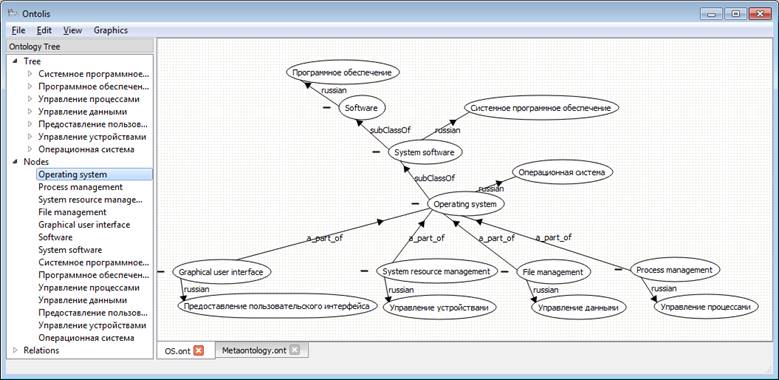
Fig. 10. Part of the bilingual ontology of the Operating System domain according to the new layout meta-level specifications after the changes shown in figure 9
Figures 11-12 show how ONTOLIS enables to expand its own environment with new functionality using a high-level interface. They also show how it adapts an ontology’s visual representation to new reactions to the different kinds of events. Figure 11 demonstrates the new class embedding process: class OLSAdaptivNodeRoundedRectVisualizer from a related library that implements node visualization in rounded rectangle view.
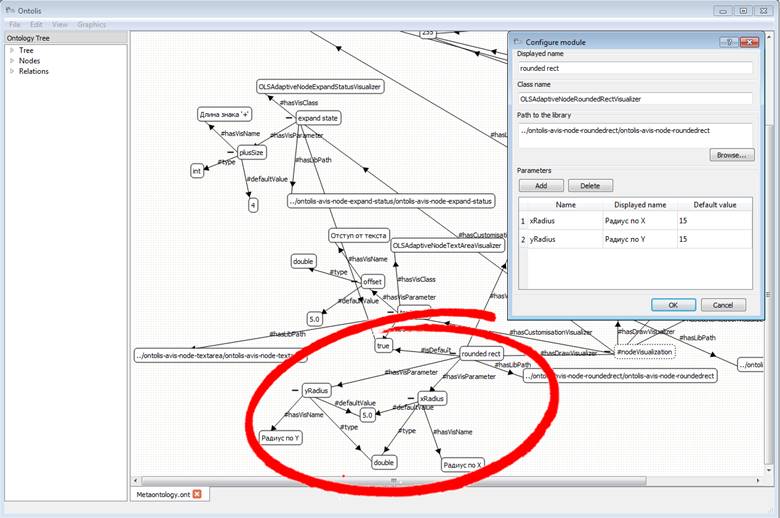
Fig. 11. New class embedding process within ONTOLIS meta-ontology level
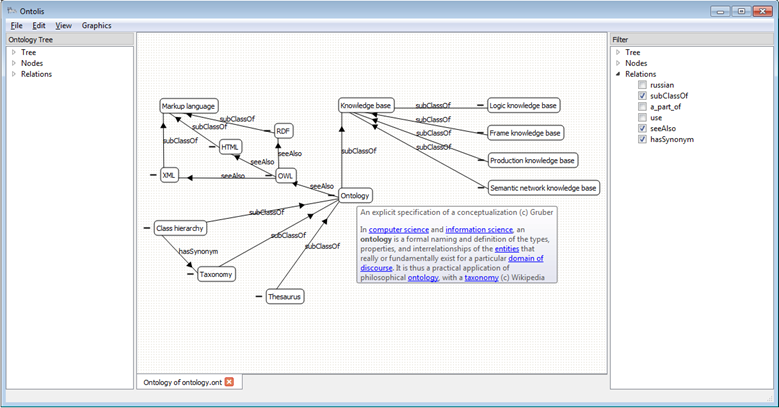
Fig. 12. New reaction on the node “double-click” event and semantic filter using
Figure 12 shows how after meta-level changing of the node reaction specification for the “double-click” event, the reaction on the “double-click” event for the nodes representing the domain ontology concepts, has been adapted. This example represents part of the domain ontology about the main concepts of the Ontology subject area. The reaction is changed to showing the annotation with definitions of the related concepts (initially there was no special reaction on “double-click” event except for the standard node dotted line selection as default). Figure 12 also shows the use of an expandable set of semantic filters (on the right part of the screen) to simplify the ontology representation for exploration and modification. It is shown that the semantic filter restricted showing the Russian notation while allowing the display of only the “subClassOf”, “seeAlso” and “hasSynonym” links.
ONTOLIS, therefore, provides a well understood, compact and easily comprehensible tool to adapt an ontology’s visual representation to the needs of the users, and to create an ontology either from scratch, by enhancing an existing ontology, or by constructing it based on existing ontologies. There is a basic set of system links’ interpretations that are intended for automatic generation of formal axiom specifications in OWL notation. The resulting ontology description in OWL format, including generated axioms, is accessible for usage within the environments of other ontology editors, for example in Protégé, for searching and querying. We believe that it is very useful to integrate the capabilities of the semantic visualization tools of ONTOLIS with the useful capabilities of Protégé. This benefit has been confirmed in practice in our successful projects and in the process of PSU students’ participation within the framework of research projects.
Further discussion about the challenges of creating and processing large ontologies is beyond the scope of this paper. However, we will mention that in our view, in order to tackle the wide range of problems, including visual analytics and Big Data analytics, it is not necessary to create one “Big Ontology”. Instead, it would be sufficient to gradually and progressively create a set of ontologies that are stored in the same repository as other resources of the related subject domain and to process them in parallel. In this case it would be necessary, however, to scale the storage capacity accordingly and to use advanced ranking mechanisms, for example by automatically building so-called ‘ontology profiles’ with meta-data for every resource during its allocation into the repository; and at the final stage of processing, to use special techniques (one of them based on Genetic algorithms is presented in [12]) to integrate and rank the results. In this paper, we have focused on the development of visual ontology tools that are helpful for sense-making during the ontology design process and to accelerate scientific discovery.
4. Transformation traditional information systems into intelligent ones
As mentioned in the introduction, to demonstrate the viability of the proposed approach in practice, we describe not only the main features of the ontology-based adaptable visual ontology editor, called ONTOLIS, but also its role in the project titled “Development Models and Tools to Transform Traditional Information Systems into Intelligent Systems via use of a Bilingual Ontology in the Computing Area”. Within this project, a web-service prototype, called Reply, described in [13], was implemented to demonstrate the usefulness of the proposed approach.
Using ONTOLIS, for rapid and comprehensive design of adequate domain ontologies by casual users, helps tackle the following problems of traditional information systems in the context of searching and querying:
- There are no possibilities to ask natural language (NL) questions in any form in a traditional information system (as is the case with Web search engines).
- A traditional information system does not take into account the semantics of the data links.
- A traditional information system does not take into account the context of the request.
- It does not take into account the possibility of generalizing/specializing terms (Hyponymy and Hypernymy in ontology terms).
- It does not take into account the existence of synonyms.
- It does not allow adapting to the specific subject area (there are no specific relationships).
- It only allows structured query language (SQL) requests.
Reply provides a natural language query (NL-query) interface to traditional information systems. As traditional information systems are based on highly structured data (for example, within a relational data base), SQL is a more adequate language for searching. Yet, it is more convenient for the casual user to use natural language queries to structured data, instead of SQL, especially in case they have no information about the database schema. Our approach is based on the idea that automatic transformation of a NL-query into a SPARQL-query (which is a special language, used for ontology-querying)[6], and further from this SPARQL-query to a SQL-query, is more comprehensive and effective than transforming a NL-query to SQL-query directly.
To transform a traditional information system into an intelligent information system, we propose to transform the original information system into an Ontology Based Data Access (OBDA) system automatically and to use Reply as an ontology based service for NL-querying. The availability of such a service is an essential criterion in order to consider the system “intelligent”. OBDA-frameworks are still in active development – see, for example, the Proceedings of the International Workshop on Visualizations and User Interfaces for Ontologies and Linked Data, VOILA 2015 [2]. New techniques are starting to be applied to generate optimal SQL-queries based on SPARQL-queries’ specifications. According to our review, the most prominent OBDA-framework is Ontop [14-16]. Ontop is currently the only fully implemented OBDA system that is freely available, and we therefore use it in our service.
The main advantage of the proposed approach is the ability to automatically handle an extensible ontology in a specific domain that can be automatically extracted from a legacy information system database, and further equipped with a NL-query interface, in order to transform it into a more intelligent system without source code modification. The ability to take into account synonyms, hyperonyms and hyponyms, which are automatically extracted both from the domain ontology and from external information sources, within the context of an information retrieval request, makes it possible to enrich semantic search services.
Since the present paper is focused on the visualization task, only a few details will be given about the whole system architecture, in order to show the place and the role of visualization tools. Figure 13 shows the main resources and program components that are used to implement our approach, and shows the stage where ONTOLIS plays an important role. Standard JDBC metadata-querying functions and OWL API are used to extract the Database schema from a legacy information system database, and to automatically transform it into ontology. Table names are mapped to ontology classes, foreign keys are mapped to object properties, and other column names are mapped to data properties. Available metadata is also used to generate special mappings rules in a format that is supported by an OBDA-framework. OBDA-frameworks are used to automatically transform SPARQL-queries into SQL-queries and do not depend on the specificities of a concrete application domain and Database Management System.
To bring the NL interface into an OBDA-system, Reply provides a web-based GUI that looks like a traditional web search engine query page and the corresponding back-end. During the lexical, syntactical, and semantic analysis of an initial NL-query, concepts from the original query are extracted by matching query words with the concepts that are contained in the domain ontology. A SPARQL-query is thus constructed using the correspondence between the interconnections linking the ontology concepts and the related constraints that are also extracted from the original query.
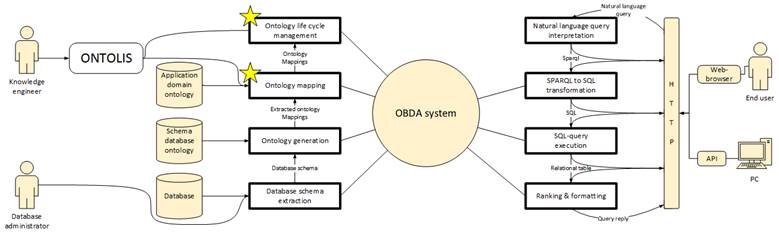
Fig. 13. The main stages of transformation of a traditional information system with structured databases into an intelligent information system
The cognitive capabilities of ONTOLIS are applied during the OBDA-system building stage. One of the most important steps is connecting an information system ontology, that was automatically generated from a legacy database schema, with a domain ontology using equivalence axioms. ONTOLIS allows casual users to expand the existing relationships in a simple way, by adding new ones, while taking into account hyponymy, hypernymy, synonymy, etc., and thus help support better query results. Automatically enriching the original query with hyponyms, hypernyms, and synonyms from a domain ontology, in the context of the query, allows getting a more comprehensive answer to a NL-question, by taking into account knowledge that is not represented in explicit form in the database. Figures 14-17 show an example of the benefits of using Reply to transform an information system, consisting of a scientific authorship domain database, into an intelligent system with a NL querying interface to the structured data.
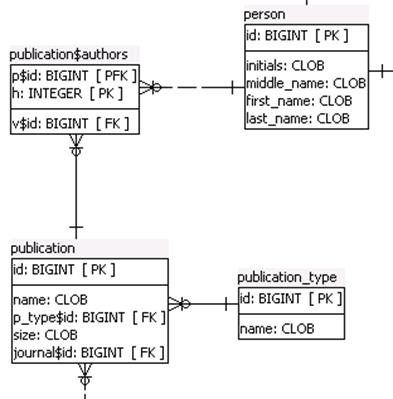
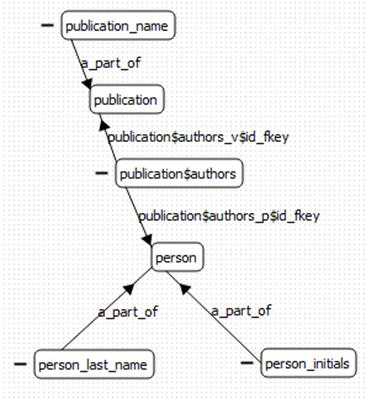
Fig. 14. Part of an original scientific authorship domain database schema from a legacy information system (left) and fragment of related part of an ontology that has been automatically generated (right)
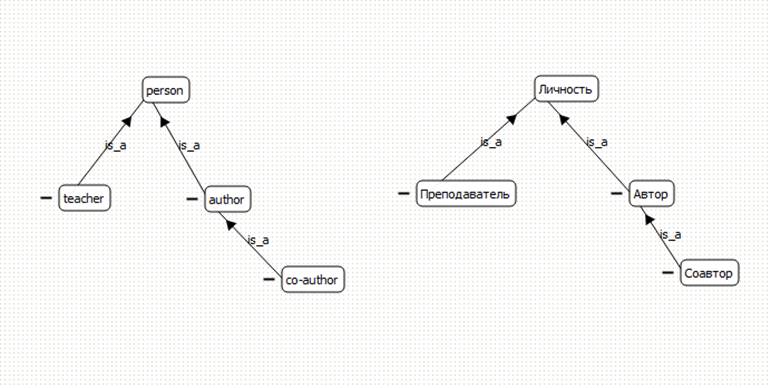
Fig. 15. Part of knowledge about a scientific authorship domain database which is not represented in explicit form
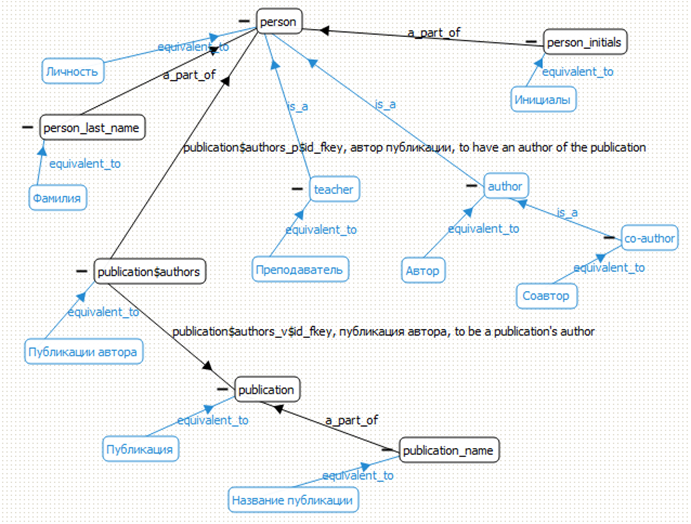
Fig. 16. Part of the resulting ontology, within the ONTOLIS visual editor, enriching the original ontology, shown in figure 14
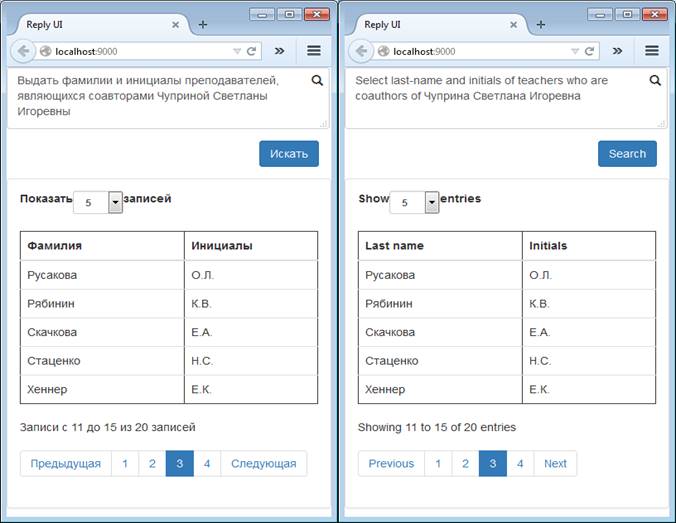
Fig. 17. Query results about the co-auhors of Svetlana Chuprina using the ontology built within ONTOLIS, that was enriched based on the original ontology shown in figure 14
We use data from an actual scientific authorship domain database from an information system at PSU, named ETIS (which contains data, mainly in Russian). In this case, the Reply system generates successful query results using a bilingual ontology[7] that has been enriched within the visual ontology editor ONTOLIS. Using the bilingual domain ontology in the computing area helps to tackle a wide range of problems, for example filtering search results; semi-automation of analytic report construction; automatic generation of teaching information materials, etc.
5. Conclusion
We presented a visual ontology editor, called ONTOLIS, which combines the traditional tools of ontology semantic visualization with cognitive and interactive graphical techniques to enhance a user’s explorative and investigative capabilities during the ontology construction process. To demonstrate the viability and usefulness of the proposed approach in practice, we described the main features of the proposed ontology-based adaptable visual ontology editor and its role in the design of a web-service, called Reply, which forms an essential part of transforming a traditional Information System into an intelligent Information System with a natural language query interface to structured data. Our case study demonstrated such a transformation via use of a bilingual ontology in the computing domain.
The benefits of using ONTOLIS in practice extend to developing ontology-based adaptive scientific visualization systems, such as SciVi, which has several successful applications in practice [17-19] due to its high-level integration with third-party solvers while maintaining independence from the solver's architecture and solver's application domain. Other successful practical uses include using ONTOLIS in the real-world industry projects and research work of Masters and postgraduate students at Perm State University [20].
Using ontology-driven methods for the implementation of the visual ontology editor ONTOLIS allows an easy expansion of its adaptive capabilities. We are currently developing advanced tools for ontology design in collaborative environments, including a web-based multi-access visual ontology editor
References
1. Proceedings of the 19th International Conference on Knowledge Engineering and Knowledge Management (EKAW 2014). November 24-28, 2014, Linköping, Sweden. Editors: Krzysztof Janowicz, Stefan Schlobach, Patrick Lambrix, Eero Hyvönen. Lecture Notes in Computer Science. Springer. Vol. 8876. 2014. http://link.springer.com/book/10.1007%2F978-3-319-13704-9
2. Proceedings of the International Workshop on Visualizations and User Interfaces for Ontologies and Linked Data (VOILA! 2015) Co-located with ISWC 2015 Bethlehem, Pennsylvania, USA, October 11, 2015. Vol-1456. urn:nbn:de:0074-1456-1. Editors: Valentina Ivanova, Patrick Lambrix, Steffen Lohmann, Catia Pesquita. 2015. http://ceur-ws.org/Vol-1456/VOILA2015Proceedings.pdf
3. Berners-Lee T. Weaving the Web: The Original Design and Ultimate Destiny of the World Wide Web. Harper Business, 2000.
4. Kawa Nazemi. Adaptive Semantics Visualization. TU Darmstadt Dissertation. Eurographics. Dissertation. 2014. https://diglib.eg.org/bitstream/handle/10.2312/12076/nazemi.pdf
5. Sivakumar R., Arivoli P.V. Ontology Visualization Protégé Tools – A Review. International Journal of Advanced Information Technology (IJAIT). Vol. 1(4). 2011. PP.1-11.
6. Dudas M., Zamazal O., Svatek V. Roadmapping and Navigating in the Ontology Visualization Landscape / K. Janowicz et al. (Ets.): EKAW 2014, LNAI 8876, Springer. 2014. PP. 137-152. http://www.semantic-web-journal.net/system/files/swj755.pdf
7. Lin X., Zhang M., Shang Y., An Y. An Ontology and Brain-model-based Semantic Discovery and Visualization System / The sixth International Conference on Advanced Cognitive Technologies and Applications (Cognitive’2014, Venice, Italy, May 25-29, 2014). 2014. PP. 72-76.
8. Marchionini G. Exploratory Search: from Finding to Understanding. Communications of the ACM (Apr. 2006). Vol. 49, No. 4. 2006. PP. 41 46.
9. Chuprina S.I., Zinenko D.V. Adaptable Visual Ontology Editor ONTOLIS. Vestnik of Perm State University, 3 (22), 2013. PP. 106-110. (in Russian)
10. Musen, M.A., Fergerson, R.W., Grosso, W.E., Noy, N.F., Grubezy, M.Y., Gennari, J.H. Component-based support for building knowledge-acquisition systems. Proc. Intelligent Information Processing (IIP 2000) Conf. Int. Federation for Processing (IFIP), World Computer Congress (WCC'2000), Beijing, China. 2000. PP. 18-22.
11. Noy, N.F., Sintek, M., Decker, S., Crubezy, M., Fergerson, R.W., & Musen, M.A., Creating Semantic Web Contents with Protege-2000. IEEE Intelligent Systems, 16. 2001. PP. 60-71.
12. Pleshkova I., Chuprina S. Using Genetic Algorithm to Improve Semantic Search in Scientific Literature (in Russian). Proc. New Information Technologies in Automated Systems: 18 Scientific Workshop. Moscow. Keldysh Institute of Applied Mathematics (Russian Academy of Sciences). 2015. PP. 544-554.
13. Chuprina S.I., Postanogov I.S. Enhancing Legacy Information Systems with a Natural Language Query Interface Service. Vestnik of Perm State University, 2 (29), 2015. PP.78-86.
14. Bagosi T., Calvanese D., Hardi J., Komla-Ebri S., Lanti D., and etc. The Ontop Framework for Ontology Based Data Access. Proc. of the 8th Chinese Semantic Web Symposium & Web Science Conference (Wuhan, China, August 8–12, 2014). Editors: Dongyan Zhao, et al. In book The Semantic Web and Web Science. Series Communications in Computer and Information Science. Springer. 2014. Vol. 480. 2014. PP. 67-77.
15. Kontchakov R., Rezk M., Rodríguez-Muro M, Xiao G., Zakharyaschev M. Answering SPARQL Queries under the OWL 2 QL Entailment Regime with Databases. Proc. of ISWC (Riva del Garda, 19-23 October). Editors: P. Mika, et al. Lecture Notes in Computer Science. Springer. 2014. Vol. 8796. PP. 552-567.
16. Rodríguez-Muro M., Kontchakov R., Zakharyaschev M. Ontology-Based Data Access: Ontop of Databases. Proc. of ISWC (Sydney, 21-25 October). Editors: H.Alani, et al. Lecture Notes in Computer Science. Springer. Vol. 8218. 2013. PP.558–573.
17. Ryabinin K., Chuprina S. Adaptive Scientific Visualization System for Desktop, Computers and Mobile Devices. Procedia Computer Science, Elsevier. Vol. 18. 2013. PP.722–731.
18. Ryabinin K., Chuprina S. Development of Multiplatform Adaptive Rendering Tools to Visualize Scientific Experiments. Procedia Computer Science, Elsevier, Vol. 29. 2014. PP. 1825-1834.
19. Ryabinin K., Chuprina S. Development of ontology-based multiplatform adaptive scientific visualization system. Journal of Computational Science, Elsevier. Vol. 10. 2015. PP. 370-381.
20. Chuprina S. Steps Towards Bridging the HPC and Computational Science Talent Gap Based on Ontology Engineering Methods. Procedia Computer Science, Elsevier, Vol. 51. 2015. PP. 1705-1713.
ПРИМЕНЕНИЕ ОСНОВАННЫХ НА ОНТОЛОГИЯХ СРЕДСТВ НАУЧНОЙ ВИЗУАЛИЗАЦИИ И КОГНИТИВНОЙ ГРАФИКИ ДЛЯ ТРАНСФОРМАЦИИ ТРАДИЦИОННЫХ ИНФОРМАЦИОННЫХ СИСТЕМ В ИНТЕЛЛЕКТУАЛЬНЫЕ
С.И. Чуприна1, О. Насраоуи2
1Пермский государственный национальный исследовательский университет, Пермь, Россия
2Университета Луисвилля, г. Луисвилль, штат Кентукки, США
chuprinas@inbox.ru, olfa.nasraoui@louisville.edu
Аннотация:
В работе представлены новые методы и средства моделирования баз знаний, разработки предметных онтологий в среде адаптируемого визуального редактора онтологий ОНТОЛИС с акцентом на внедрение средств интерактивной и когнитивной графики в визуальные редакторы онтологий, что позволяет привлечь пользователей-непрофессионалов в области инженерии знаний к разработке предметных онтологий в сфере их профессиональной компетенции.
Отличительной особенностью ОНТОЛИС является то, что сам визуальный редактор онтологий разработан на основе методов онтологического инжиниринга. В основе функционирования визуального редактора лежит мета-онтология, легко расширяемая на уровне внешнего графического интерфейса, что позволило разработать механизм адаптации под индивидуальные предпочтения пользователей, как в плане настройки на различные способы визуализации вершин и дуг графического представления онтологий, так и в плане расширения и настройки на различные способы интерпретации вершин и дуг онтологии, а также на различные способы обработки событий в процессе интерактивного взаимодействия с пользователем.
Наличие таких механизмов упрощает работу не только онтологических инженеров и инженеров по знаниям, но и способствует моделированию баз знаний непосредственно самими экспертами в соответствующих предметных областях, а также предоставляет расширенные визуальные средства коллаборативной работы над проектом как в процессе создания онтологических баз знаний с «нуля», так и в процессе выравнивания, отображения и слияния уже существующих онтологий. Для демонстрации жизнеспособности предложенного подхода демонстрируются примеры практического применения ОНТОЛИС в различных областях: в задаче разработки билингвистической онтологии в области компьютинга, в процессе создания средств автоматизированной трансформации традиционных информационных систем в интеллектуальные, а также в области разработки средств научной визуализации и поддержки образовательного процесса в ВУЗах.
Ключевые слова: семантическая визуализация, когнитивная графика, интерактивная графика, адаптируемый визуальный редактор онтологий, билингвистическая онтология, ОНТОЛИС, трансформация традиционных информационных систем в интеллектуальные