MODELING AND VISUALIZATION OF NANOSECOND LASER VAPORIZATION OF METALS IN NEAR CRITICAL REGION
V.I. Mazhukin1,3, A.A. Samokhin2, A.V. Shapranov1,3, M.M. Demin1, P.A. Pivovarov2,3
1Keldysh Institute of Applied Mathematics, RAS, Moscow, Russia
2A.M. Prokhorov General Physics Institute, RAS, Moscow, Russia
3National Research Nuclear University MEPhI (Moscow Engineering Physics Institute), Moscow, Russia
vim@modhef.ru, asam40@mail.ru, p_pivovvarov@hotmail.com
Content
Abstract
Results and their visualizations are presented for the case of nanosecond laser ablation of a metal liquid film at different incident laser intensities G = 38.5, 44, 88 and 154 MW/cm2. The ablation of an Al film (thickness 430nm, initial particle number 5×10⁵) including subcritical to supercritical states is investigated with the help of the classical molecular dynamic method and continual description of a conduction electron subsystem. Behavior of a thinner metal film (48nm) is also investigated at G = 29 MW/cm2 and G = 51 MW/cm2 (5 and 8,8 K/ps). 3D calculation results are given in the form of 2D particle distribution snapshots as well as temperature, density, pressure and particle velocity 1D distributions. As in the previously considered case of dielectric films for metal films four different ablation regimes are observed depending on the laser intensity: quasi-stationary surface evaporation, explosive (volume) boiling, spinodal decomposition and supercritical fluid expansion. Changes in space-time behavior of the density fluctuations in these regimes are clearly seen from the presented visualizations. Explosive boiling realization in metal ablation is not evident beforehand because of the high values of the thermal conductivity and absorption coefficients which can impede the manifestation of the process. Recoil pressure pulses that are caused by explosive boiling can be used as experimental markers of getting closer to the critical region while the critical region transition is characterized by the disappearance of the pressure pulsation.
Keywords: laser ablation, molecular dynamics, explosive boiling, spinodal decomposition, supercritical expansion.
1. Introduction
Investigations of the laser metal ablation involving under critical and super critical state of irradiated matter have a rather long history [see e.g. [1-25] and references therein]. However, behavior of irradiated matters near critical regions remains unclear in many aspects up today. This concerns, e.g., metal – dielectric transition [1,2,4-6,8,9,13] and even the mere possibility of critical point manifestations in laser ablation. For this reason and because of impossibility to use static methods for determination of metal critical points their values remain not well defined.
The explosive boiling process discussed in many papers [3,6-8,23,25,26] is also not sufficiently investigated, both theoretically and experimentally. In the case of laser-metal ablation there are different conclusions on the subsurface temperature maximum effect, which influences the appearance of explosive boiling. In [23,25,26] it is stated that the temperature maximum influence on the process can be neglected while in an earlier paper [3] it is supposed that this influence can give rise to repeating explosive boiling with corresponding short recoil pressure pulses above the smooth recoil pressure.
Non-equilibrium processes behavior depends on its realization conditions. Small superheating of homogeneous metastable liquids may lead to the appearance of unstable vapor bubbles which begin to grow, as a result of liquid density fluctuations. In theory, no interaction between these bubbles is usually taken into account [27,28]. This approximation becomes invalid near the superheating limit temperature where production rate of the unstable bubbles is very high. Nevertheless, it is used in this limit in many papers [25,26,29,30] while in this case different approaches are needed. The Method of molecular dynamic modeling (MDM) is the most appropriate to deal with evolution of highly non-equilibrium liquid state near the superheating limit.
Behavior of a thin (48nm) liquid dielectric film was investigated in [31-35] during and after its homogeneous heating with the energy deposition rate 2-100K/ps with the help of the MDM method. Energy deposition rate is defined using the heat capacity value 3kBn, where kB – Boltzmann constant, n – particle concentration in the heated matter. In contrast to more intense and short energy pulses [11,15,24] inertial confinement effect is not important in the case of relatively slow heating rates and the surface evaporating cooling effect is more pronounced producing subsurface temperature maximum. It is in this maximum location where the explosive boiling begins which in the end results in a formation of two almost equal flying away fragments [32-37]. Visualization of this and other regimes of the film behavior at different energy deposition rates is presented in [35].
In thin metal films the temperature maximum during their heating is less prominent than in dielectric films because of the particularly higher thermal conductivity values. Such temperature levelling effect can significantly change the explosive boiling evolution picture. Instead of one cavity formation in the temperature maximum location many separate cavities (bubbles) may appear in the film. However, despite the temperature leveling effect in the metal films, explosive boiling also results in the formation of two fragments during its heating.
It turns out that for more thick compared with laser penetration length metal films explosive boiling process during the laser ablation is characterized with train of separate pressure picks as it has been supposed forty years ago [3].
The present paper continues previous investigations [31-40] by showing visualizations of different laser ablation regimes of metal (aluminum) films at various laser intensities and film thicknesses. The visualizations show a rather complex space-time dependent behavior of matter during laser ablation which includes four different ablation regimes: quasistationary surface evaporation, explosive (volume) boiling, spinodal decomposition, and supercritical fluid expansion depending on the laser intensity.
2. Statement of the problem
A metal film is considered as a combination of two interacting subsystems consisting respectively of the conduction electrons and the lattice ions with energy exchange between them [41-43]. This means that in general the subsystems are not in equilibrium with each other, for example, they may have different temperatures at the same point in space. Such an approach has been proposed previously to describe spin systems in solids [27], electronic and ionic subsystems in gas plasma [44].
Laser radiation propagates from right to left and is normally incident on the free surface of the film. A Part of the radiation is absorbed by the electronic components, and as a result of inelastic collisions is transferred to the ion subsystem. By using periodic boundary conditions in the directions Y, Z the problem is effectively reduced to a one-dimensional approximation along the X direction (for transport processes of laser radiation and energy into electronic subsystem).
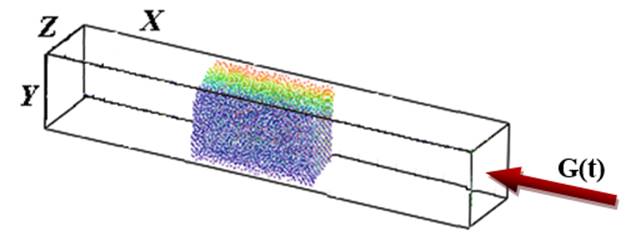
Scheme of the computational experiment at the initial time.
Combined TTM-MD [11] model is used to describe the processes.
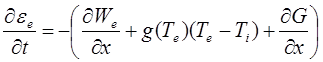
Energy balance of the electron subsystem is described by the continuum energy equation (1) supplemented by the equation of laser radiation transfer (2):
 (1)
(1)
![]() (2)
(2)
Here ![]() is the volume density of electron energy,
is the volume density of electron energy, ![]() are the electron
and ion temperatures,
are the electron
and ion temperatures, ![]() is the electron-ion coupling coefficient, G is
the density of laser radiation flux in the medium,
is the electron-ion coupling coefficient, G is
the density of laser radiation flux in the medium, ![]() is the coefficient of absorption of
laser radiation,
is the coefficient of absorption of
laser radiation, ![]() is
the heat flux,
is
the heat flux, ![]() is
the electron heat conductivity coefficient.
is
the electron heat conductivity coefficient.
The energy balance equation of the electron subsystem (1)
was solved in the condensed medium using the finite-difference method. Zero
heat flux ![]() was
used as a boundary condition at the surface of the film and its fragments.
was
used as a boundary condition at the surface of the film and its fragments.
The connection between electron energy and temperature was obtained using Fermi integrals [20]:
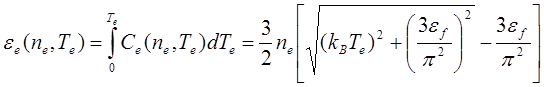 (3)
(3)
3D molecular-dynamic modeling was used to describe the ion motion:
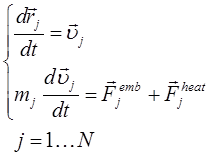 (4)
(4)
Here ![]() are the mass, radius-vector and velocity of
j-th ion respectively,
are the mass, radius-vector and velocity of
j-th ion respectively, ![]() is the force acting at the j-th ion from other
ions,
is the force acting at the j-th ion from other
ions, ![]() is the
interaction potential for which embedded atom method (EAM) potential [15] was
chosen. The energy transfer from the electron subsystem to the ion is given by:
is the
interaction potential for which embedded atom method (EAM) potential [15] was
chosen. The energy transfer from the electron subsystem to the ion is given by:
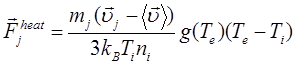 , (5)
, (5)
where ![]() is the mean ion velocity in the neighborhood of
the j-th ion.
is the mean ion velocity in the neighborhood of
the j-th ion.
At the initial time t=0 the film was assumed to be heated to the temperature of 6400K, the electron and ion subsystems are in the thermal equilibrium. The film is located in the middle of the computational domain with respect to X axis.
Critical parameters values in the considered model are Tc=7600K, rc=0,48g/cm3 and pc=1,4kbar.
3. Results and discussion
In the first place it is useful to compare behavior of the temperature and density distributions in thin (48nm) dielectric (Fig.1) and metal (Fig.2) films at approximately the same energy deposition rate: 4K/ps and 5K/ps respectively. The formula of the Effective energy deposition rate q in the metal film can be rewritten using absorbed intensity G q = GD/(3kBnL), where D = 1-exp(-aL), n – particle density, L – film thickness. Thus, absorbed intensity 29MW/cm2 corresponds to q = 5 К/ps. In the metal case these distributions have no such pronounced extreme before explosive boiling as in the dielectric film. Nevertheless, in the both cases explosive boiling begins approximately in the middle of the films.
|
|
|
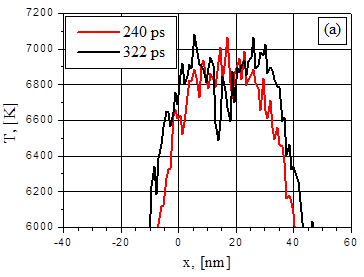
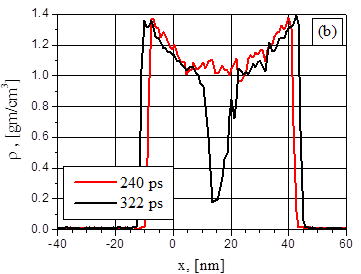
Fig.1. Distributions of dielectric film temperature (a), density (b) at 240 ps and 322 ps after the heating beginning with 4 K/ps effective energy deposition rate.
|
|
|
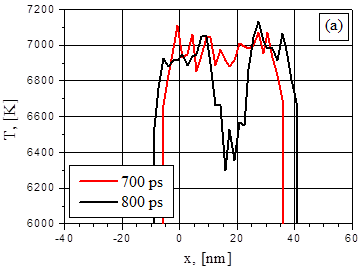
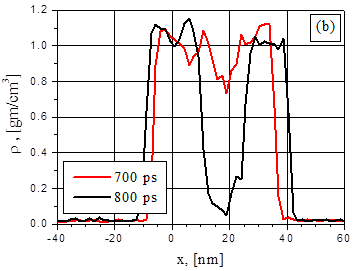
Fig.2. Distributions of metal film temperature (a) and density (b) at 700 ps and 800 ps after the heating beginning with 5 K/ps effective energy deposition rate.
Disintegration of the film into two approximately equal fragments proves the symmetry of the problem and that the metal film is characterized by a thermally thin surface. The latter one is due to the fact that the thermal diffusion length is greater than the film thickness and the radiation absorption depth. In the meantime, the difference in temperature distributions results in somewhat different behavior of the vapor cavities formation in its initial stage. This is a demonstration of the above mentioned fact that non-equilibrium processes behavior depends on its realization conditions. Initial stage of cavity formation in the metal film at the moment 826ps (Fig.3) is a fragment of the whole visualization picture demonstrating behavior of 2D particle distribution snapshots (after averaging along Z-axis) as well as temperature, density, pressure and particle velocity 1D distributions along X axis X-axis which is normal to the film plane [visualization].
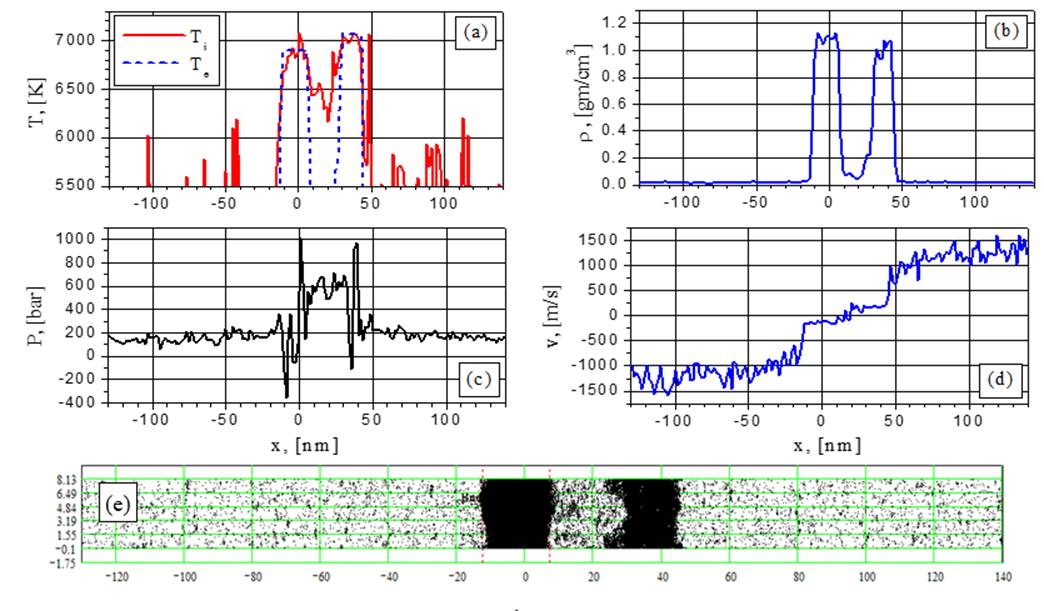
Fig.3. At the moment t = 826 ps
A Comparison of these distributions and visualizations shows that the difference between dielectric and metal films behavior appears even before explosive boiling. Density fluctuations close to the surface of the metal film begin to grow before the explosive boiling because the surface temperature in the last case is closer to its maximum value than for dielectric films. This temperature distribution leveling also gives rise to cavity surface fluctuations in its initial formation stage.
Fig.4 and the corresponding visualization show that these density fluctuations on the cavity surfaces become more pronounced when the intensity increases to 8K/ps (51MW/cm2). Instead of two fragments in this case four fragments with irregular surfaces appear from the very beginning of explosive boiling process. These density irregularities give birth to new cavities with even more fuzzy boundaries.
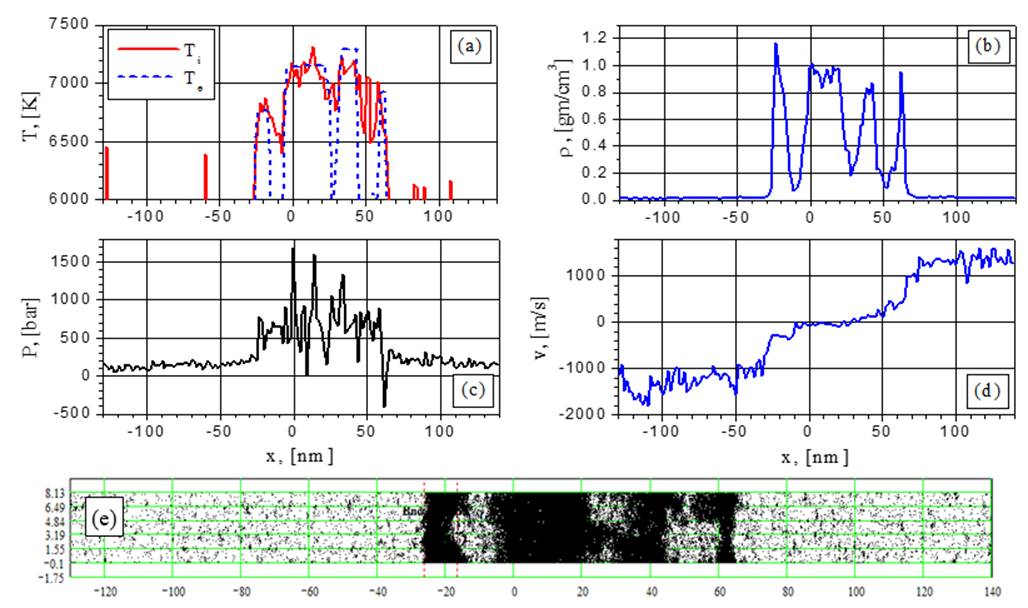
Fig.4. At the moment t = 300 ps.
The ablation process for thick metal films is different from the one for thin metal films since the temperature of the rear side film surface is lower than the one of the radiated surface. In comparison to thin films, ablation process for more thick (417nm) metal films is different because the temperature of the rear side film surface is lower than at the radiated surface. Figs.5-22 (except for Fig.9) give 1D distributions (temperature, density, pressure, velocity of particles) and 2D particles distribution which are also presented in all visualizations in the same form. The time-dependent distributions are averaged over 5 ps interval.
The temperature of the right-hand irradiated surface is
higher than the one of the left hand surface. As it is seen from Fig.25 in the
half space (infinity thickness) limit temperature maximum ![]() localization under
irradiated surface approximately coincides with radiation penetration length
localization under
irradiated surface approximately coincides with radiation penetration length ![]() and the difference
and the difference ![]() is proportional to
parameter
is proportional to
parameter![]() ,
where
,
where ![]() and
and ![]() denote the
vaporization front velocity and heat diffusivity coefficient. For metals
usually d<<1 even in the near
critical region if no metal-dielectric transition occurs.
denote the
vaporization front velocity and heat diffusivity coefficient. For metals
usually d<<1 even in the near
critical region if no metal-dielectric transition occurs.
However, despite these impeding factors our calculations (Figs.5-12)
clearly demonstrate repeating explosive boilings which occur approximately at
1.04 ns, 1.44 ns, 1.64 ns, 2 ns and 2.34 ns for G= 38.5 MW/cm2
and at 0.71 ns, 1.16 ns, 1.5 ns and 1.79 ns for G= 44 MW/cm2
after the constant intensity absorbed radiation is switch on at t=0.
During this process very thin film fragments are blown off consistently from
the irradiated surface. The initial thickness of the fragments approximately
corresponds to the penetration length ![]() which is almost two times smaller than the
fragment thickness on Figs.2,3.
which is almost two times smaller than the
fragment thickness on Figs.2,3.
Just before the explosive boiling begins (for example at the moment 1,04ns at Fig.5b and the corresponding visualization) one can see density fluctuation growth at different space position and some competition between them during their evolution under the irradiated surface. As a result of this competition from the two fluctuations only the one closest to the surface survives giving rise to the growing vapor cavity dividing the blown off fragment from the rest part of the film.
Such competition of the fluctuations is visible also at G= 38.5 MW/cm2 at later times (2ns and 2,34ns, see visualization) and at G=44 MW/cm2 at shorter times (0,71ns). It should be noted that the competition at G=44 MW/cm2 becomes less effective at later times 1,79ns (Fig.12 and see visualization) which results in a practically simultaneous formation of the two fragments.
At low intensities (38.5 and 44 MW/cm2) the density evolution of the blown off fragments is not monotonous (Figs. 6b, 7b) with a maximum which exceeds the film density at the irradiated surface. This behavior is more clearly visible in the linear scale Fig.9 where 1ps time averaging is used. It means that the fragments, which are in a process of flying away stabilize so that some stabilization of the flying away fragments occurs so that the fragments provide significant jumps in the vapor density, pressure and particle velocity distributions in the ablation flow (Fig. 7b, 7c, 7d).
The Vapor velocity jumps to the same positive (right surface) or negative (left surface) values which are determined with vaporization kinetics.
At increased intensities (88 and 154 MW/cm2) no fragment density augmentation is observed and the fragment boundaries become less distinct as it is seen from Figs.13b-20b and the corresponding visualizations (88 and 154 MW/cm2). Such regime can be denoted as a spinodal decomposition which takes place below Tc and Pc with more smoothed phase boundaries than in the explosive boiling case. Because of the high heating rate corresponding to 88 and 154 MW/cm2 the explosive boiling process has no time for the development which is observed at the lower intensities.
Thick metal film G = 38.5 MW/cm2![]()
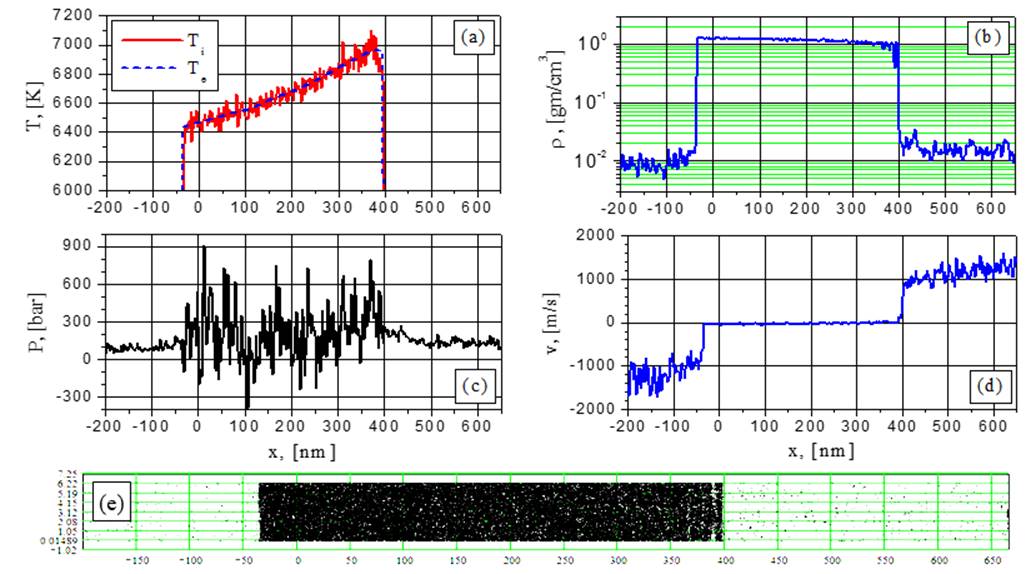
Fig.5. Electron and ion temperature (a), density (b), pressure (c), velocity (d) and particle (e) distributions for G=38.5 MW/cm2 at the time t = 1.032 ns: the beginning of explosive boiling.
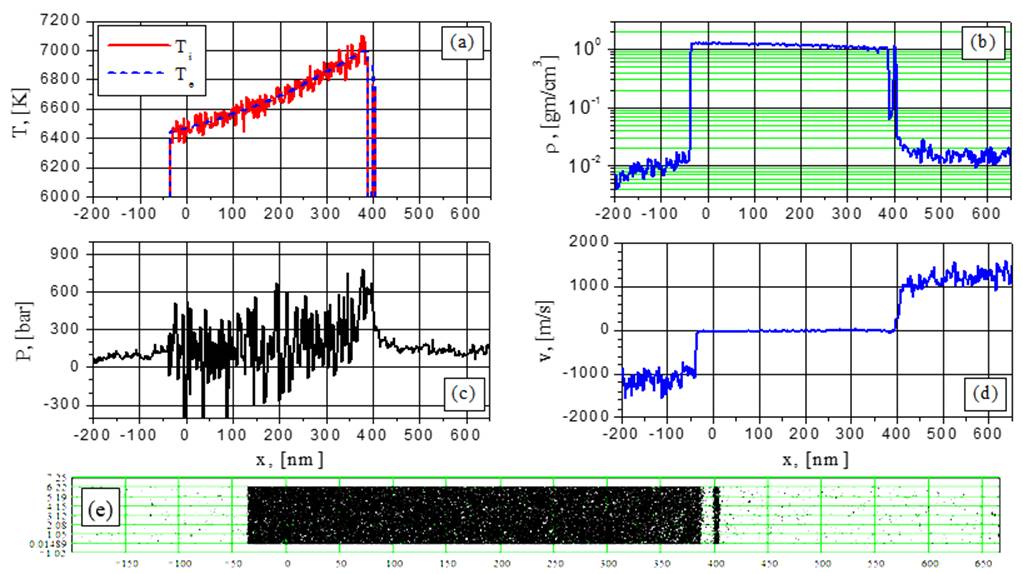
Fig.6. Electron and ion temperature (a), density (b), pressure (c), velocity (d) and particle (e) distributions for G=38.5 MW/cm2 at the time t = 1.067 ns: separation of the first fragment.
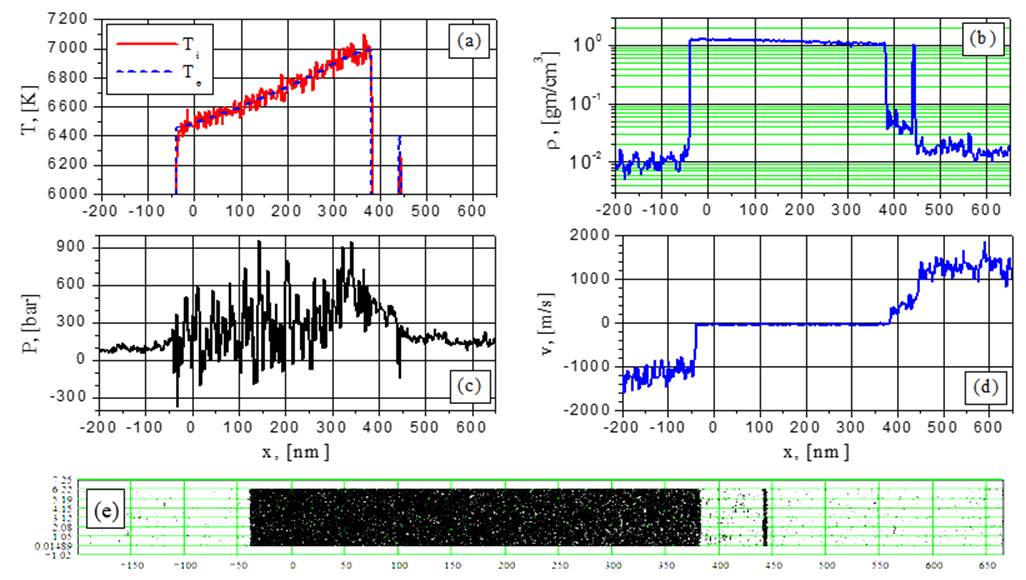
Fig.7. Electron and ion temperature (a), density (b), pressure (c), velocity (d) and particle (e) distributions for G=38.5 MW/cm2 at the time t = 1.157 ns: velocity and density variations; growth of the fragment density.
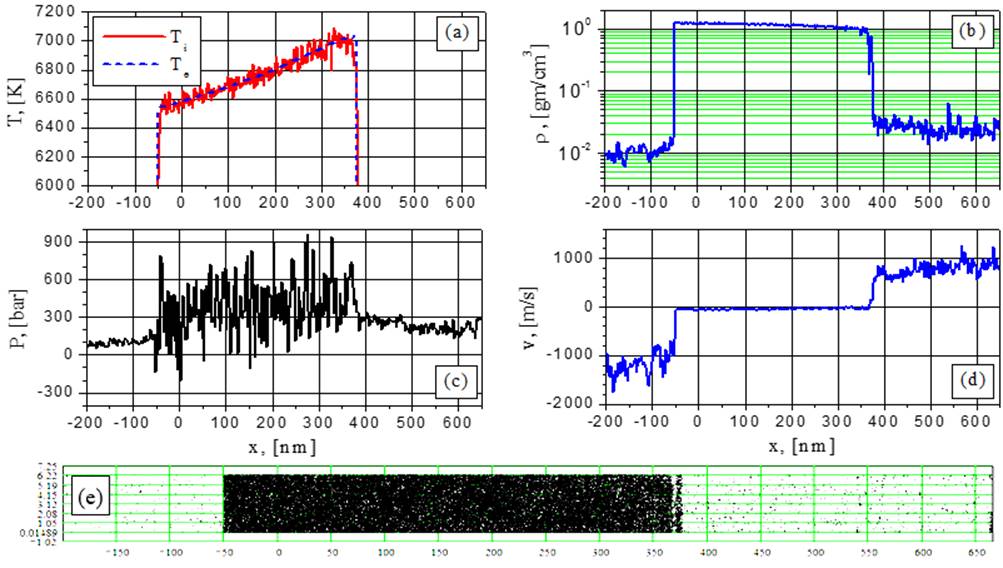
Fig.8. Electron and ion temperature (a), density (b), pressure (c), velocity (d) and particle (e) distributions for G=38.5 MW/cm2 at the time t = 1.447 ns: second explosive boiling.
|
|
|
|
|
|
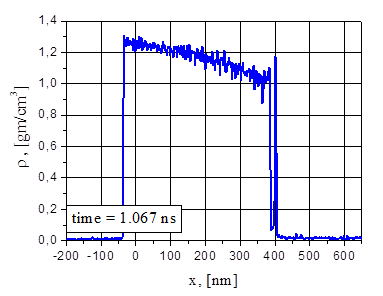
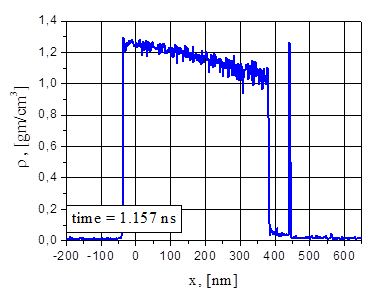
Fig.9. Evolution of the density distribution (linear scale, 1 ps time averaging) after the first explosion for G=38.5MW/cm2: growth of the fragment density.
Thick metal film G = 44 MW/cm2![]()
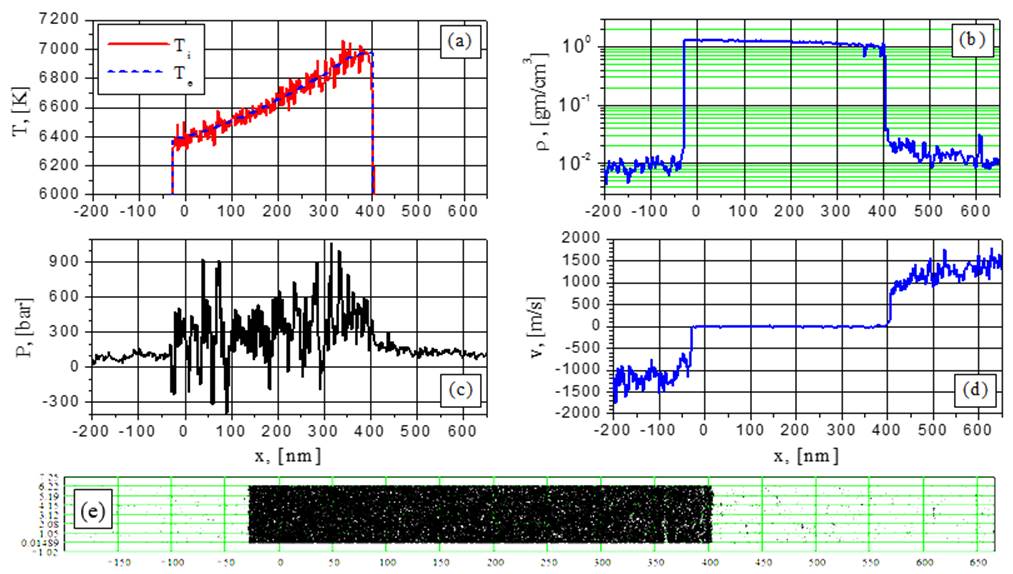
Fig.10. Electron and ion temperature (a), density (b), pressure (c), velocity (d) and particle (e) distributions for G=44MW/cm2 at the time t = 0.6762 ns: “competition” between the growing fluctuations.
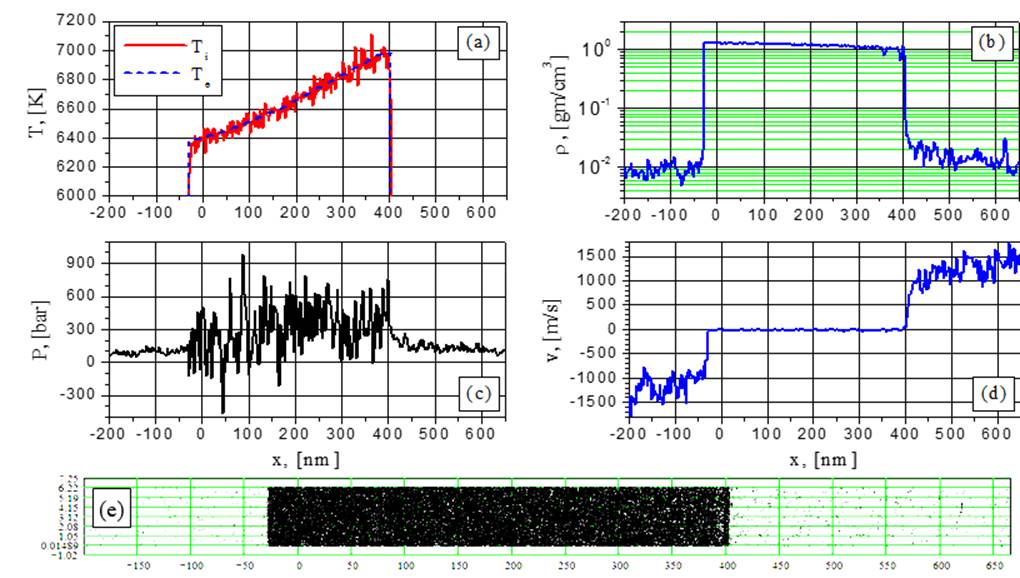
Fig.11. Electron and ion temperature (a), density (b), pressure (c), velocity (d) and particle (e) distributions for G=44MW/cm2 at the time t = 0.6842 ns: “competition” between the growing fluctuations.
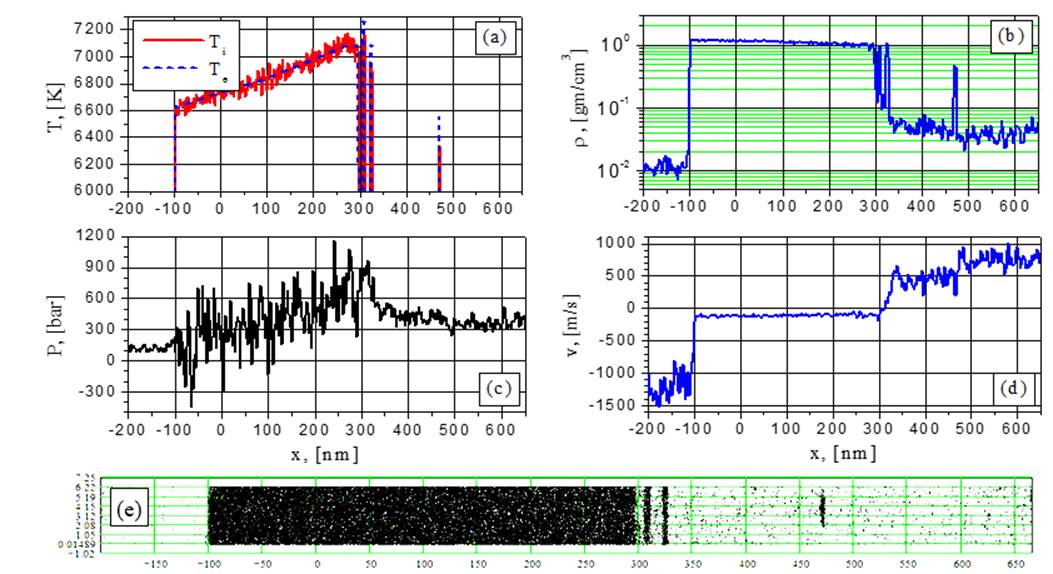
Fig.12. Electron and ion temperature (a), density (b), pressure (c), velocity (d) and particle (e) distributions for G=44MW/cm2 at the time t = 1.8252 ns: heating continues – several consecutive separated fragments.
Thick metal film G = 88 MW/cm2![]()
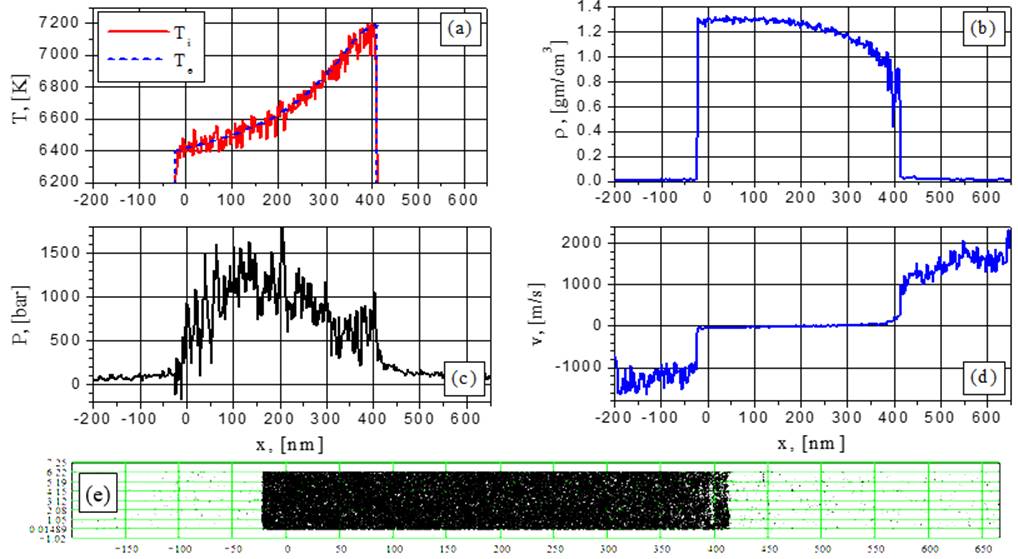
Fig.13. Electron and ion temperature (a), density (b), pressure (c), velocity (d) and particle (e) distributions for G=88MW/cm2 at the time t = 0.2252 ns: change from boiling to spinodal decomposition.
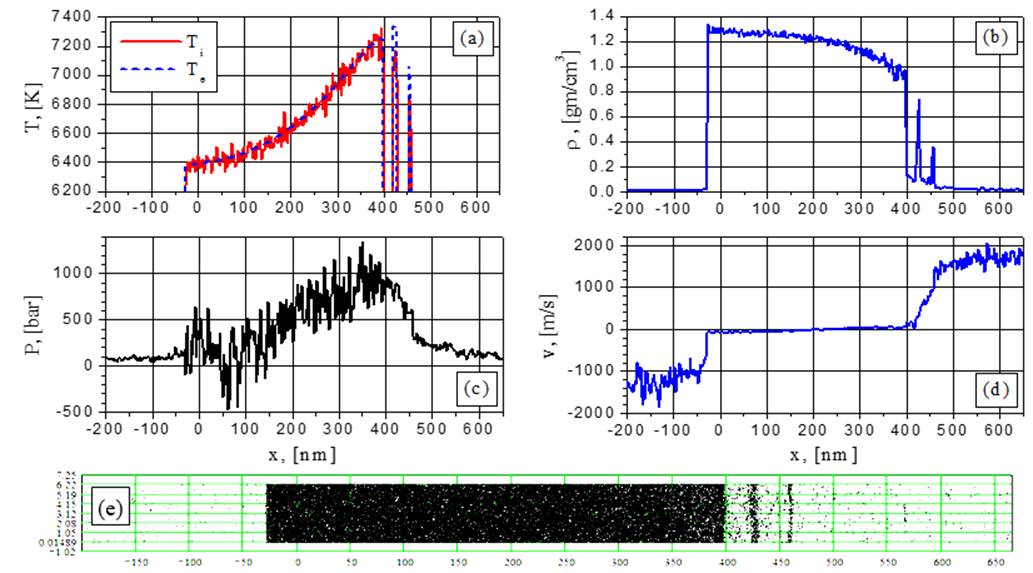
Fig.14. Electron and ion temperature (a), density (b), pressure (c), velocity (d) and particle (e) distributions for G=88MW/cm2 at the time t = 0.3152 ns: change from boiling to spinodal decomposition.
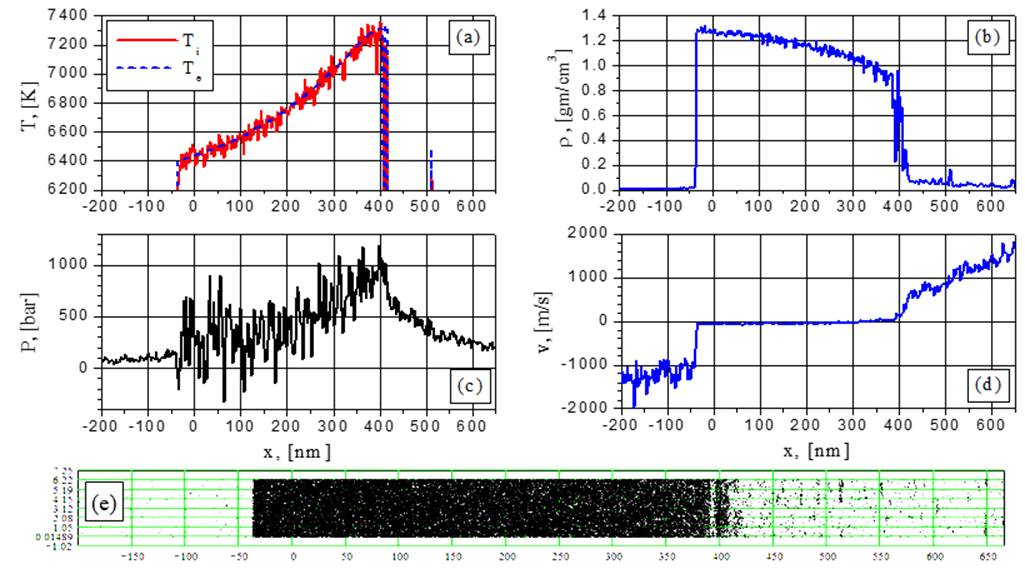
Fig.15. Electron and ion temperature (a), density (b), pressure (c), velocity (d) and particle (e) distributions for G=88MW/cm2 at the time t = 0.4552 ns: change from boiling to spinodal decomposition.
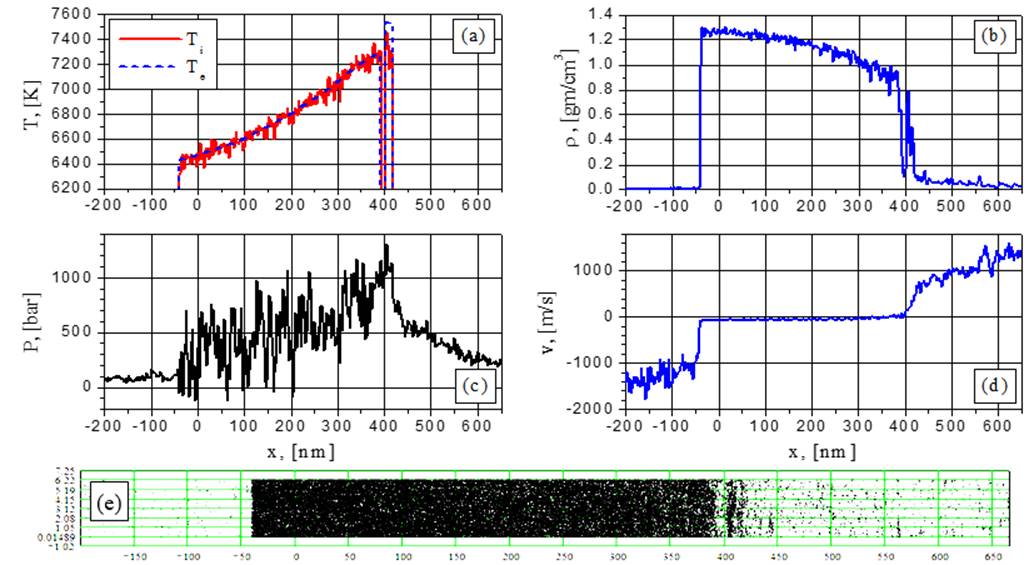
Fig.16. Electron and ion temperature (a), density (b), pressure (c), velocity (d) and particle (e) distributions for G=88MW/cm2 at the time t = 0.5052 ns: change from boiling to spinodal decomposition.
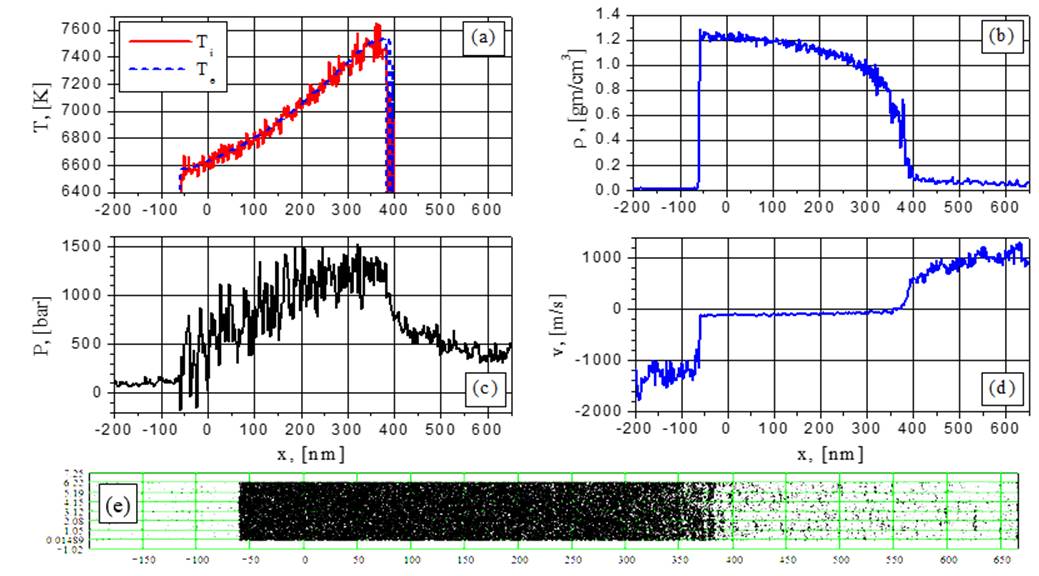
Fig.17. Electron and ion temperature (a), density (b), pressure (c), velocity (d) and particle (e) distributions for G=88MW/cm2 at the time t = 0.7302 ns: spinodal decomposition.
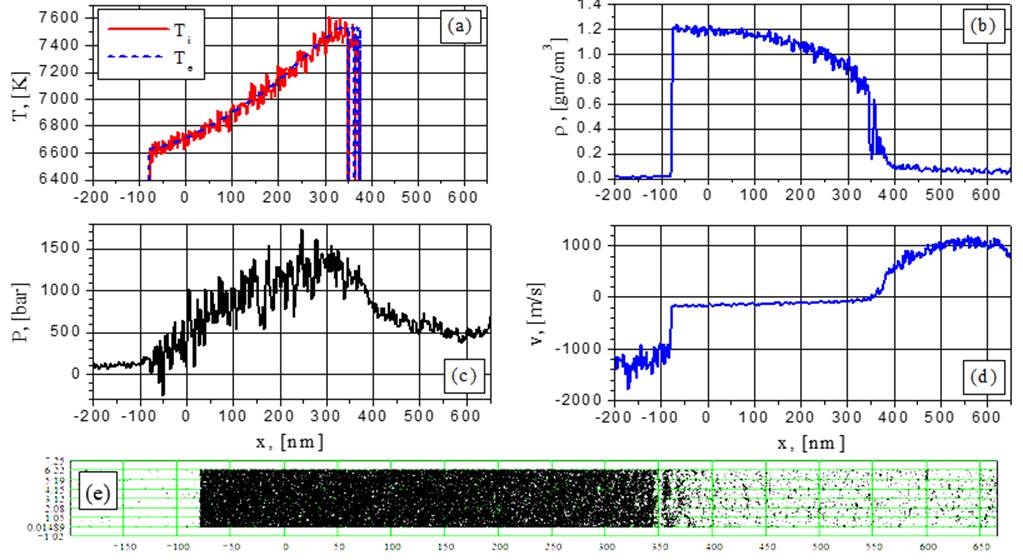
Fig.18. Electron and ion temperature (a), density (b), pressure (c), velocity (d) and particle (e) distributions for G=88MW/cm2 at the time t = 0.8602 ns: spinodal decomposition.
Thick metal film G = 154 MW/cm2![]()
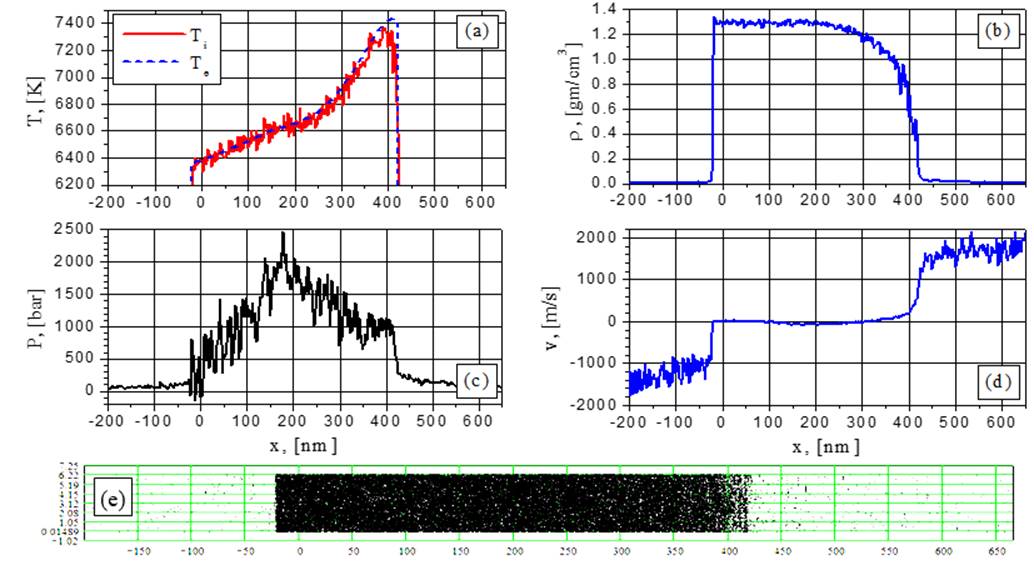
Fig.19. Electron and ion temperature (a), density (b), pressure (c), velocity (d) and particle (e) distributions for G=154 MW/cm2 at the time t = 0.1252 ns: spinodal decomposition without explosive boiling.
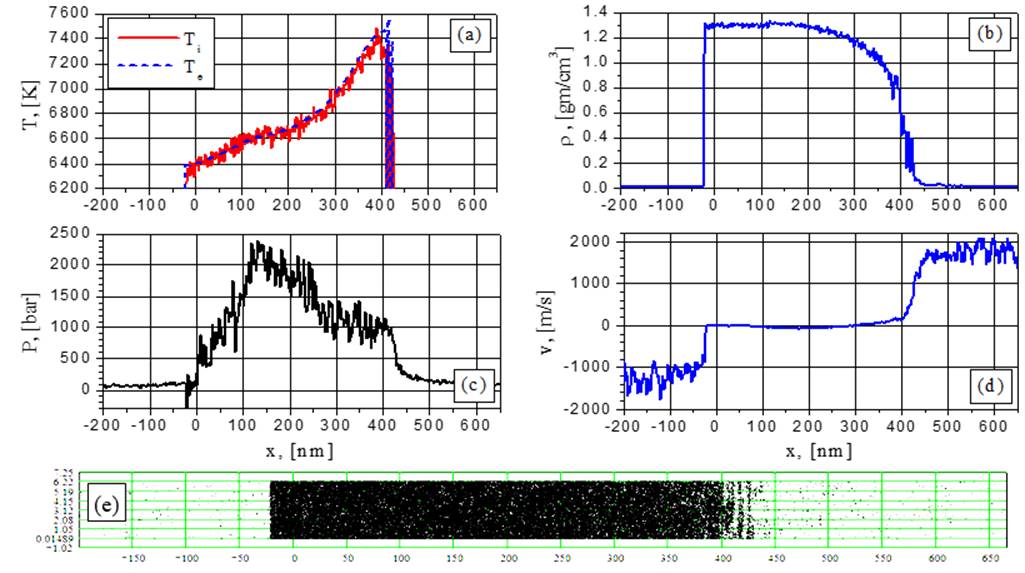
Fig.20. Electron and ion temperature (a), density (b), pressure (c), velocity (d) and particle (e) distributions for G=154MW/cm2 at the time t = 0.1402 ns: spinodal decomposition without explosive boiling.
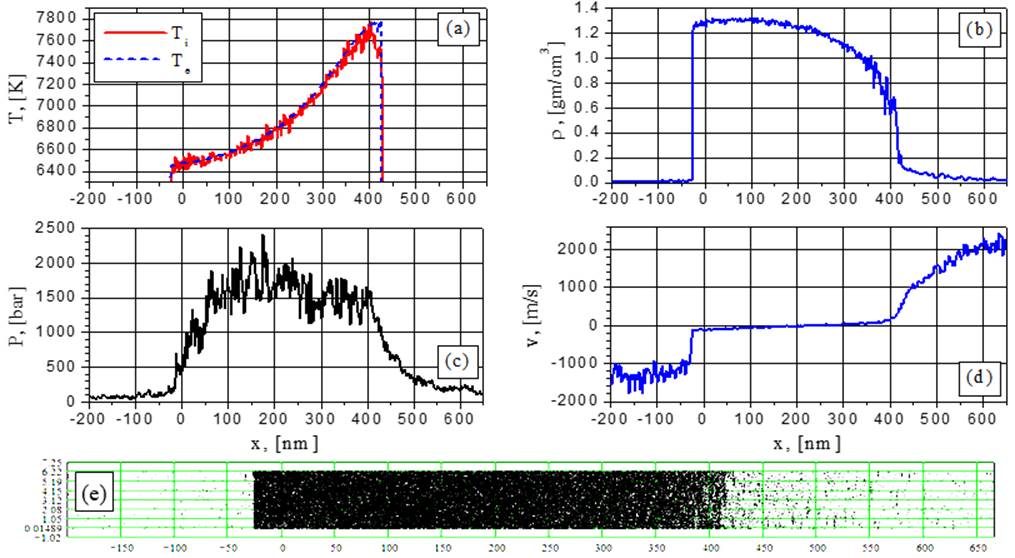
Fig.21. Electron and ion temperature (a), density (b), pressure (c), velocity (d) and particle (e) distributions for G=154MW/cm2 at the time t = 0.2202 ns: change from spinodal decomposition to supercritical ablation.
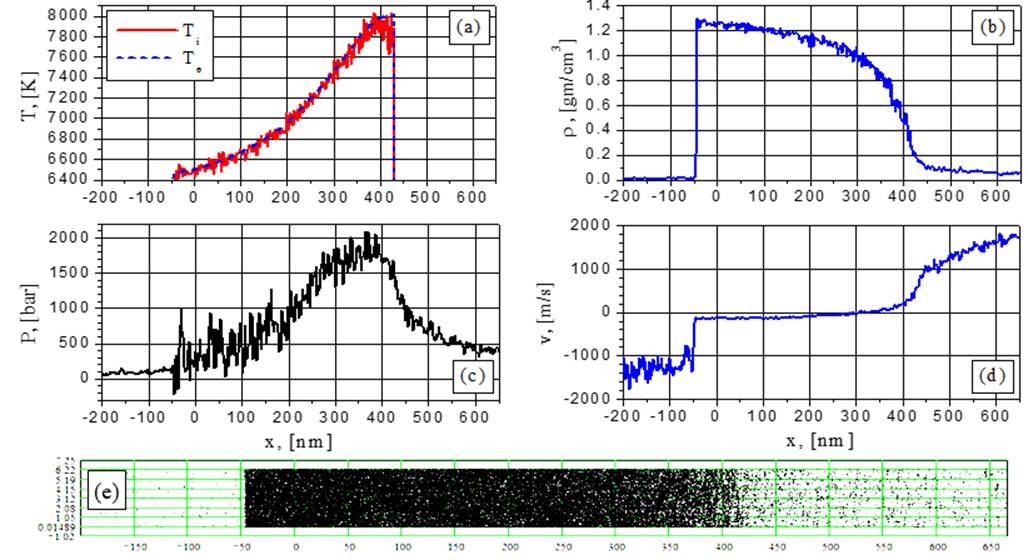
Fig.22. Electron and ion temperature (a), density (b), pressure (c), velocity (d) and particle (e) distributions for G=154MW/cm2 at the time t = 0.3752 ns: change from spinodal decomposition to supercritical ablation.
The Spinodal decomposition regime is also visible from Fig.19-20 (154 MW/cm2) at t=0,125ns and t=0,14ns while at later times (Figs. 21-22) this regime transforms to supercritical fluid expansion with density fluctuations diminishing at the right-hand side of the film. In comparison to the subcritical ablation case, the fluctuations become smoother (Figs.5-20). Even at the subcritical temperature values no explosive boiling effect is observed at G=154 MW/cm2 because of the large heating rate.
The Results of our modeling show that the explosive boiling effect is more pronounced at G= 38.5 MW/cm2 and 44 MW/cm2. At Fig.23 the pressure and temperature behavior is presented during the first explosive boiling which takes place in the interval 0,8-1,3ns after the intensity G= 38.5 MW/cm2 is switched on. The pressure and temperature curves during the third explosive boiling in the interval 1,35-1,7ns at the intensity G= 44 MW/cm2 are shown at Fig.24.
In Fig.23 the pressure curve up to the moment ![]() = 1,04 ns corresponds to the
vapor pressure Pvap in the vapor flow near the irradiated
surface which is lower than the recoil pressure Precoil ≥0.5Psatur(Ts)
where Ts denotes the irradiated surface temperature and Psatur
corresponds to the saturation pressure. At Ts=6830K the
saturated pressure Psatur =714 bar while the calculated
subsurface pressure in the film (which is in fact Precoil)
is about 370 bar. During explosive boiling Precoil grows
by the factor 1,65 (up to 610 bar) which is somewhat lower than saturated
pressure Psatur(Tm)=802 bar at Tm=6950K.
The temperature Tm corresponds to the subsurface temperature
maximum located before the explosion at the radiation penetration length
distance from the surface. The temperature jump in Fig.23b is due to displacement
of the observation point from the irradiated surface to the point
= 1,04 ns corresponds to the
vapor pressure Pvap in the vapor flow near the irradiated
surface which is lower than the recoil pressure Precoil ≥0.5Psatur(Ts)
where Ts denotes the irradiated surface temperature and Psatur
corresponds to the saturation pressure. At Ts=6830K the
saturated pressure Psatur =714 bar while the calculated
subsurface pressure in the film (which is in fact Precoil)
is about 370 bar. During explosive boiling Precoil grows
by the factor 1,65 (up to 610 bar) which is somewhat lower than saturated
pressure Psatur(Tm)=802 bar at Tm=6950K.
The temperature Tm corresponds to the subsurface temperature
maximum located before the explosion at the radiation penetration length
distance from the surface. The temperature jump in Fig.23b is due to displacement
of the observation point from the irradiated surface to the point ![]() at
at ![]() and it corresponds
approximately to the temperature difference (
and it corresponds
approximately to the temperature difference (![]() ) mentioned above.
) mentioned above.
For G=44 MW/cm2 behavior of pressure and temperature during explosive boiling is similar to the I=38.5 MW/cm2 case while P and T values are somewhat higher. In both cases growth time of pressure pulses is almost the same (20ps).
|
|
|
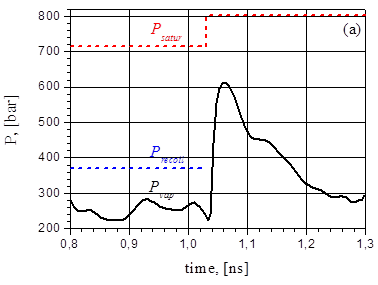
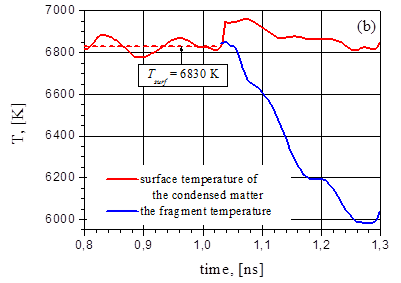
Fig.23. Pressure (a) and temperature (b) evolution at the surface of the bulk sample (red) and of the fragment (blue) for G=38.5MW/cm2.
|
|
|
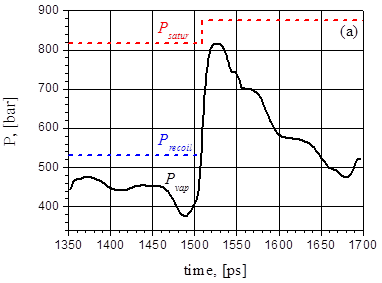
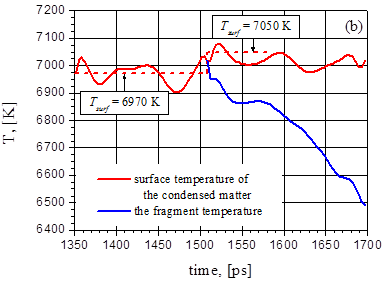
Fig.24. Pressure (a) and temperature (b) evolution at the surface of the bulk sample (red) and of the fragment (blue) for G= 44 MW/cm2.
It is interesting to note that in the experiment [14] approximately twofold shock wave pressure rise above the irradiated Al target was detected and interpreted as a transition from normal vaporization to phase explosion (explosive boiling). In this case, however, one should also take into account plasma formation effects which can also result in pressure rise above the target. The topic about the role of plasma under such conditions requires further analysis.
As it was already mentioned in the introduction, the problem of the subsurface superheating effect on the explosive boiling process in metals has not had an unambiguous answer until recently because of the high values of the thermal conductivity and absorption coefficients. One should keep in mind that in equations (6)-(7) and Fig.25 the laser radiation goes from the left. In the continuum approach the steady-state temperature distribution in irradiated sample is determined in the reference frame moving with the vaporization front (x = 0) by the equation:
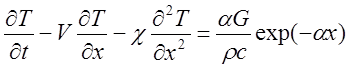 (6)
(6)
![]()
where the density r, heat capacity c, thermal diffusivity χ and absorption coefficient a are assumed to be constant for simplicity. Vaporization velocity V and heat of evaporation L depend on the surface temperature Ts.
From (6) it follows for the steady-state solution:
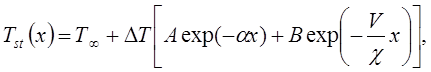 (7)
(7)
where ![]()
![]() (8)
(8)
The Energy conservation equation (8) follows directly from (6) and gives a relation between absorbed intensity G, vaporization velocity V and thermophysical parameters of the irradiated sample. Vaporization velocity depends on the surface temperature and Mach number (M) in the vapor flow at the outer side of the Knudsen layer [45]. In the case of M=1 for V one has:
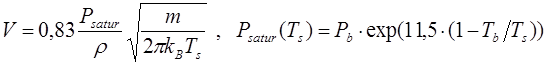 (9)
(9)
where Psatur – saturation pressure at the surface temperature Ts, Tb = 2792K is normal boiling temperature, Pb =1 bar, m – mass of the evaporated particles. In formula for Psatur properties of considered metal model are taken into account. For density and thermal diffusivity of heated matter the following values are used r =1 g/cm3, c =0,8 cm2/s и m=4,48∙10-23 g.
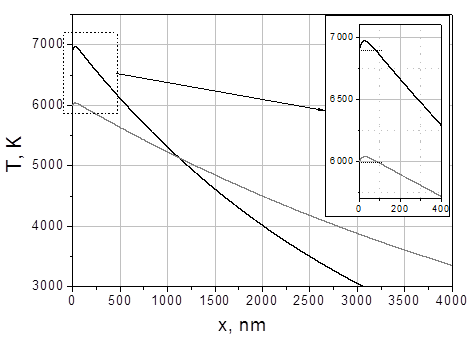
Fig.25. Temperature distributions T(z) for two intensities: G=19,5MW/cm2 (gray curve), G=38,5MW/cm2 (black curve). Radiation falls on the left.
Applicability limits of this simplified approach are also determined by the condition that the metastable liquid temperature must be lower than its superheating limit value because at the higher temperatures homogeneous superheated liquid state cannot exist. The limitation is more severe in the case of a relatively small absorption coefficient. The heat conductivity values practically prevent the realization of the steady-state surface evaporation regime. (7) This is caused by a big difference between the surface temperature Ts and the subsurface maximum temperature Tm where explosive (volume) boiling begins.
For metals usually c/V >>a-1 and the temperature difference Tm – Ts is small so that the model (6)-(7) is applicable for a wide range of the surface temperature Ts values which can be close to the superheating limit temperature Th or spinodal temperature Tsp. However, in this case another important question about the possible influence of the small difference Tm –Ts on the laser ablation process arises. It is supposed in [3] that despite the relatively small temperature difference repeating explosive boiling can occur while in refs. [23,25,26] this possibility is neglected. Our MD modeling results give a definite answer to this question.
Fig.26 shows the film temperature distribution (fluctuating curve) obtained from the MD calculation at I = 38,5J/cm2 and t = 1,02ns just before the first explosion boiling and the temperature curve from Fig.25 which have the same surface temperature Ts = 6900 K.
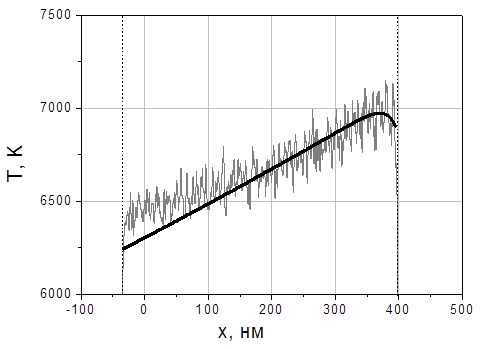
Fig.26. Analytical (smooth curve) and numeric (with fluctuations) temperature profiles in the quasi-stationary regime: before the explosive boiling begins. Radiation falls on the right.
The Difference between the curves at the rear (left) side of the film is due to its finite thickness in contrast to the half-space continuum model (6)-(7). The film thickness is comparable with the heat diffusion length c/V where for the considered model c =0,8cm2/s and vaporization front velocity V=2764cm/s in accordance with eqs. (8) and (9).
Despite the relatively small value of the subsurface temperature maximum Tm compared with the surface temperature Ts and very close proximity of Tm location to the surface one can see from the MD calculation results that explosive boiling process begins just in the Tm location. Even a very thin blown off fragment (about radiation penetration length 10 nm) is thick enough to provide the pressure pulse appearance described above (Fig.23,24). It is worth to note that the pressure pulses can be more pronounced in the case of subcritical metal-dielectric transition which was discussed in many papers with no sufficient experimental data up to now (see, e.g., [1,2,4-6,8,9,13] and references therein).
4. Concluding remarks
The Results of our modeling confirm the possibility to discriminate four different regimes in the nanosecond laser ablation of metals that are depend on the laser intensity: quasi-stationary surface evaporation, explosive (volume) boiling, spinodal decomposition and supercritical fluid expansion. The Laser ablation behavior in the various regimes can be clearly seen from the presented visualizations. The approach to analyze the nanosecond laser ablation in this article is different from other approaches (see, e.g. [7,25,26,29]) in the field of phase transition kinetics.
In particular, the explosive boiling regime for metals manifests itself in repeated subnanosecond recoil pressure pulses which become less pronounced in the spinodal decomposition regime at higher intensities and completely disappear in the supercritical fluid expansion case. Such laser-metal ablation behavior is described in [3] with a suggestion to use it for an experimental determination of the metal critical pressure.
One should keep in mind that the pronounced explosive boiling occurs close to the superheating limit temperature where many vapor bubbles appear almost simultaneously because of unstable density fluctuations. In this limit widely used nucleation theory [25-30] is not applicable because of the appearance of vapor bubbles which cannot be considered as independent or even as spherical if the liquid temperature depends on space. The Simultaneous appearance of many unstable (growing) density fluctuations at the superheating limit temperature of metastable liquid results in the effective heat capacity growth of the liquid just before the explosive boiling occurs. The Combination of MD and continual approaches make it possible to investigate such singularities in superheated liquids [46].
The Vapor phase formation is clearly visible from the presented visualizations, which show that the flat vapor cavity appears near Th instead of separate vapor bubbles and vaporization in to the cavity leads to explosive (subnanosecond) pressure rise above the preceding recoil pressure level. It is evident that the separate pressure bubbles cannot give such pressure pulses so that the interaction between the bubbles is crucial for the determination of the explosive boiling pressure behavior.
In our model of liquid Al at lower intensities G < 35 MW/cm2 the surface evaporation process is observed for many nanoseconds after the intensity is switched on while at G = 38,5 MW/cm2 and 44 MW/cm2 the first bursts of explosive boiling occur at the moments t = 1,04 ns and 0,71 ns respectively. These explosions are followed by other several repeated events with subnanosecond intervals. The intervals between two successive explosions are not constant because of the temperature rise, which is due to the continuous radiation heating and fluctuation initiations of the process.
Recoil pressure pulsation due to explosive boiling can be used as a marker of approaching critical parameters values in irradiated sample while ablation regime with critical pressure and temperature values have no such distinctive manifestations. It is probable also to monitor flying fragments movement during explosive boiling process using optical interference effects similar to those observed in [47].
The Recoil pressure pulsation caused by an explosive boiling regime can be used as a marker of approaching values of critical parameters in an irradiated sample while ablation regime with critical pressure and temperature values have no such distinctive manifestations. It is also probable to monitor movements of the flying away fragments during the explosive boiling process using optical interference effects similar to those observed in [47].
Acknowledgments
This work was financially supported by the Russian Science Foundation (project code 15-11-30039).
References
[1] Batanov V.A., Bunkin F.V., Prokhorov A.M., Fedorov V.B. Evaporation of metallic targets caused by intense optical radiation. Sov. Phys. JETP 36, 311 (1973). ЖЭТФ 63, 586 (1972).
[2] Karapetjan R.V., Samohin A.A. Vlijanie prosvetlenija na rezhim razvitogo isparenija metallov pod dejstviem opticheskogo izluchenija [Effect of illumination on the mode of developed evaporation of metals under the influence of optical radiation]. Sov. J. Quantum Electron., 4, 9, 1141 (1975)
[3] Samokhin A.A. Some aspects of the intense evaporation of condensed media by laser radiation. Sov. J. Quantum Electron., 4, 1144 (1975). Квантовая электроника 1, 2056, (1974).
[4] Zavecz T.E., Saifi M.A., Noits M., Metal reflectivity under high-intensity optical radiation. Appl. Phys. Lett. 26, 165 (1975).
[5] Samokhin A.A., First-order phase transitions induced by laser radiation in absorbing condensed matter. Proc. Institute of General Physics (USSR: Academy of Sciences), 13, p.1 (1988). Труды ИОФ РАН, 13, 3 (1988)
[6] Yoo J.H., Jeong S.H., Greif R., Russo R.E. Explosive change in crater properties during high power nanosecond laser ablation of silicon. Journal of Applied Physics 88, 1638 (2000)
[7] Bulgakova N.M., Bulgakov A.V. Pulsed laser ablation of solids: transition from normal vaporization to phase explosion. Appl. Phys. A, 73,199 (2001)
[8] Lu Q., Mao S., Mao X., Russo R. Delayed phase explosion during high-power nanosecond laser ablation of silicon. Appl. Phys. Lett., 80, 3072 (2002)
[9] Andreev S.N., Mazhukin V.I., Nikiforova N.M., Samokhin A.A., On possible manifestations of the induced transparency during laser evaporation of metals. Quantum Electron., 33, 771 (2003)
[10] Garrison B.J., Itina T.E., Zhigilei L.V., Limit of overheating and the threshold behaviour in laser ablation. Phys. Rev. B, 68, 041501 (2003)
[11] Ivanov D.S., Zhigilei L.V., Combined atomistic-continuum modeling of short-pulse laser melting and disintegration of metal films. Phys. Rev.B, 68, 064114 (2003)
[12] Pakhomov A.V., Thompson M.S., Gregory D.A. Laser-induced phase explosions in lead, tin and other elements: microsecond regime and UV emission. J. Phys. D: Appl. Phys. 36 2067 (2003)
[13] Porneala C., Willis D.A. Effect of the dielectric transition on laser-induced phase explosion in metals. Int. J. Heat Mass Transfer, 49, 1928 (2006)
[14] Porneala C., Willis D.A. Time-resolved dynamics of nanosecond laser-induced phase explosion. J. Phys. D: Appl. Phys., 42, 155503 (2009)
[15] Zhakhovskii V.V., Inogamov N.A., YPetrov u.V., Ashitkov S.I., Nishihara K. Two temperature relaxation and melting after absorption of femtosecond laser pulse. Appl. Surf. Sci., 255, 9592 (2009)
[16] Mazhukin V.I., Mazhukin V.A., Koroleva O.N. Optical properties of electron Fermi-gas of metals at arbitrary temperature and frequency. Laser Physics. 19, 1179 – 1186 (2009)
[17] Ionin A.A., Kudryashov S.I., Seleznev L.V., Sinitsyn D.V. Nonlinear regime of the excitation of a surface electromagnetic wave on the silicon surface by an intense femtosecond laser pulse. JETP Lett. 94, 753 (2011)
[18] Samokhin A.A., Il’ichev N.N., Klimentov S.M., Pivovarov P.A. Photoacoustic and laser-induced evaporation effects in liquids. Appl. Phys. B, 105, 551 (2011)
[19] Brown W.M., Wang P., Plimpton S.J., Tharrington A.N. Implementing molecular dynamics on hybrid high performance computers – short range forces. Comp. Phys. Commun., 182, 898 (2011)
[20] Mazhukin V.I. Kinetics and Dynamics of Phase Transformations in Metals Under Action of Ultra-Short High-Power Laser Pulses. Chapter 8, pp.219 -276. In “Laser Pulses – Theory, Technology, and Applications”, InTech. Ed. by I. Peshko., P 544, (2012).
[21] Ionin A.A., Kudryashov S.I., Seleznev L.V., Sinitsyn D.V., Bunkin A.F., Lednev V.N., Pershin S.M. Thermal melting and ablation of silicon by femtosecond laser radiation. JETP, 116, 347-362 (2013).
[22] Autrique D., Clair G., L'Hermite D., Alexiades V., Bogaerts A. The role of mass removal mechanisms in the onset of ns-laser induced plasma formation. J. Appl. Phys. 114, 023301 (2013)
[23] Adrian H. A. Lutey An improved model for nanosecond pulsed laser ablation of metals. J.of Appl. Phys. 114, 083108 (2013)
[24] Wu C., Zhigilei L.V. Microscopic mechanisms of laser spallation and ablation of metal targets from large-scale molecular dynamics simulations. Appl. Phys. A, 114, 11-32 (2014)
[25] Jiang M.Q., Wei Y.P., Wilde G., Dai L.H. Explosive boiling of a metallic glass superheated by nanosecond pulse laser ablation. Appl. Phys. Let. 106, 021904 (1-6), (2015).
[26] Miotello A., Kelly R. Critical assessment of thermal models for laser sputtering at high fluences. Appl. Phys. Lett. 67, 3535 (1995).
[27] Landau L.D., Lifshic E.M. Statisticheskaja fizika [Statistical physics]. Part 1, 4th Edition. M .: Nauka, 1995. ("Theoretical Physics", Volume V)
[28] Skripov V.P. Metastabil'naja zhidkost' [Metastable liquid]. Moscow: Science, 1972. 312 p.
[29] Vogel A., Venugopalan V. Mechanisms of Pulsed Laser Ablation of Biological Tissues. Chem. Rev. 2003, 103, 577−644
[30] Autrique D., Clair G., L'Hermite D., Alexiades V., Bogaerts A., Rethfeld B. The role of mass removal mechanisms in the onset of ns-laser induced plasma formation. J. Appl. Phys. 114, 023301 (2013)
[31] Mazhukin V.I., Samokhin A.A., Shapranov A.V., Ivochkin A.Yu. Mathematical modeling of non-equilibrium phase transition in rapidly heated thin liquid film. Mathematica Montisnigri, 27, 65 (2013)
[32] Mazhukin V.I., Shapranov A.V., Samohin A.A., Ivochkin A.Ju. Molekuljarno-dinamicheskoe modelirovanie neravnovesnogo perehoda zhidkost'-par pri subnanosekundnom odnorodnom nagreve tonkoj plenki [Molecular dynamics simulation of nonequilibrium transition liquid-vapor at sub-nanosecond uniform heating of a thin film]. Applied physics and mathematics. no. 5, 3-17 (2013) p. 15, fig. 66
[33] Mazhukin V.I., Samokhin A.A., Shapranov A.V., Demin M.M. Modeling of thin film explosive boiling - surface evaporation and electron thermal conductivity effect. Mater. Res. Express 2 016402 (2015)
[34] Mazhukin V.I., Samokhin A.A., Shapranov A.V., Ivochkin A.Yu. Modelirovanie vzryvnogo vskipanija tonkoy plenki pri odnorodnom subnanosekundnom nagreve. Matematicheskoe Modelirovanie, 26, 125 (2014) (in Russian)
[35] Mazhukin V.I., Shapranov A.V., Samokhin A.A., Mazhukin A.V., Koroleva O.N. Visualization and analysis of the results of molecular-dynamic modeling of intensive evaporation of liquid in the near-critical region. Scientific Visualization, 6 (4) pp.72-95 (2014)
[36] Mazhukin V.I., Demin M.M., Shapranov A.V. Continuum modeling of pulsed laser fragmentation ja the metal with the homogeneous melting. 12th Int. Conf. On Laser Ablation (Cola 2013) Book of abstracts, 151 (2013)
[37] Mazhukin V.I., Samokhin A.A., Shapranov A.V., Ivochkin A.Yu. Modeling of thin film explosive boiling – surface evaporation effect. 12th Int. Conf. On Laser Ablation (Cola 2013) Book of abstracts, 152 (2013)
[38] Mazhukin V.I., Samokhin A.A., Shapranov A.V., Demin M.M. Vzryvnoe vskipanie metallov pod dejstviem nanosekundnogo lazernogo impul'sa. Kvantovaja Elektronika, 44 283 (2014) (in Russian)
[39] Mazhukin V.I., Samokhin A.A., Demin M.M., Shapranov A.V. Modeling of nanosecond laser vaporization and explosive boiling of metals. Mathem. Montisnigri. 29, 68 – 90. (2014).
[40] Mazhukin V.I., Samokhin A.A., Shapranov A.V., Demin M.M., Pivovarov P.A. On Different Regimes of Condensed Matter Ablation Depending on Intensity and Duration of Absorbed Electromagnetic Pulses. PIERS Proceedings, 2418 - 2421, July 6-9, Prague, 2015
[41] Kaganov M.I., Lifshic I.M., Tanatarov L.V. Relaksacija mezhdu jelektronami i kristallicheskoj reshetkoj [Relaxation between electrons and lattice]. Journal of Experimental and Theoretical Physics. 31: 2(8)/232-237 (1956)
[42] Kaganov M.I., Lifshic I.M., Tanatarov L.V. K teorii radiacionnyh izmenenij v metallah [On the theory of radiation changes in metals]. Atomnaja jenergija. 6/391-402 (1959)
[43] Anisimov S.I., Kapeliovich B.L., Perelman T.L. Electron emission from metal surfaces exposed to ultrashort laser pulses. Sov. Phys. JETP 39(2), 375-377 (1974) ЖЭТФ, 66 (2), 776-779 (1974)
[44] Gordeev G.V. Nizkochastotnye kolebanija plazmy [Low-frequency plasma oscillations]. Journal of Experimental and Theoretical Physics. 1(7) 19-23 (1954)
[45] Mazhukin V.I., Samokhin A.A. Boundary conditions for gas-dynamical modeling of evaporation processes. Mathem. Montisnigri. 24, 8-17 (2012)
[46] Samokhin A.A., Pivovarov P.A. On spinodal manifestation during fast heating and evaporation of thin liquid film. Mathem. Montisnigri. 33, 125- 128 (2015)
[47] Homkin A.L., Shumihin A.S. Kriticheskie tochki parov metallov [Critical point metal vapors]. Journal of Experimental and Theoretical Physics, 148, 3(9), 597 (2015)
[48] Sokolowski-Tinten K., Bialkowski J., Cavalleri A., von der Linde D., Oparin A., Meyer-ter-Vehn J., Anisimov S.I. Transient States of Matter during Short Pulse Laser Ablation. Phys. Rev. Lett. 81, 224 (1998)