METHODS FOR CREATION AND ANALYSIS OF GENERALIZED DIGITAL IMAGES AND THEIR APPLICATION IN ANTHROPOLOGY
A.B. Savinetsky, Sh.U. Nizametdinov, G.V. Syroezhkin, A.E. Safiullin
National Research Nuclear University MEPhI (Moscow Engineering Physics Institute), Moscow, Russian Federation
Contents
2. Available software overview
2.4. Comparison of software for creation and analysis of generalized portrait
3. Preparation of the image samples to collating and analysis
3.1. Brightness adjustment of the image samples
3.3. Image comparison and analysis
4. Discussion and analysis of the results
4.1. Analysis of the results of the two points Galton’s method
4.2. Analysis of the results of the three points Galton’s method
4.3. Analysis of the results of the method with tightening carcass
4.4. Analysis of the results of statistical processing
Abstract
This work presents the technologies and software system specially developed for morphological research of large sets of human face images. Morphological research is based on creation of generalized portrait of the anthropological sample, cluster analysis of face segments and finding similarities and differences between samples. The program system is used in scientific research in Anuchin Research Institute and Museum of Anthropology, Lomonosov Moscow State University.
Key words: generalized portrait, standard deviation, human face, classification, cluster analysis.
1. Introduction
Morphological method of human body research plays a leading role in many fields of anthropology. Measuring and verbal descriptive methods are often used in somatology.
The main disadvantage of a verbal descriptive method is that there are limitations in use of statistical methods. The generalized parameter of descriptive method - the average score - has a significant amount of uncertainty, whereby other researchers lose a significant part of the information.
Description by the language of numbers also has its disadvantages. An experienced morphologist, having only numerical and tabular characteristics, cannot clearly distinguish the butterfly wing of a bird's one. To do this, you must have a visual image of the object. Therefore, various visual methods are widely used in anthropology (drawings, pictures, 3D copies etc.).
The method of generalized portrait is widely used as an educational tool in the scientific illustrative term and simplifies such tasks as ethno-territorial, sex and age variability.
The software that is capable to create a generalized portrait already exists, but its features are not sufficient for fast and qualitative work. In addition, anthropologists noted that interface of such software is inconvenient.
Thus, it became necessary to create such a software that would help researchers-anthropologists to create generalized portraits preserving the original statistical characteristics of the sample elements, and to carry out further analysis of the resulting portraits.
2. Available software overview
At present, the research of the human face features increasingly uses computer graphics technology, software for image editing. Such software allow operating original photo and creating new versions using the original photo as a basis, allowing the researcher to synthesize the different variations of the human face, opening up new opportunities for researchers.
The main methods of creating a generalized portrait are the Francis Galton’s method [1, 4] and David Perrett’s method [3]. Galton's method lies in the fact that the images are combined by two reference points - pupils of the eyes. Images increase and decrease to the average inter-pupillary distance and then overlap each other. Perrett’s method is based on combining images and using a large number of points - the carcass. Images change together to the middle carcass and overlap each other.
2.1. FantaMorph
«FantaMorph» [4] was used in the research "Beauty Check” by German psychologists Christoph Brown, Martin Gryundel, Klaus Marberger and Christoph Sherber [5]. Psychologists have set themselves two goals. At first, they wanted to find out what beauty is and what parameters it is defined by. Secondly, they wanted to identify the social consequences of attraction - how human appearance influences the attitude of others. Psychologists have created a generalized portrait using 500 reference points that was similar to the Perrett’s method (Fig. 1).
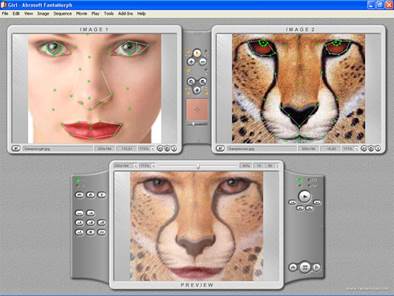
Fig. 1. «Fanta Morph» - main window
2.2. BMPtone
«BMPtone» [6] allows to create generalized portraits of different anthropological objects from digital images using Galton’s method, as well as to carry out high-precision measurements of digital images.
The program works only with BMP images, and has a limited set of functions. The program's interface is shown in Fig. 2.
|
a) |
b) |

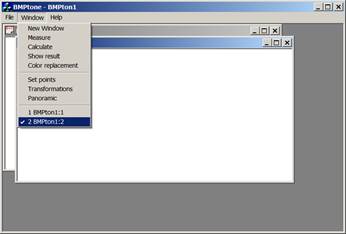
Fig. 2. Main windows of «BMPTone»:
a – window for choosing files for combining; b – main window
2.3. Adobe Photoshop
«Adobe Photoshop» [1] is designed to work with digital images. With its help, you can create a generalized portrait of a few photos. However, the creation of such a portrait takes a lot of time, because you have to process each image individually. In addition, there is an error in the calculations and a limit of 6 pictures (Fig. 3).
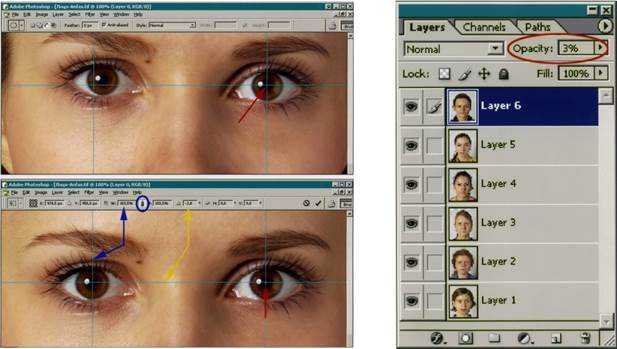
Fig. 3. Aligning reference points and setting transparency of the layers in the program «Adobe Photoshop»
This restriction is directly related to the process of combining the images. Process consists of a sequential manual transforming of each photo and overlapping it on another one, by matching pupils. «Adobe Photoshop» features allows you to overlay layers on each other with a certain transparency – from 1 to 100 percent in increments of 1 percent. To achieve uniform overlay, you need to set the following coefficients of the transparency: 100, 50, 25, 12, 6 and 3 percent. Seventh layer with the transparency coefficient of 1 or 2 percent is not significant and visible to the eye. Generalized portrait of 6 layers is the same as the one of 7 layers. Therefore, there is a limitation for the simultaneous collation of several images equal to the number of layers, namely 6.
2.4. Comparison of software for creation and analysis of generalized portrait
Features of the developed application and the above-described software are presented in Table 1. Pluses are for feature that is included into the program; minuses are for absenting. The criteria for convenience and speed were evaluated by users-anthropologists in the National Research Institute and the Museum of Anthropology.
Table 1. Comparison analysis of software for creating a generalized portrait
|
Software
Feature |
BMPtone |
Adobe Photoshop |
FantaMorph |
Developed software |
|
Processing of individual image |
|
+ |
|
+ |
|
Combining all the images at once |
+ |
|
|
+ |
|
Saving projects |
|
+ |
|
+ |
|
Measuring tool |
+ |
+ |
|
+ |
|
Analyzing tool |
|
|
|
+ |
|
Support of different image extensions |
|
+ |
|
+ |
|
Brightness adjusting (automatically/manually) |
|
|
|
+/ |
|
Convenience of creating a generalized portrait of a ten point scale |
3 |
5 |
6 |
8 |
|
Speed of creating a generalized portrait of a ten point scale |
5 |
3 |
6 |
10 |
Experience of using «BMPtone» at the NRI and Museum of Anthropology has shown, that in spite of the correct approach to the image collating by indicating of reference points, the program does not have sufficient user-friendly interface. In the program, there is no possibility of saving and further processing of created projects. The process becomes more difficult because of the changing extension to BMP for every element of the sample.
«Adobe Photoshop» is difficult to use; the creation of a generalized portrait takes a long time - about 7 hours for a sample of 24 pictures. Despite the fact that the program «FantaMorph» is convenient and easy to use, its functionality is capable of creating only a generalized portrait by Perrett’s method. Moreover, to make such a portrait, is necessary to cut out a frame from the middle of the resulting video because «FantaMorph» creates not generalized portrait, but a "flow" video (analogue to morphing images) [4]. Also, the program has no analyzing features.
After taking into account the relevant issues in existing programs, it was decided to implement an application that can fix these flaws. It must have all the tools to create a generalized portrait, graphic user-friendly interface and the ability to save projects for theirs future use. The application should be focused to the anthropological problems and be able to measure and interpret the resulting portrait. Support of the main common image extensions and the ability to simultaneously combining a large number of photos are necessary.
3. Preparation of the image samples to collating and analysis
Before the actual combining of the images, you must first remove all the defects, calculate the relative coefficients and transform all of them.
When preparing a series of images to merge with the carcass or by Galton’s method, brightness adjustments should be made to each element in the sample.
3.1. Brightness adjustment of the image samples
When you create a generalized portrait, you often have to deal with pictures of different brightness. Situations that may cause this to happen:
¾ with every new portrait filmed, battery charge in a flash of the camera decreases and each subsequent picture becomes darker;
¾ the picture is taken outdoors, and with each frame the sun changes its position, which affects the brightness of the image;
¾ generalized portrait is created from two or more samples, captured in different places with different lighting.
In modern graphics editors the operation of brightness increasing equals to “whitening” and operation of brightness decreasing equals to Modern graphics editors surgery can change the brightness is reduced to "whiten" its increase to the "blackening" when it is “decreasing”. Converting brightness using K parameter transforms triplet (R, G, B) in to triplet (R + K, G + K, B + K). This violates the ratio between red, green and blue channels and leads to a change the hue.
Brightness conversion in the LAB model is the addition/subtraction of the L - lightness channel value with a constant L0 = L + K. When you change the lightness, the hue varies greatly. This disadvantage limits the use of the LAB model in precise editing of the digital images.
The above algorithms have a common disadvantage - the ability to go beyond the color space. When creating a generalized portrait such a disadvantage is irrelevant, as the average value between the darkest pixel and the brightest one will never go out of range.
When adding a constant in the algorithm that uses the RGB model, the "whitening" of pixels occurs. However, by collating the images, the brightness of the final portrait is automatically averaged by the same algorithm, and it turns out that such an algorithm does not change the picture and it is useless in the case of the generalized portrait.
The same constant as in RGB model’s algorithm is added/subtracted in the algorithm that uses the YUV model, so the differences between the portraits are not visible to the human eye.
The advantage of the LAB model is that it, in contrast to the HSB color model, corresponds to the features of the color perception by the human eye and it is convenient to operate with brightness changes because it is given as an entire coordinate. The histogram of the generalized portrait in the LAB model is more centered than others, which proves a better perception by the human eye [7].
Thus, based on the experiments and the different structures of the color spaces, the basic algorithm of the program includes the brightness adjustment by L channel of the LAB model.
3.2. Tightening carcass
The “rubber-sheeting” method is one of the ways of image transformation. It is used in cartography for processing images obtained from satellites and aircrafts, and allows correcting errors arising at the boundaries between several images for seamless splicing [8]. Based on the method of "rubber-sheeting" and Delaunay triangulation method [9], an algorithm that uniquely transforms images has been developed.
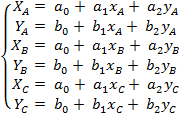
It is supposed to use the affine transformation (polynomial of the first degree) in the method of "rubber-sheeting" [9]:
![]()
![]() ,
,
here X,Y — the desired coordinates of each pixel of the created image; x,y —coordinates of the given pixel of the original image; a,b — coordinate communication parameters.
In order not to solve a system of equations with six unknowns:
an algorithm for transforming a triangle in which each of its interior point (O) is uniquely determined by two values was developed:
- The ratio of the segments (AD to DB) of one of the sides (AB), which is divided by the beam (CD), that was held through the point (O) of the opposite angle (C).
- The ratio of the beam segments (CO to OD), on which beam is divided by the point (O).
Thus, firstly, these two ratios are calculated in original triangle. Secondly, coordinates for the resulting triangle are calculated (Fig. 4).
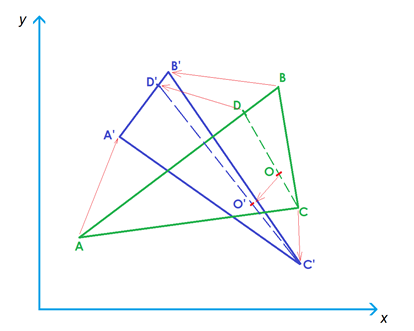
Fig. 4. Triangle transformation
The uniqueness in the triangle transformation is carried through equity of the following equations:
![]()
![]()
Point coordinates are calculated by the following formulas:
![]()
![]()
![]()
![]()
Stages of image processing
At one of the selected images user marks a point (Fig. 5). Then the automatic triangulation is performed (Fig. 6); also user can manually mark each triangle (Fig. 5). Dividing the image into the network of triangles is necessary for ensure that each pixel has its reference points - the vertices of the triangles. For tightening triangle shape is the most suitable shape as a triangle is the only one where the shortest distance between the vertices is not held inside the shape, but the perimeter. After triangulation it is necessary to save finished carcass to the file for its later use during the collating.
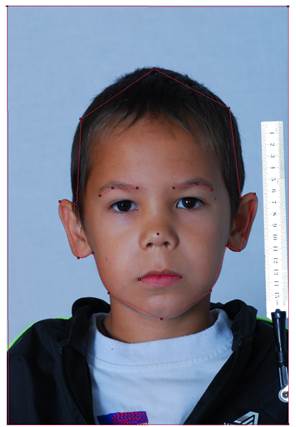
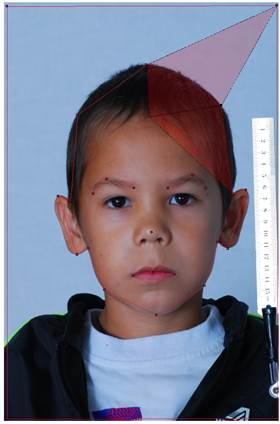
Fig. 5. Image in the window of the program during creating of the carcass
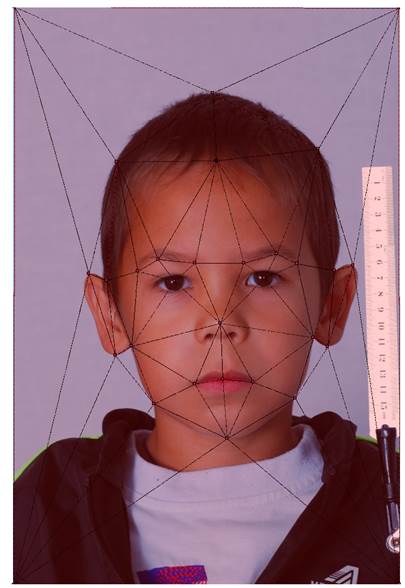
Fig. 6. Prepared carcass
Based on the carcass established, user prepares the rest of the images, using marked points, lines and contours in the original carcass (Fig. 7).
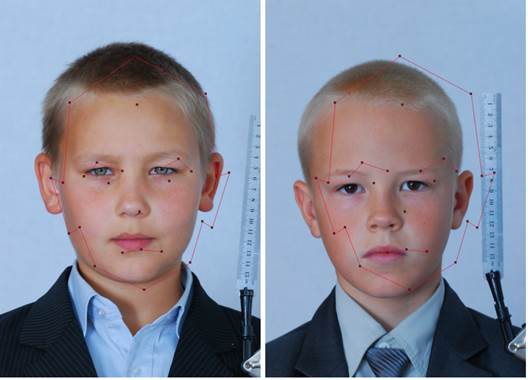
Fig. 7. Images with dots. Dots are placed as on the carcass
Moving a single point or set of points can be done by the tool “Drag and Drop”. The result is shown in Fig. 8.
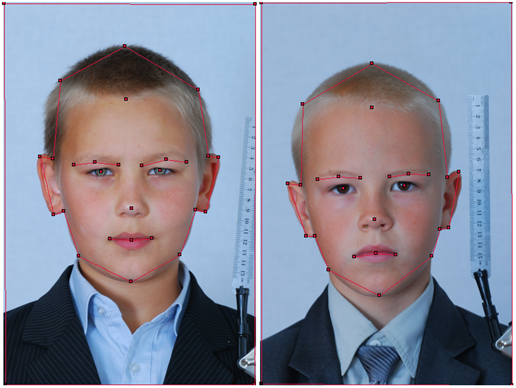
Fig. 8. Images with already placed points
To get generalized images corresponding to the classical approach of Galton, special methods for cases of two and three reference points were developed.
Stages of merging images by two points
1. The image is rotated in the way that the centers of the pupils are placed horizontally;
2. The image is stretched or narrowed relative to the average value of the inter-pupillary distance;
3. The image is cropped to the minimum width and height;
4. The resulting images overlap each other by combining centers of the pupils. Pixels’ color values of the resulting image are equal to the average color value of pixels of source images (Fig. 9).
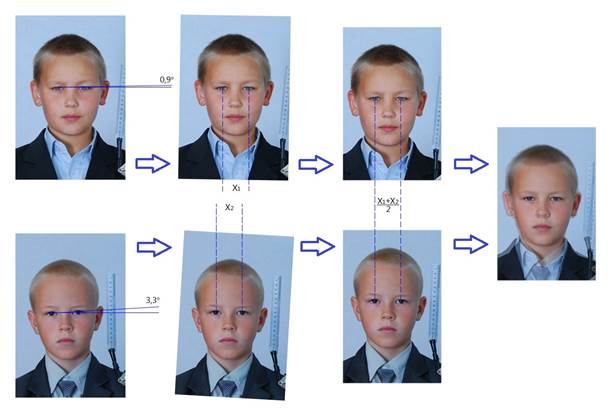
Fig. 9. Stages of the image conversion for the two points method
Stages of merging images by three points
The main stages of images’ merging in the two points algorithm are the same as in the three points one except for one step. Besides changing the size concerning to the value of the inter-pupillary distance, image also stretches or narrows according to the distance between the inter-pupillary line and third point on the mouth line to its average value (Fig. 10).
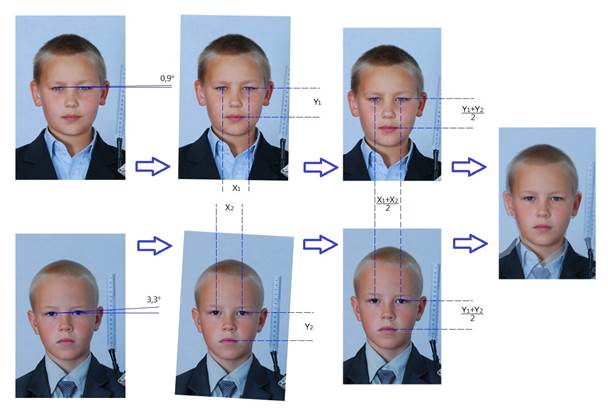
Fig. 10. Stages of the image conversion for the three points method
3.3. Image comparison and analysis
There are two main approaches of image comparison. The first and most widespread one is to compress images with one of the compression algorithms, convert them into a hash function and then compare these functions to each other. Such algorithms are fast and cost-effective.
The second approach for image comparison is to use of mathematical statistics. In mathematical statistics, there are many criteria to compare the multi-dimensional data sets and independent samples. Also, using mathematical statistics, images can be compared as well as groups of the images. In this case, the image is considered as a set of pixel values.
Such approach allows to calculate the statistical characteristics of the images, and based on them highlight areas of similarity and difference. Moreover, this method allows not only to know the similarity percent, but also to calculate the variance of each pixel, and based on it build fields of similarity and difference.
Building image clusters
There is a sample of images, which is proposed to be compressed. Compression is necessary for removing non-essential differences. Comparison is performed by a luminance component Y in the YUV color model. For each pixel of each image brightness component Y is calculated by the formula:
![]() [10]
[10]
For a given number of k clusters centroids are
constructed based on the values of the standard deviation calculated on the
basis of the algorithm described in the previous paragraph. As a result, k
centroids are uniformly distributed in the interval from ![]() to
to ![]() [13].
[13].
After sorting the centroid values of obtained clusters in ascending order, assign the pixels of each of the clusters in to the value in the RGB color model –
![]() ,
,
where i - serial number of the centroid and k - the number of clusters.
Thus, the dark fields describe the regions with the smallest
deviation and the light ones - the highest.
4. Discussion and analysis of the results
4.1. Analysis of the results of the two points Galton’s method
After the finishing of the development there was a testing of the two points Galton’s method. The first project - "Moscow Brides", was based on the materials that provided by the central Moscow TV Channel. They asked NRI and Museum of Anthropology to create the generalized portrait. Generalized portraits were classified by rotation of the head and a smile presence (¾, smiling, 18 images) (Fig. 11).
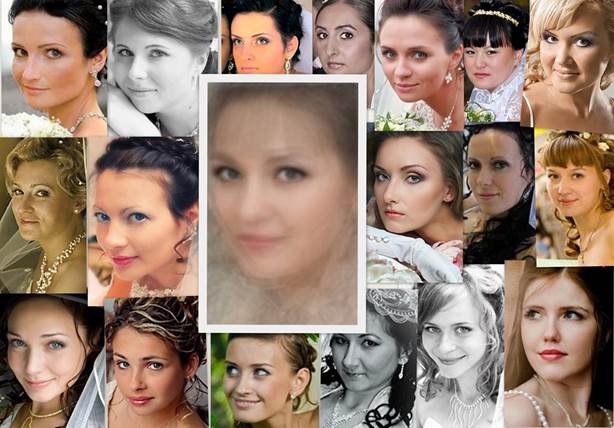
Fig. 11. Generalized portrait of Moscow brides (¾, smilingly)
The second project - generalized portraits of 16 girls and 32 boys, students of the Faculty of Cybernetics NRNU MEPhI. Merging was produced by the Galton’s method using 3 points [11] (Fig. 12).
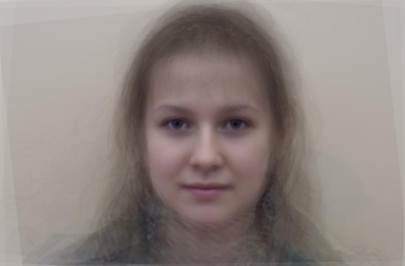
a)
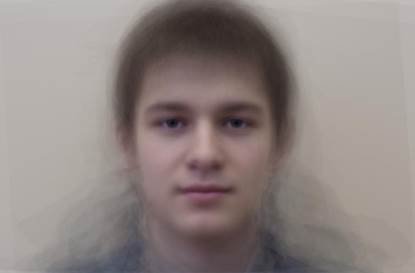
b)
Fig. 12. Generalized portrait of the students of the Faculty of Cybernetics of NRNU MEPhI: a -girls; b - boys
Portrait are "beautiful", as expected. Areas near the eyes and the mouth are the clearest, that confirms the correctness of the algorithm. Creation of this portrait using the developed program took 15-20 minutes.
4.2. Analysis of the results of the three points Galton’s method
The Galton's two points method can be applied not only to the photos, taken from the front, but also to the profile photos. Fig. 13 presents a generalized portrait of the Mongols sample taken profile, merged using two and three reference points. As the reference points were taken: the visible eye, mouth, and the center point of the ear. On the average portrait, merged using three points the ear is clarify seen.
|
a) |
b) |
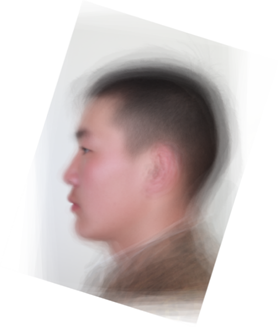
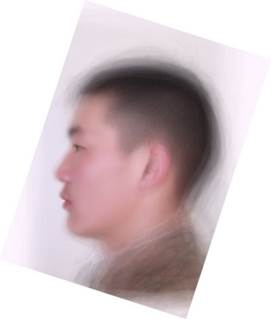
Fig. 13. Generalized portraits: a – image, merged using two points; b – image, merged using three points
|
a) |
b) |

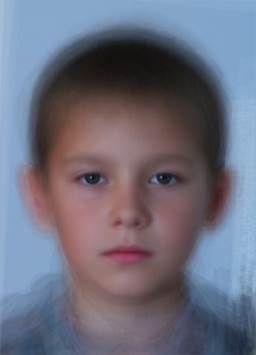
Fig. 14. Generalized portraits: a – image, merged using two points; b – image, merged using 3 points, there are clear areas near the eyes and the mouth
Such algorithm can increase the readability of the portrait
and brings it to the realistic one. The resulting portrait retains a lot of the
variance, which gives an indication about the scope of the variability of the
population.
That’s why upgrading of the two points Galton's method with addition of a third
point does not have any disadvantages.
4.3. Analysis of the results of the method with tightening carcass
Tightening carcass algorithm greatly increases the readability of the portrait and brings it to the realistic one. The resulting portrait, in contrast to the portrait produced by The Galton's two points method, does not keep the variance, which gives an indication about the scope of the population’s variability. But on the other hand, it shows a portrait of a separate sample as an entity and gives new ways for research. In addition, this portrait is very good for making accurate measurements of inter-pupillary distance and other important face measurements [1, 12].
The output of the carcass method is a generalized image smoothed as good as many points are in its carcass (Fig. 15).
|
a) |
b) |
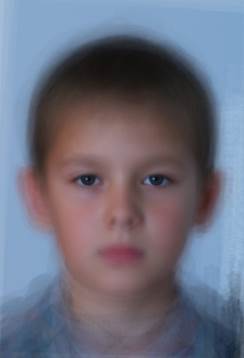
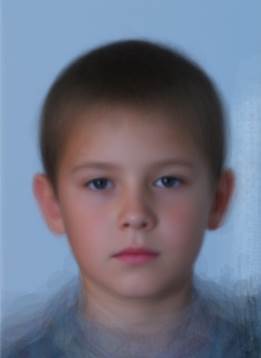
Fig. 15. Generalized portraits: a – image, merged using two points; b – image, merged using 27 points, the areas where points were located are clear
4.4. Analysis of the results of statistical processing
On Fig. 16 there is a visualization of the standard deviation of the pixels in the image.
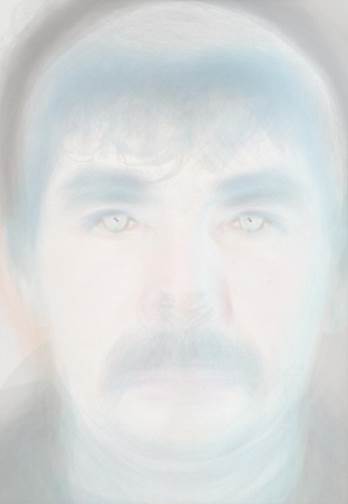
Fig. 16. Visualization of the standard deviation of the sample for every pixel
By adding and subtracting the standard deviation of each pixel, we can get different variations of the average. Each of the resulting portraits is one of the different variations of the average and gives an indication about the scope of the variability of the population (Fig. 17, 18).
|
a) |
b) |
c) |
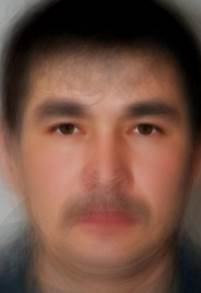
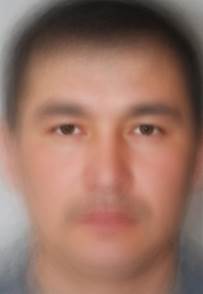
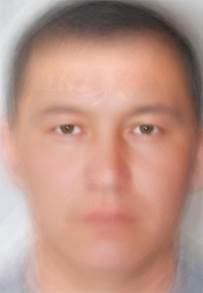
Fig. 17. Generalized portraits: a – average image minus standard deviation; b – average image; c – average image plus standard deviation
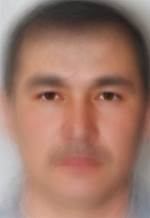
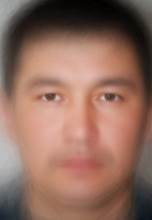
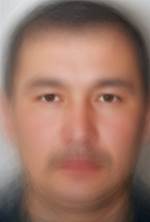
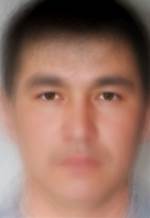
Fig. 18. Variations of generalized portraits with smooth changes of standard deviation addition
4.5. Cluster analysis results
Program analyses the sample of 32 images of the Mongols and after that the following areas are highlighted (Fig. 19):
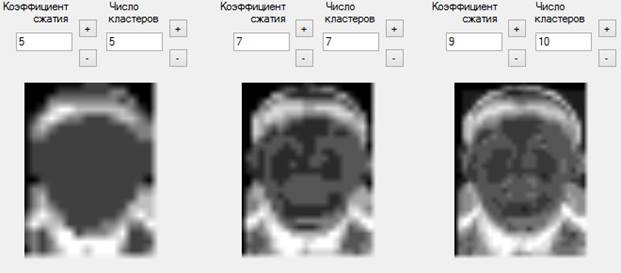
Fig 19. The results of the program by increasing the coefficients
With an increasing number of clusters and the compression level, it can be seen that there are more areas of the separation; more precise indications of differences are viewed.
Fig. 20 shows the results of the separation of the face at a compression level equal to 7.
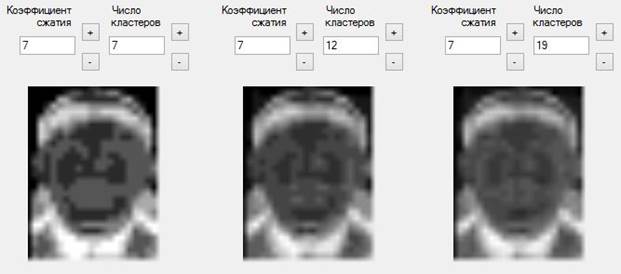
Fig 20. Program results using compression level equal to 7
After adding a new photo to into the sample, coefficients are converted, because each new element of the sample can affect the result.
Since clusters determine the number of areas and the percentage attributable to the lowest values of standard deviations, the optimal number of clusters can be found during a comparison of the sample with a comparable individual portrait. Fig. 21 shows the results of the face separation for the Bashkirs’ sample. When the compression level and the number of clusters are equal to 9, you can see the black spots in the inner corners of the eyes. This means that while comparing a particular image with the sample, it is necessary to give special attention to these black areas, as they are the most significant.
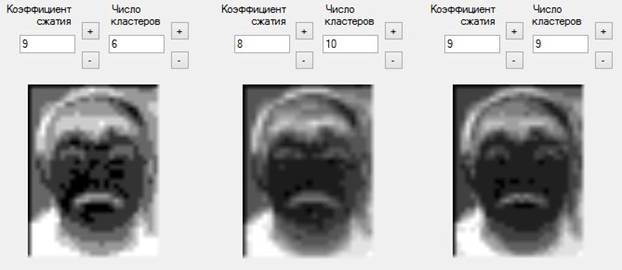
Fig 21. Program results of the Bashkirs’ sample
If one doesn’t compress the photos but sets the number of clusters equal to 256, which corresponds to the number of gray’s shades, it will be possible to get such images, which can show defining features of the sample to the researcher (Fig. 22).
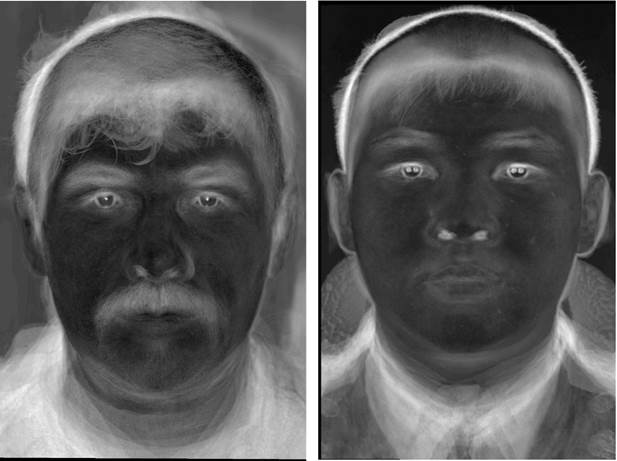
Fig 22. Program results using Bashkirs and Mongols’ samples
Finally, the expert anthropologist A.M. Maurer, Ph.D., Senior Researcher of NRI and the Museum of Anthropology of the Moscow State University commented visual comparison of generalized portraits of the Bashkirs and the Mongols: "The samples presented show that there is a great variability of the Bashkirs compared with the Mongols in the eyebrows and brow areas. The same variability is in the area of the upper eyelid and nose. This is due to the fact that the Bashkirs, unlike the Mongols, had a greater impact of neighbors form Ural, Caucasus and South Ural" (A.M. Maurer, personal communication).
5. Conclusion
The article is devoted to analysis of the existing software systems and their comparative characteristics of developed algorithms that can merge images using two, three and an arbitrary number of points, brightness adjustment algorithms and calculation of comparative characteristics.
Presented in the article software system is able to create a generalized portrait of the original sets of populations’ photos obtained in the anthropological expeditions, to visualize the obtained information and using methods of mathematical statistics to analyze the areas of the similarity within a single sample and areas of difference between samples. This allows solving the problem of the face classification.
Image analysis algorithms are implemented as plug-ins, so this makes it easy to insert a new method of the image analysis into the software system using special interface requirements.
References
- Maurer A.M. Obobshhennyj fotoportret kak istochnik antropologicheskoj informacii [Generalized photograph as a source of anthropological information]. The thesis for the degree of candidate of biological sciences. Moscow, 2006.
- Galton Fr. Composite portraits, made by combining those of many different persons into a single resultant figure. Journal of the Anthropological Institute of Great Britain and Ireland. Vol. VII, London, 1879.
- David Perrett, “In Your Face: The New Science of Human Attraction”, 2012.
- Abrosoft FantaMorph, http://www.fantamorph.com/.
- Beauty check research, http://www.uni-regensburg.de/.
- Lock K.E. Zhivopisnyj portret kak istochnik antropologicheskoj informacii (metodicheskie aspekty) [Scenic portrait as a source of anthropological information (methodological aspects)]. The thesis for the degree of candidate of biological sciences. Moscow, 2011.
- Computer vision and programming - Theoretical problems of computer vision and program implementation - brightness histogram equalization. http://cv-dev.ru
- Yerahmiel Doytsher, A rubber sheeting algorithm for non-rectangular maps, Computers & Geosciences, Volume 26, Issues 9–10, 1 November 2000, Pages 1001–1010.
- Gillman, "Triangulations for rubber sheeting." // Proceedings of 7th International Symposium on Computer Assisted Cartography (AutoCarto 7). Vol. 199. 1985.: "The Delaunay triangulation is well-defined and in some sense the 'best' triangulation on a finite set of points. It leads naturally into an efficient rubber-sheeting algorithm."
- CIE (January 1960), "Brussels Session of the International Commission on Illumination".
- Newspaper «Engineer - physicist». MEPhI, 2011, № 7-8.
- Pavlovsky O. M., Perevozchikov I.V. Obobshhennye fotoportrety nekotoryh grupp naselenija Srednej Azii [Generalized portraits of some groups of the population of Central Asia]. 1977, issue 56, p. 117-125.
- MacQueen J., “Some methods for classification and analysis of multivariate observations. In Proc. 5th Berkeley Symp. on Math. Statistics and Probability”, 1967, pages 281—297.