CLUSTVIS1: A NEW SOFTWARE PACKAGE FOR VISUALIZATION OF ATOMIC CLUSTERS AND MOLECULES
A.Yu. Pischulina1, S.A. Shostachenko, K.P. Katin, V.S. Prudkovskiy2,3, M.M. Maslov, R.V. Ryzhuk, N.I. Kargin
National Research Nuclear University MEPhI, Moscow, 115409 Russia
1 All-Russian Research Institute for Nuclear Power Plants Operation, Moscow, 109507 Russia
2 CNRS, LAAS, 7 avenue du colonel Roche, F-31400 Toulouse, France
3 University de Toulouse, LAAS, F-31400 Toulouse, France
Contest
2. Visualization of the three-dimensional cluster structure
3. Description of the visualization software
4. User interface: brief review
5. Integration of visualizer with external quantum chemistry program
A new software package for visualization of atomic clusters and molecules is designed. Instead of analogous software products, this one compiled as a dynamic link library. It allows easy integration with any modeling program and “on-fly” visualization of calculated results. The software provides static and dynamic clusters and molecules visualization in atom-bond notation. Carried out tests prove the ability of new package to visualize a wide range of atomic clusters and nanostructures, included large biological macromolecules.
Keywords: nanostructural modeling, molecular dynamics, structural relaxation, atomic animation.
1. Introduction
Widely used open source program packages for atomistic simulation (for example, GAMESS [1], YAeHMOP [2], etc.) usually do not include visualization abilities. Moreover, researchers often design their own programs for realization of specific algorithms, which also do not content visualization modules. It is necessary to use additional software for visualization of output information, in particular, the structure of the atomic clusters or molecules. There is a number of program products, provided three-dimensional atomic representation of nanostructures. Examples of such programs are ChemCraft [3], Avogadro [4] and Spartan [5]. These programs provide many abilities for molecule modeling and can interface with any quantum chemistry calculation program through input/output files. However, file-based interaction reduces the performance of the program complex.
The paper is dedicated to design a visualization software package which is compiled as a dynamic link library and can be easy included in any quantum chemistry calculating program, written in any programming language. Note, that the interaction between calculating program and visualization module can be organized only through the random access memory. It increases the interaction process speed and provides memory sharing. To illustrate integration possibilities of presented visualization software, we combine it with the original nonorthogonal tight-binding algorithm, recently developed and realized in Fortran programming language for polynitrocubanes modeling [6].
2. Visualization of the three-dimensional cluster structure
The main function of visualization program is providing abilities to represent structure of the atomic clusters from different directions. So, the cluster rotation possibility is implemented. Moreover, special functions for composite rotations are required, because the user is able to change cluster orientation many times. The problem of space rotation of the cluster has three common solutions, based on the Euler angles, rotation matrices and quaternions [7].
The method based on Euler angles has two drawbacks. The first is the impossibility to perform rotation around some axis, irrespective of previous rotations around two other axes. The second is the absence of operations for combining rotations. To rotate an object, there is a need to transform the rotation, represented by Euler angles, into another form. For example, it can be converted into matrix form. To get the resulting matrix, given matrices should be multiplied. Then the resulting matrix should be converted back into the Euler angles [8-9].
The method based on rotation matrices is less numerically stable in comparison with quaternions. Moreover, it is difficult to eliminate accumulated errors, associated with restricted numerical accuracy [10].
For these reasons, quaternions based method is chosen to be used for description of cluster rotations. This method is also well combined with Open Graphic Library (OpenGL) functions, which are used in the program. The interface of OpenGL functions used to change orientation of a pictured scene is suitable for the use of quaternions, because their input data are axis and angles. Since users use mouse to interact with the program, these data are derived from the screen coordinates of a mouse.
3. Description of the visualization software
The C# programming language, developed by Microsoft for .NET Framework [11], is chosen for realization of visualization program. OpenGL specification, which is a suitable library for rendering [12], is also used.
The atom-bond model is used to display clusters (spheres image atoms and cylinders image bonds). The bond is displayed if the distance between two atoms is lower than 1.8 Å (which corresponds to characteristic covalent bond). The number of bonds is also limited by atomic valence. Cluster can be scaled and rotated around its geometric center. The program allows user to create/delete atoms and to change atom location, “moving” it by computer mouse. Thus, possibility to create new cluster configurations is provided. When the program is just started every atom of a certain chemical element has its own default color. The color of every atom or any atom group can be changed. There is also a possibility to specify “sizes” of atoms and bonds (default radius of spheres and cylinders is 0.24 and 0.1 Å, respectively). Different tools for cluster geometry analysis are also included. It allows getting information about a bond lengths and valence three- and four-atoms angles.
The program can be used in one of two displaying modes: static and dynamic. The static mode allows working with clusters, which geometrical configuration remains constant over time, while the dynamic mode is a tool for working with films. Each frame of such film specifies some novel geometrical configuration. The dynamic mode is inherently an extension of the static mode because it is possible to work with a film frame as it was a static molecule: rotate, scale, move atoms, charge colors and sizes, get information about molecular geometry, using the tool for displaying a bond length and a valence angle. For working in the dynamic mode there is a special control panel which allows the user to start and to stop playing a film, to make a single frame jogging, to specify the number of the required frame and also increase or reduce a play speed.
The program can get input data directly from any other program as a four arrays, contained Cartesian atomic coordinates and atomic chemical symbols. Reading input data from file is also available, common formats *.xyz and *.mol are permissible. To input a film, all frames can be written in a file in a row. In this case, in the first string the number of atoms per frame must be specified. Each frame or entire film can be saved in the same formats.
4. User interface: brief review
The program for visualization has a simple user-friendly interface. It is controlled by computer mouse. The window space is divided into three parts. These parts are window title, menu bar and visualization field. Fig. 1 shows the user interface by the example of visualization of the bradykinin molecule.
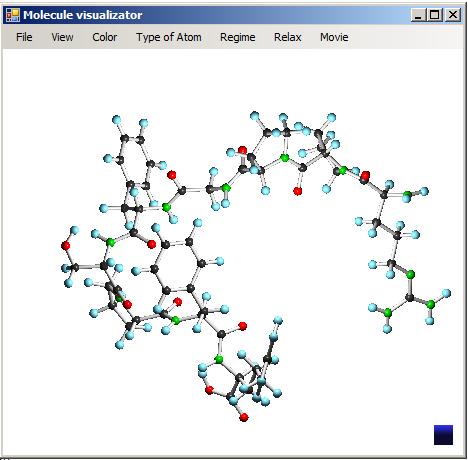
Fig. 1. User interface of the program for visualization of molecular structures.
There are minimize, maximize and close buttons in the title. The buttons are typical for the Windows operating system. The menu bar consists of five menu items, including file, view, type of atom, regime and relax. File menu item is responsible for the work with input and output data. View menu item allows to set a user-friendly display style and also to open the control panel for dynamic cluster images (see Fig. 2). Using the “Type of atom” item, user can choose a type of atom which should be added to the cluster using molecule builder tool. This tool is switched by the “Regime” item.
The visualization field is used for immediate display of a cluster and for control of this process using a computer mouse.
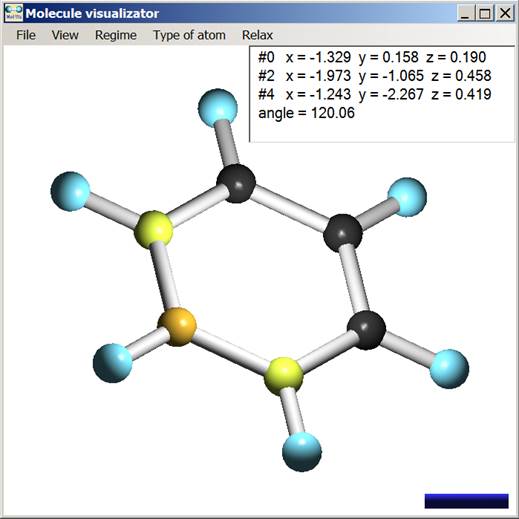
Fig. 2. Display of the program tool for the analysis of molecular geometry.
To control the program in the dynamic mode, there is a special Movie manager panel. It is available every time when the user opens a film (dynamic image of a cluster). The appearance of Movie manager is illustrated in Fig. 3, where visualization of optimization of the C6H12 molecule is shown.
Fig. 4 and 5 illustrate the user interface, using as example the C4H10 molecule geometry optimization. Relaxation is based on non-orthogonal tight-binding algorithm [6], which is combined with the visualizer (see chapter 5 for details).
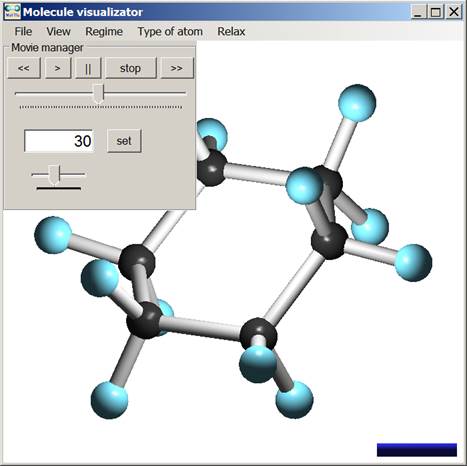
Fig. 3. User interface of the program in dynamic mode.
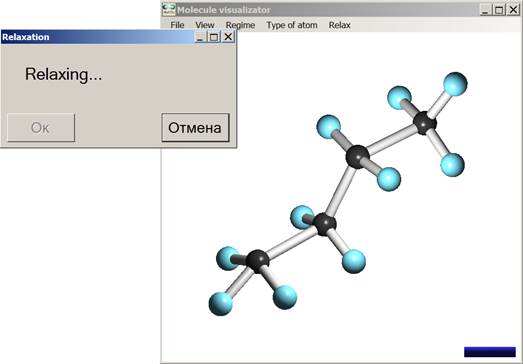
Fig. 4. Visualization of the geometry optimization process for the C6H12 molecule.
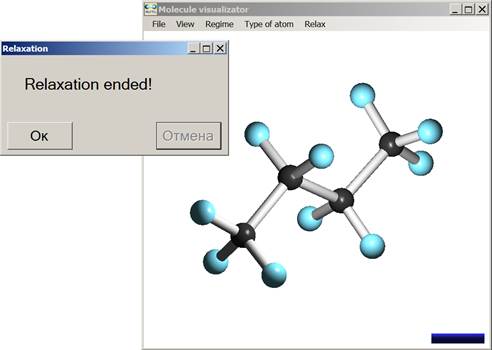
Fig. 5. Visualization of the obtained optimal geometry for the C6H12 molecule.
The panel contains standard video controls. The controls are a set of buttons to start and stop playback, track bar for scrolling, track bar to specify a playback speed and also a textbox where the user can specify the number of desired frame.
5. Integration of visualizer with external quantum chemistry program
To demonstrate the integration possibilities of the presented visualization software, we combined it with non-orthogonal tight-binding algorithm [6], realized as a Fortran program. To combine calculating and visualizing parts, there are two conventional solutions. The first solution is to call visualization program from the pre-compiled executable file. The main drawback of this way is a file-based interface for the information exchange. This drawback causes the complexity of parallel execution of joint programs and therefore complicates their interaction and display of intermediate data.
The second solution is to use the technology, based on dynamic link libraries. This approach requires modification of the code. However, it allows organizing a convenient interaction of two programs. For example, this makes it possible to control the process of subprogram execution from the linked dynamic library. This control allows the user to stop the execution of the subprogram at any time, to obtain intermediate results which can be immediately displayed by visualization program or to transfer any additional information in the subprogram.
Obviously, the second solution is preferred. It was chosen for combining visualizer with the non-orthogonal tight-binding program [6]. To test the obtained program complex, we visualize the optimized geometry process of about two hundred clusters and molecules, including colistin, bradykinin, graphene and polycubane chains. Successful executions of the combined program complex have been observed in all cases.
Conclusions
A new software package for the visualization of atomic clusters and molecular structures is presented. It can be used for visualization of the output data, getting from quantum chemistry calculating programs. Moreover, presented software can be combined with such programs through the dynamic link library mechanism. It yields to the increases of the program performance and provides memory sharing. We believe that the new visualizer will be useful for researchers, working in fields of nanophysics, chemistry and biology.
Acknowledgements
This work was financially supported by Federal Target Program “Research and development on priority areas of science and technology complex of Russian Federation for 2014-2020”, application number is 14.578.21.0064.
References
1. http://www.msg.chem.iastate.edu/gamess/index.html Accepted date: 25.12.2014.
2. http://www.yaehmop.sourceforge.net Accepted date: 25.12.2014.
3. http://www.chemcraftprog.com/ Accepted date: 25.12.2014.
4. http://avogadro.cc/wiki/Main_Page Accepted date: 25.12.2014.
5. http://www.wavefun.com/ Accepted date: 25.12.2014.
6. K.P. Katin, M.M. Maslov, Thermal stability of nitro derivatives of hydrocarbon cubane // Russ. J. Phys. Chem. B, Vol. 5, pp 770-779, 2011.
7. D. D. Holm, Geometric Mechanics, Part II: Rotating, Translating and Rolling / Mathematics Department Imperial College London, 2013.
8. H. Goldstein , Classical Mechanics, 2nd edition / Reading, MA: Addison-Wesley, 1980.
9. E. W. Swokowski, Calculus with Analytic Geometry (The Prindle, Weber & Schmidt series in mathematics), 4th edition / Pws Pub Co, 1988.
10. K. Shoemake, Animating Rotation with Quaternion Curves // Computer Graphics, Vol. 19, pp 245-254, 1985.
11. H. Schildt, C# 4.0 The Complete Reference / McGraw Hill, 2010.
12. R. S. Wright Jr., B. Lipchak, OpenGL Super Bible, 3rd edition / Sams, 2004.