Using multidimensional analysis technologies for complex process sensitivity analysis visualization
D.A. Zholobov
National Research Nuclear University MEPhI
Contents
2. Review of a common sensitivity analysis visualization methods
3. Multidimensional analysis systems
4. Studied processes classification
6. Visual sensitivity analysis
8. Business planning results visualization
Abstract
This article presents visual multifactor sensitivity analysis software developed at MEPhI’s System analysis department. Process studied should be defined either functional or in imitation model form. The software uses modern multidimensional analysis technologies for visualization. Interval values of target indicators used as measures. Software capabilities demonstrated on example of business planning sensitivity analysis problem. In addition, article describes applying software in FIDE project.
Keywords: sensitivity analysis, multidimensional cube, business planning, imitation model, target indicator
1. Introduction
Variance of target indicator is a problem while forecasting results of some process. This variance appears because different factors that process depends on have uncertain values. These uncertain variables can be input factors for process as well as environment parameters. Estimating range of target indicator value depending on parameters values in math is called sensitivity analysis [1], there are many methods developed for such analysis [2,3].
One shining example of a domain where sensitivity analysis frequently used is the problem of estimating expedience of investments. Results are depending on macroeconomic indicators as well as on input factors such as: investments volume, implementation scenario, etc. [4]. Variety of domains where sensitivity analysis may be applied isn’t limited with investments domain, it might be useful in some physical processes ([5] for example), imitation modelling, games theory and so on.
Meanwhile although increasing number of random factors doesn’t create significant problems for computers, it is a problem for decision makers, because it makes adequate estimation of factors variance where the project makes sense to be a hard problem.
Main goal of this article is to present capabilities of multidimensional analysis to help visualize multifactor sensitivity analysis results. Based on this approach a software for sensitivity analysis was implemented at System Analysis department of MEPhI.
2. Review of a common sensitivity analysis visualization methods
The simplest way to visualize multifactor sensitivity analysis results is to split it to a row of single variable dependencies. Every single graph contains target indicator dependency on one variable while all other variables have fixed value. Such kind of sensitivity analysis is called OFAT (one-factor-at-time acronym). Typical software using this approach is Project Expert [7], popular application for business planning in Russia. Visualization in this application may be in a tabular view (fig.1) as well as in graphic (fig.2)
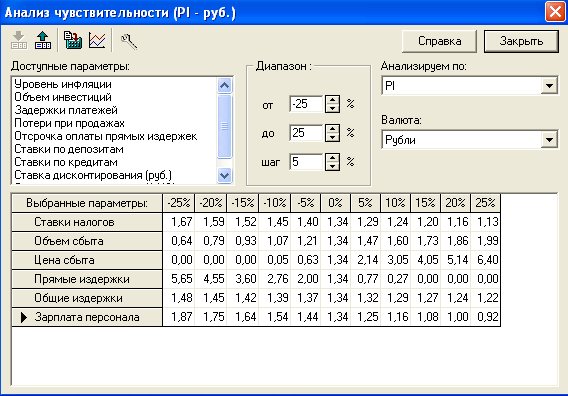
Fig. 1. Tabular view of OFAT sensitivity analysis in Project Expert
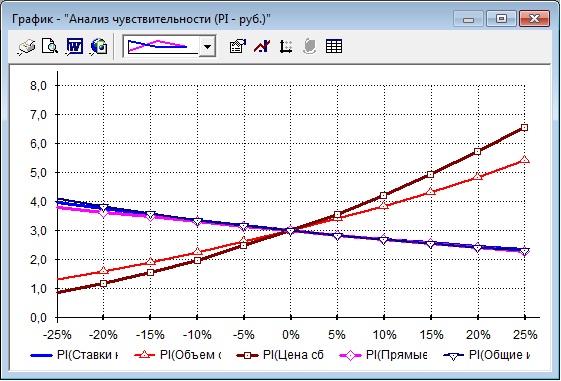
Fig. 2. Graphical view of OFAT sensitivity analysis in Project Expert
OFAT approach works well when dependency of target indicators and factors can be presented as an additive function of single variable sub-functions, for example:
|
|
(1) |
But as far as any nonlinear composition appears, for example:
|
|
(2) |
splitting factors to distinct graphics leads to incorrect interpretations.
OFAT may be upgraded in different ways. For example, in [8] surface graph projections are used to make two factors at a time analysis (fig.3).
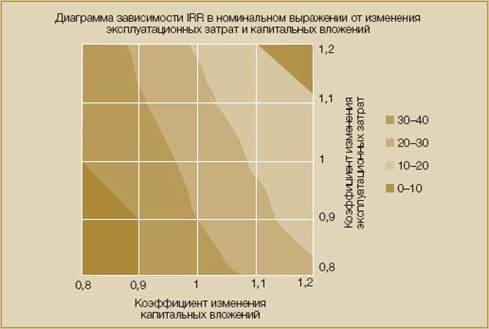
Fig. 3. Two factors sensitivity analysis visualization in [8]
Another approach is scenario analysis. In this case possible ranges of different factors values are grouped into scenarios and variation of target indicator is calculated for every distinct scenario. Then the same visualization like in OFAT is made (fig.1,2).
One interesting way to visualize sensitivity analysis results is based on scatter plots [9]:
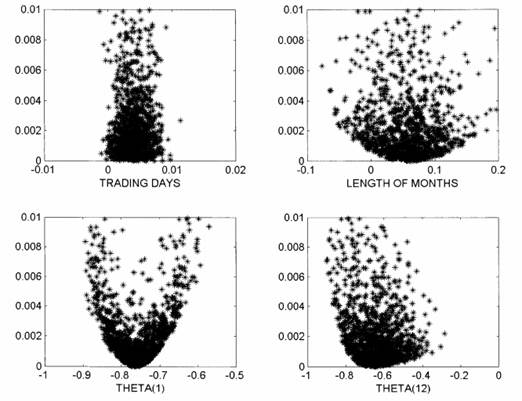
Fig. 4. Using scatter plot for sensitivity analysis visualization in [9]
The same data set is visualized on separate scatter plots. Ordinates contain the same target indicator on all plots. Abscissas are used by single factor, one plot for every factor in process. One point on plots is a target indicator implementation for exact set of factors values. This way of visualization allows to present sensitivity of target indicator to every factor (the same as OFAT), but it also allows decision maker to understand mutual effect of factors to indicator and gives him a chance to adequately interpret processes with functional dependence like (2).
3. Multidimensional analysis systems
Usually multidimensional analysis systems are not in sensitivity analysis scope. Main goal of such systems is to deliver data storage in multidimensional cube, which dimensions are discrete variables (both qualitative and quantitive) with variation range defined (for quantitive variables) or possible values listed (for qualitative variable). Every cube cell stores one or more values (measures), position of every cell in cube shows which value every dimension has that address current measure value (fig.5).
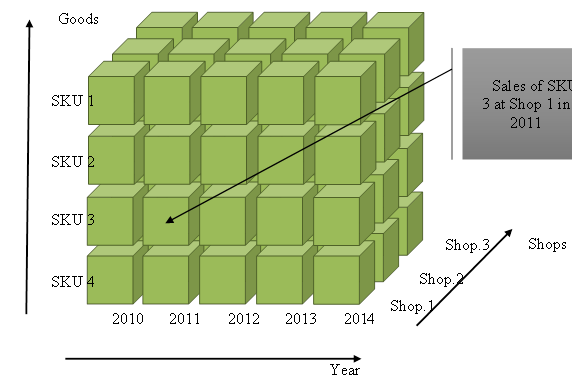
Fig. 5. Multidimensional cube sample
Values of every distinct dimension can be grouped into hierarchies. For example, time dimension may be presented in Year-Month-Day hierarchy. In this case cell is addressed by exact date but in query scope hierarchy levels (months or years) may be used. This technology was mostly created to achieve two independent goals:
· Query algorithms performance boosting on account of massive data redundancy of preliminary calculated aggregations (for all years, for all goods, for all company, etc.)
· Data presentation unification for analysis needs. Multidimensional model is much simpler for decision maker than classic entity relation model.
There’re different ways exists to deliver multidimensional storage allowing to achieve one goal or both, depending on a task. First goal is not important in current article scope so let’s focus on methods of multidimensional data visualization.
One of most popular ways to deal with multidimensional data is the pivot table and pivot graph as complimentary technique. User forms demanded report by himself dragging necessary dimensions and measures in pivot table area. Dimensions are available on every grouping level. Also, considering two-dimensional data presentation, Cartesian product of dimensions may be placed on columns or rows. Also, user can slice data by filtering values of dimensions. In this case application will assume that user wants to get data for only cells that have exact dimension address. Samples of pivot table and pivot graphs based on data from publishing company for kids are at figures 6 and 7.
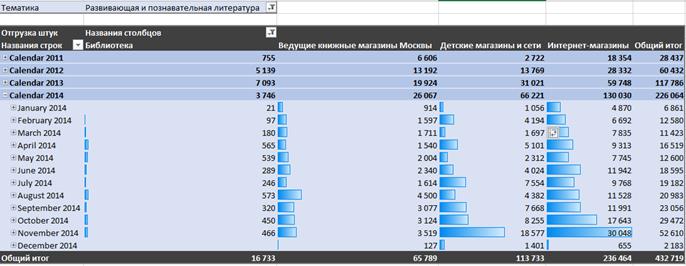
Fig. 6. Pivot table sample: books sales quant dynamics of developing literature in different channels of sales.
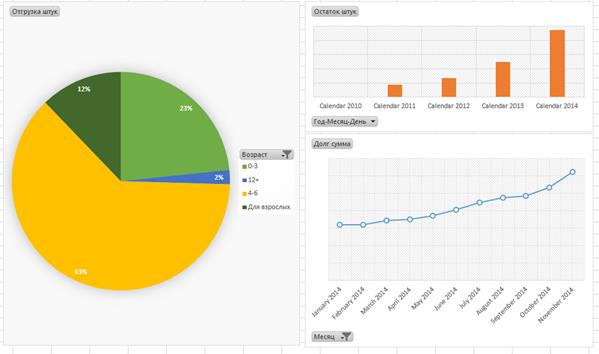
Fig. 7. Pivot graphs samples: books for kids different ages sales shares distribution, warehouse stocks yearly dynamic, monthly receivables dynamic.
Main advantage of multidimensional way of data extraction is a self-service nature of this process. Decision maker hasn’t to ask developer to get report. This fact stimulate user to actively generate knowledge, oppose to passive acquiring standard reports. User may find anomaly in some figure and instantly dig this anomaly by slicing data to every level necessary, not losing attention and creating new knowledge in his domain.
Dashboards and scorecards are evolution of pivot tables and diagrams.
Dashboard is a complex of pivot tables and diagrams located in one area (typically – webpage) and integrated by single source of data and set of filters managing data in all tables and graphics (fig.8).
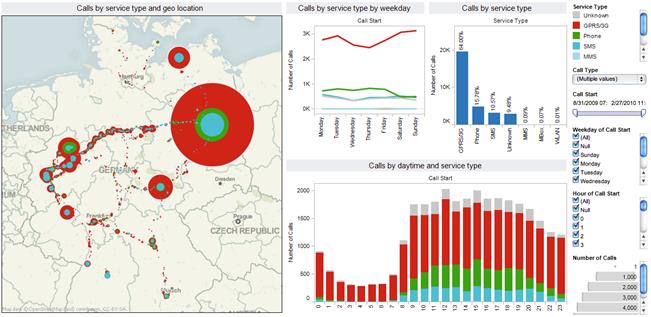
Fig. 8. Visually rich dashboard sample.
Scorecards are a set of key performance indicators (KPIs), defined in approved company’s methodology, displaying its health, storing in multidimensional structure in a form of numbers <current value, planned value, status, trend> (fig.9). Visualization is possible in pivot table view or as a part of dashboard. Usually opening scorecards user see aggregated KPIs, but it can drilldown one or more KPIs to department level, single SKU level or any other storage dimension level.
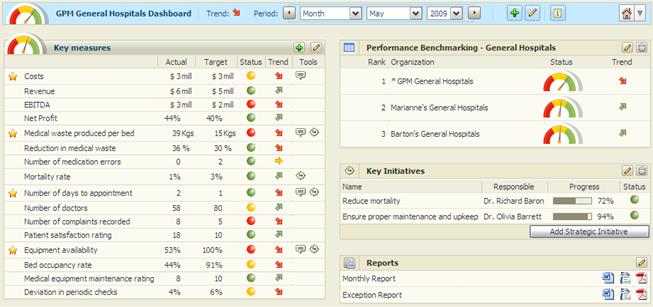
Fig. 9. Scorecards sample for hospitals network
In general, area focusing on technologies described in this paragraph is called Business Intelligence (BI). Based on Gartner reports, world leaders in this area are Microsoft, IBM, Tableau software, Qlik. First two companies focus on multidimensional data storage and processing having young and not so sophisticated visualization tools, while next two develop first class showcases based on dashboards and scorecards, but staying behind in storage and processing aspect. Luckily these applications are compatible that allows to avoid compromises and create solutions optimal from both calculation and visualization points of view.
As follows from its name BI, these technologies are mostly used in business data analysis. But multidimensional technology itself doesn’t carry any semantic and may be successfully applied in any tasks where data can be presented in a multifactor view and big data processing is a requirement. Because sensitivity analysis has both options, adopting multidimensional technologies for this problem appears to be actual and perspective.
4. Studied processes classification
Let’s assume two ways to express relation between target indicator of complex process and random parameters:
1. Classical functional dependency :
|
|
(3) |
where P – target indicator, xi – random variable affecting target indicator. We will assume that every variable is discrete:
![]()
It helps us to avoid researching ![]() function
extremums by working with combinatorial sets instead. Complexity of
function
extremums by working with combinatorial sets instead. Complexity of ![]() functions
hasn’t any limitation, but it should be defined that is not possible in every
case. Typical example of a domain where this case works well is a problem of
business plan quality estimation for investments. In this example
functions
hasn’t any limitation, but it should be defined that is not possible in every
case. Typical example of a domain where this case works well is a problem of
business plan quality estimation for investments. In this example ![]() function
is discounted cash flows sum and random variables are different project
factors: loan rate, currency rate, demand, raw materials prices, etc.
function
is discounted cash flows sum and random variables are different project
factors: loan rate, currency rate, demand, raw materials prices, etc.
2. Often it is impossible to express dependency of indicator and input factors. In this case let’s use imitation model as a most common way to define relations. Imitation model from sensitivity analysis point of view is just a black box (fig.10).

Fig. 10. Defining process with imitation model
Also, relation between factors can be classified into two cases:
1. Factors are not related. In this case set of all possible factors implementations is a Cartesian product of all possible values sets for every factor. Capacity of this set grows exponentially with count of factors that limits maximum supported complexity of process studied.
2. Relation exists between possible factors values. Set of all possible factors implementations is smaller (usually significantly) that set of Cartesian product. In this case count of factors can reach big numbers, depending on degree of dependency between factors.
5. Data preparation algorithm
Preparing data for visual multidimensional analysis in general is presented at figure 11:
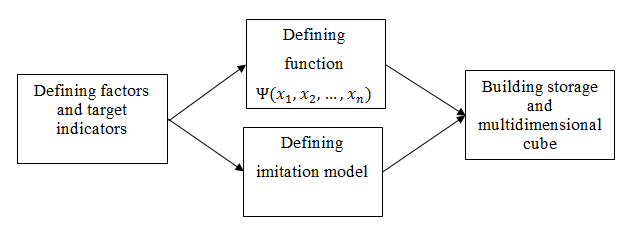
Fig. 11. Preparing data for visual analysis
First of all, user should define factors and target indicators in special application. If factors are not related (case 1) then user have to define possible values for every factor. Usually he defines a scale: minimal and maximal factor’s values and scale step between these numbers. For qualitative parameters user have to list all possible values.
As multidimensional analysis technology supports hierarchical grouping of factors values, hierarchies can be defined as well. For example, inflation factor in business plan may be presented as a scale with range from 1% to 12% with 1% step that gives 12 possible values, while values in range 1-4% can be grouped into “low inflation” level, values 5-8% can be grouped into “average inflation” level and next four values in “high inflation”. It gives additional opportunities for analysis we’ll discuss later.
Defining function (3) can be done in two ways: user either specifies formula in application or complete function can be exported from external planning software.
In case when target indication dependency is defined with imitation model, it should use input and output formats standard and application allows to configure executable to run model.
If relation between factors exists (i.e. it is not necessary to iterate full Cartesian product set), user have to define executable “enumerator” to generate factors implementation for every iteration. This enumerator is connected to system and is used to build multidimensional storage. It might make sense to have such enumerator even if there’s no relation between factors. If capacity of full set of factors implementation is too big, application could switch to Monte-Carlo method [3] to form partial set with smaller capacity using appropriate enumerator.
After all metadata of process is specified and the system is configured, automated building storage procedure is executed (fig.12).
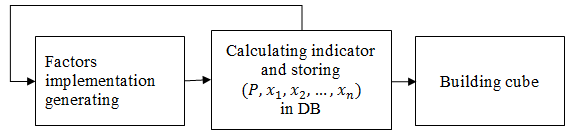
Fig. 12. Building storage and cube scheme
Factors implementation generating, calculating of indicator and saving all data to DB performs in loop, either working on set of Cartesian product (case 1) or executing enumerator to get current factors combination (case 2).
When filling storage is done, building multidimensional cube is executed. This cube is an ultimate data source for decision maker visualization applications.
6. Visual sensitivity analysis
When all processing procedures are finished, ready multidimensional cube is accessible to user. This cube can be used for sensitivity analysis.
In current article we’ll use popular Microsoft Excel for pivot table visualization. But visualization capabilities are not limited with this application. Any software supporting queries from UDM (unified dimensional model – Microsoft multidimensional semantic) will work well with this system. Amongst others, such leaders as Tableau software, MicroStrategy, etc. have compatible solutions for visual analysis.
As far as pivot table is two-dimensional matrix visualization technology [6], user have three options for building convenient data presentation: fixing value for some factors, grouping data using hierarchies and placing Cartesian product at axis. In any case to build a report, aggregation of target indicator possible values will be applied. As decision maker expects ranges of target indicator in every cell of pivot table, system supports interval number aggregates: minimum and maximum values of indicator for current cell (fig.13).
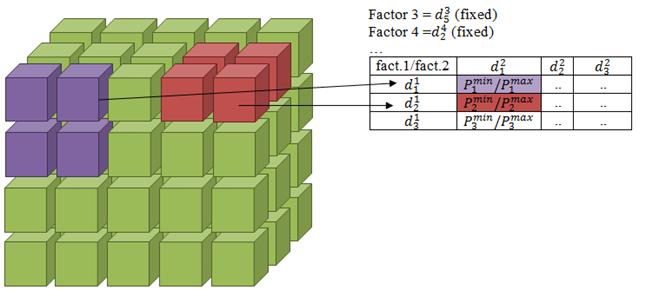
Fig. 13. Aggregating target indicator as interval number in pivot table
7. System architecture
The system contains following components (fig.14):
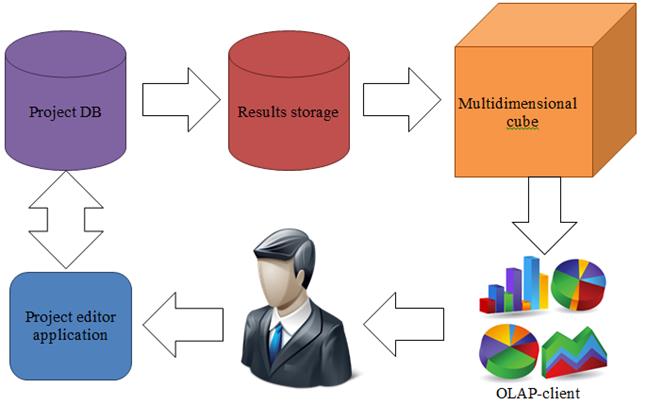
Fig. 14. Main components and data flow
- Project database. Contains all project metadata: target indicators, factors with definitions of possible values. If dependency of target indicators and factors is defined as function then formula of this dependency is stored. In case of imitation model, database stores path to executable implementing the model, messaging between model and analytical system is based on standardized XML. For business planning domain specialized version of database was implemented. It allows to store repeating and onetime cash flows in more convenient way. Project database is designed in third normal form. The algorithm of data generation is also a part of this database: it is written on T-SQL and its code is stored in database as a stored procedure.
- Data warehouse. Denormalized relational database for storing results of sensitive analysis (fig.12), organized using “star” schema. Fact table stores results of factors implementation: codes of factors values and target indicators values. Related tables store reference information on possible factors values. Base RDMS managing these databases is Microsoft SQL Server.
- Multidimensional cube. Specialized non-relational database storing information in multidimensional arrays optimized for query processing performance. As a platform Microsoft Analysis Services is used.
- Project editor application. Simple application, developed in .Net Framework using C# programming language. It delivers user interface for editing data and configuration stored in project database
- OLAP-client – application for multidimensional data visualization. For current article purposes Microsoft Excel application was used.
Advantages of architecture presented are maximal flexibility of system to different usage scenarios and that to its future upgrades. Having data warehouse as a part of solution provides high performance of all computations and multidimensional cube building. For visualization purposes wide range of applications compatible with Microsoft BI platform are available. Even use of any incompatible visualization application required, data can be acquired from data warehouse with regular SQL queries without using multidimensional cube.
Luckily, multidimensional cubes aggregation technology as said earlier have very good correspondence with interval nature of target indicator. This fact together with hierarchical structures support delivers wide appliance specter of this system in different domains. Let’s look at examples.
8. Business planning results visualization
Business planning process is to allocate funds to economic articles (sales, raw materials, salary, lease, credits, etc.). As a result, a set of cash flows appears. A row of target indicators is defined, based on these indicators investor decides whether he will invest funds into project implementation or not or compares different projects and choose most efficient one. These indicators are: project’s net present value, internal rate of return, payback period and others. At the same time, many uncertainty factors are heavily influencing project result: loan rate, inflation, demand, currency rate and so on. The task of sensitivity analysis of target indicators to uncertain factors is highly actual. As far as target indicators can be presented as function of consolidated time series of cash flows, wide range of sensitivity analysis methods exists: statistical analysis, scenario analysis, etc. Presented system can be considered as a powerful tool for visualizing results of sensitivity analysis.
This software allows to import cash flows from Project Expert application. After that in special user interface optimized for time series, user can define factors and parameterize cash flows (replace constants specified in Project Expert with functions):
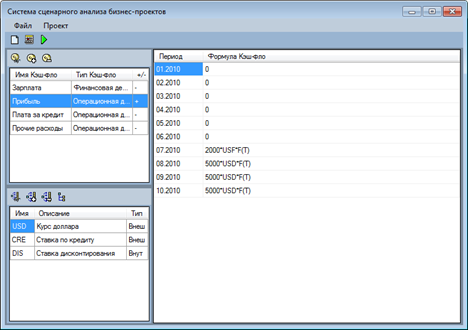
Fig. 15. Cash flow editing user interface
After that user runs storage building procedure and after some time he gets multidimensional cube, ready for visualization results of sensitivity analysis:
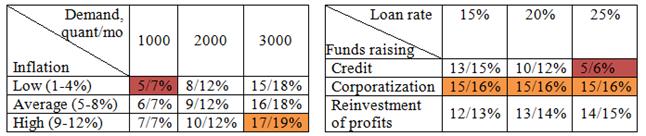
Fig. 16. Interval IRR value depending on different factors variations
9. Chess algorithm profiling
Recently at international chess association FIDE a new idea of chess popularization appeared. The idea was to create international bookmakers company that will accept bets on chess worldwide (assuming laws of separate country). Main innovation that distinct this new company from others was that this new company should accept in-game live bets while currently all companies accept bets on chess before match begins. Markets for live-bets are specially designed for betting on matches of a blitz kind, that can be quickly traded and quickly settled (what chessman will be moved, what cell – black or white will be destination for chessman, whether player will hit or not and so on).
Complexity of such kind of markets lies in impossibility of expert estimation of chances due to huge count of simultaneous matches and low time (seconds) for one turn. To solve this problem, as a part of joint project with FIDE mathematical algorithm was developed. That algorithm relies on chess processor opinion on best turns, players profile, match environment and generates probabilities and odds for trading. Algorithm requires effectiveness tests before going live.
Testing schema was based on wide historical set of matches and while knowing historical moves, to simulate gambling on that moves using implemented algorithm. If algorithm will show positive profit of such kind of virtual gambling, it will be a proof of its effectiveness in real life. Imitation model for simulation should calculate probabilities, odds, simulate customers that wish bet on these odds, settle bets and calculate profit. Processing results on a big set of historical data, virtual bookmakers company profitability can be calculated. It depends on a row of factors, such as class of tournament, chess rules, playing persons, position on chess board (debut, middlegame, endgame), customer behavior (venturesome, moderate, cautious) and others. As a tool for visualization of this sensitivity analysis, presented system was chosen.
Note that factors in this problem are related. There’s no need to pass through all Cartesian product of all factors, but to pass all historical moves instead. For example, if Kasparov never played in novice tournaments in historical set, it doesn’t make sense to assume this factors implementation. As a result, except of imitation model itself, special enumerator, iterating every historical record was developed. Overall application scheme is displayed on figure 17:
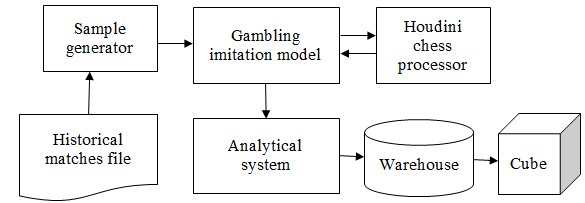
Fig. 17. Scheme of data preparation for chess processor profiling
This system was tested on 100’000 historical records on chess board positions and moves made. Based on these tests multidimensional cube was formed that store profitability of imaginary bookmakers company depending on different factors. Figure 18 shows example of possible slices available from this cube.
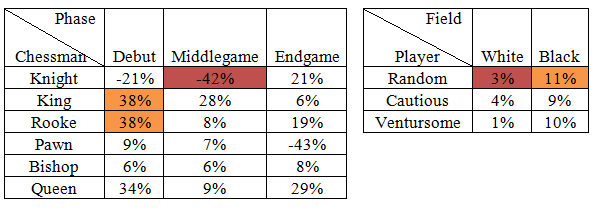
Fig. 18. Samples of sensitivity analysis visualization of bookmakers company profitability depending on market, position on board, player behavior
Analytical system developed proved effectiveness of profiled chess processor and expedience of overall project. Also target indicators being analyzed in different slices, allow chess processor tuning to minimize risks in real life gambling. Demo of system is located in Internet at http://chess.skysense.ru/
10. Conclusion
Software presented in this article is designed for visualizing results of conducted sensitivity analysis of complex process. To achieve this goal, software uses multidimensional data analysis technologies. Interval values of target indicators (aggregates of kind MIN and MAX) plays a role of measures, while uncertain factors influencing target indicators plays a role of dimensions. Advantages of such approach comparing with classical one factor analysis lie in possibility to visualize set of possible indicators ranges in different slices of possible factors ranges using powerful capabilities of multidimensional analysis that allows decision maker to discover complex non-linear dependencies between indicators and factors. Software allows to research processes with functional relations as well and processes with relations expressed in imitation model. Both full Cartesian product of factor values and enumerator approach, with only factors implementations having meaning considered, are supported.
From components point of view, software use all advantages available in modern BI platform from Microsoft: SQL Server product family server side and client technologies like Microsoft Excel.
Software was applied for test business project sensitivity analysis as a proof of concept. Also software was deployed in FIDE organization as a part of project of launching international bookmaking company for chess betting, created for chess popularization. Results acquired using presented software proved its solvency in sensitivity analysis solutions area.
In future according to the author, software advancing should move in two directions:
1. Adding support for optimization models sensitivity analysis. The most interest is to research goal value dependence on its goal factors values, especially for quadratic optimization models. It could give a second life for Markowitz model for portfolio investments. Currently this model is used for academicals purposes only for learning students. Meanwhile, if portfolio sensitivity to fluctuation of assets dispersions and correlations will be available in multidimensional view, this model can be used in real life.
2. Development of special version to analyze continuous processes in real time. In infinitely dynamic processes for example decision making may rely on solving local optimization problem while uncertainty of system state in future iterations forms range of possible indicator values related with a row of factors. Software allowing to conduct continuous sensitivity analysis based on instant system state and values range of factors and visualize it to decision maker in real time appears to be very interesting way. Trend in BI area to deliver ultrafast in-memory multidimensional solutions gives additional impact on this idea.
Literature
- A.Donchev. Optimal Control Systems. Perturbations, estimations and sensitivity analysis.– M:MIR, 1987 [In russian]
- Van der Heijden K. Scenarios, Strategies and the Strategy Process Nijenrode University Press, 1997.
- Sobol I.M. Monte-Carlo method. – M.: Nauka, 1972.
- Vilensky P.L., Livshitz V.N., Smolyak S.A. Estimation of effectiveness of investments projects (theory and practive). – M.:Delo, 2001. [In russian]
- Volkova E.V. Sensitivity analysis methods for models of filtration and mass transfer in underground hydrosphere: doctors dissertation.– M, 2009. [In russian]
- Pilyugin V.V. – Computers geometry and visualization. – М:MEPhi, 2005 [In russian]
- Aliev V. Business planning practicum with Project Expert.–М:Forum, 2010 [In russian]
- Timofeev T. – Analysis of investment projects risks. Finance Director: No.7, 2008 [In russian]
- Andrea Saltelli, Sensitivity Analysis for Importance Assessment, Risk Analysis, Vol.22, No.3, 2002