Experimental visualization of two-dimensional distribution of critical current in the long-length high temperature superconducting tapes
S.V. Pokrovskiy1,2, I.A. Rudnev1,2, A.I. Podlivaev1, V.S. Kalitka3, A.V. Blednov3, A.A. Adamenkov3
1 National Research Nuclear University “MEPHI”, 115409, Moscow, Russia
2 International Laboratory of High Magnetic Fields and Low Temperature, Wroclaw, Poland
3 SuperOx, Moscow, Russia
Contents
2. The algorithms of magnetometric definition of currents and visualization of current paths
3. The technical scheme of experimental set-up and visualization software
Abstract
Based on electrical current flow visualization a novel method of superconductive tape quality control is proposed and realized. We present the description of method as well as the results of application of developed method for two-dimensional (2D) distribution of critical current in long high temperature superconducting (HTSC) tapes visualization. The method is based on the measurement by array of Hall sensors of trapped magnetic flux and numerical solution of the inverse Biot-Savar problem for the case of reel-to-reel rewinding in the real time. The modification of algorithm of 2D calculation of critical current is proposed. The aim of modification of standard algorithm was to improve the stability of the system to failure of one or two neighboring Hall sensors. The possibility of application of the methodology for the HTS tape length of over 500 m is shown.
Key words: visualization of current flow, HTSC tape, local critical current, critical current inhomogeneous
1. Introduction
The important role in the production of long-length second generation (2G) HTSC tapes plays the control of local transport characteristics of superconducting material. To define and characterize the area with low critical current the obtained data have to be presented in a three-dimensional graphical form, and the final distributions of the critical current in the superconductor have to be analyzed. The development of technologies of high-temperature superconductors production makes available for technical application the superconductive (SC) tapes which may carry out electric current with a density jc more than 1 MA/cm2 at liquid nitrogen temperature without energy dissipation. The jc value is absolutely unavailable for traditional electro-technical materials. The length of single pieces of SC tapes may to be up to 1 km. It is obvious that it is very difficult to obtain all optimal parameters values for hard technological processes of long-length SC tapes production. The changes in technological parameters inevitably lead to creation of local region with reduced transport characteristics [1] and as a sequence to limitation of possibility to carry out high current densities for whole tape. It very important for applied tasks solving like the development of superconductive cables, magnets, current limited devices. So the nondestructive diagnostic of tape quality is a necessary element of production process of long-length SC tapes. In the present paper the contactless magnetometric method of visualization of electrical current flow defects in SC tapes is presented. The method is based on the measurements of spatial distribution of magnetic field induced by currents in the tape and following treatment of experimental data by a computer code.
2. The algorithms of magnetometric definition of currents and visualization of current paths
The most promising form of contactless nondestructive quality control of SC tapes is the magnetometric measurements of the critical current induced in the film by external homogeneous magnetic field (see, e.g., the review [2]). The essence of the method is as follows: superconductor is cooled below Tc and then placed into magnetic field (0.5 Tesla), which induces shielding currents in the superconductor. After turning off the external magnetic field a superconductor traps the magnetic flux which is generated by nondecaying superconducting currents. To define the local distribution of current in the superconductor it is necessary to make measurements of the spatial distribution of the trapped magnetic flux. Further, the spatial distribution of the local critical current may be obtained by solving the Biot-Savart-Laplace inversion problem (1) taking into account the critical state model [3]. And local regions with reduced critical current values may be determined also.
![]() , (1)
, (1)
where µ0 - magnetic permeability of vacuum, V - the region of localization of circulating currents in the superconducting film. To determine the surface currents in the absence of flow of a current to the Z-axis direction it is sufficient to make the measurements for a single plane component of the magnetic field (assuming that in Descartes coordinates (X, Y, Z) the SC film lies in the plane Z = 0, Y coordinate is directed along the tape, and the coordinate X is directed across the tape in accordance with Figure 1).
The most effective method of solving the inversion problem (1) is using of the two-dimensional Fourier transform. In momentum space, the equation (1) is diagonal (the Fourier transform of the magnetic field and current components are related locally [2]). However, the Fourier transform is applicable only to a periodic function, while the measured sample field has no periodicity. There are the standard approaches to solving the problem of determining currents [2] to eliminate the influence of geometrical form of the sample. Such approach is the measurement the magnetic field for region that greatly exceeds (5-9 times) the size of the sample (see Figure 1(a)).
Such a standard approach is not applicable for monitoring purposes for two main reasons. Firstly, quality control requires SC tape as it passes through the measurement system in real time. Second, the experimental determination of the magnetic field far beyond the tape is considerably complicated and the technical implementation of the measurement scheme is quite costly. In the measuring device creation process, we developed a new modified algorithm. SC tape was divided conditionally into several areas (I - serial number of the area). Inversion was carried out on a region containing three adjacent area numbered as I-1, I, I + 1 (see Figure 2), but the results remained for the I-th site only. Next, the sequence number area was increased by 1 and the process was repeated. Our experience with long-length samples showed that the long-range currents in a tape with wide a reaches a value that equals to several values of a. But when you remove the source of errors in the distance 10a and more, the influence of the remote border can be neglected. In addition, the solution of numerical extension of the definition of the magnetic field outside the sample was proposed and successfully implemented [4]. Since in this area there are no joint venture currents, the magnetic field is a subject to the three-dimensional Laplace equation, the boundary conditions for which are the experimental values of the magnetic field on the edge of the tape and joint venture zeros at infinity (the details of the reconstruction algorithm given in [4]).
|
a) |
b) |
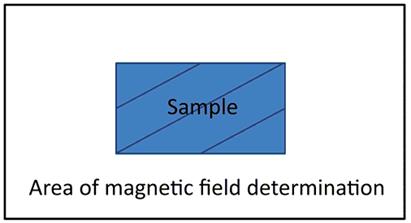
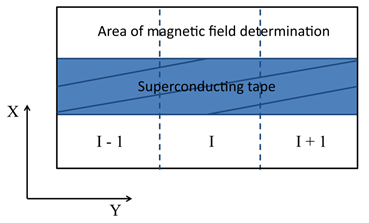
Fig. 1. The computational domain of Bio-Savar-Laplace inversion problem.
1(a) - the form of the computational domain in the standard approach for a short sample.
1(b) - the form of the computational domain, adapted to lengthy tape
The practical application of the algorithm in the experimental set-up which is used to measure the magnetic field line of Hall sensors will significantly reduce the number of Hall sensors in the line and simplify the data collection system. Note that the number of Hall sensors in the line is critical of this approach, since the measuring system should not only allow to visualize in detail the structure of the current defect of current flow in the SC tape, but also continue to confidently diagnose defects, failure of one or more sensors in the lineup.
3. The technical scheme of experimental set-up and visualization software
In order to perform the measurement of long HTS tape the reel-to-reel system has been constructed (Figure 2(a)). The uniform moving of tape was achieved for precise determination of the spatial distribution of the current. General view of the experimental setup is shown in the Figure 2. The HTS tape comes into cryostat with liquid nitrogen. In the bath tape cools down to T = 77 K at zero magnetic field. After cooling in the superconductor moves to the region of magnetic field (NdFeB magnets) and circulating current are induced. The system of magnetic field generation is based on permanent NdFeB magnets arranged into a cryostat near the tape surface. After magnetization tape passes throw the measurement system which consists of an array of Hall sensors (Figure 2(a)) and measuring equipment for continuously record of the results. Calculation of the distribution of local current in the sample are performs after field measurement, wherein the results of calculation displayed in a continuous mode (Figure 2(b)). The control of process of scanning and visualization of current paths is done by software package that was created by the authors of this work in an environment LabView. The programs of recovery of current paths from magnetic data were done in the FORTRAN language. Standard tools of LabView performed overall system control, data collection, organization and analysis, as well as the display of the computer control in real time. For general statistics for lengthy tape, a linear current distribution along the tape to identify areas with reduced current-carrying characteristics, at the same time made the visualization of two-dimensional surface distribution of the components of the current in the sample, which revealed the localization of the found current defect and allowing to define its geometry and possible causes of creation of defects.
|
a) |
b) |
|
|
|
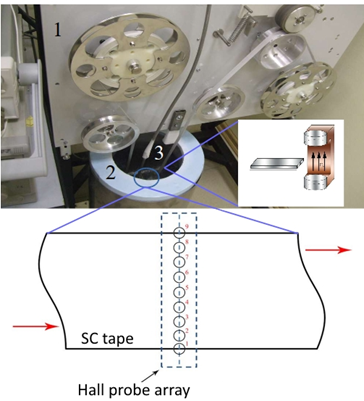
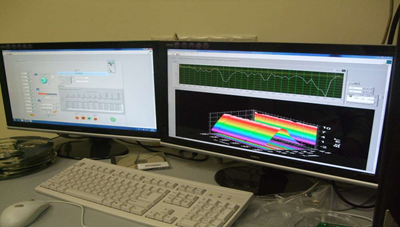
Fig. 2. An experimental setup.
a) A measurement system. 1 – reel-to-reel system with SC tape; 2 - cryostatting system; 3 - measuring system and the magnetization system;
b) The set-up for calculating and displaying of the results.
4. Results
A lengthy tape based on YBCO (width 12 mm, length 516.5 m) and manufactured by SuperOx Roebel cable on the basis of the tape were chosen in this paper to demonstrate the results of measurements of the trapped magnetic flux tape and restore the critical current distribution patterns: Figure 3 shows the direct magneto-metrical data and local distribution of currents in the Roebel cable. The geometry of the Roebel cable shown in the Figure 3(a) and it is typical for this type of cable. Individual tapes are stacked so that the current in each tape alternately flowed in from the right and left sides of the cable. Figures 3(b), 3(c), 3(d) show the distribution of the trapped magnetic flux piece of cable distribution and the calculated current components along and across the cable. Clearly visible region of the transition from one belt end to the other and the occurrence of the transverse current component, while at the same place of the current component decreases along the cable, while maintaining the value of the total current in the ribbon. These results demonstrate the potential of the method for objects with complex geometry.
|
|
|
|
a) |
b) |
|
|
|
|
c) |
d) |
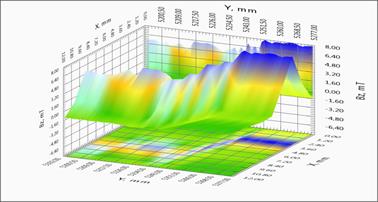
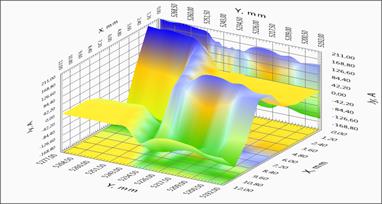
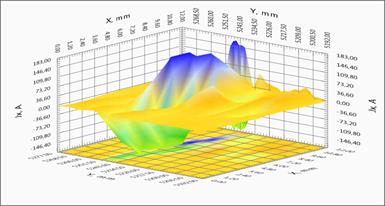
Fig. 3. The geometry of the Roebel cable. Distribution of the magnetic field and induced currents in the SC tape.
3(a) - Geometry of Roebel cable;
3(b) - Dependence of the field component BZ(X, Y) on the position;
3(c) - Dependence of the JY(X, Y) component of the current along the tape;
3(d) - Dependence of the JX(X, Y) component of the current across the tape.
The studies of long-length straight tape were done for a more detailed study of the possibility of investigation of local inhomogeneities. Figure 4 shows both direct magneto-metrical data and local current distribution on the long fragment of SC tape. One can see clearly visible geometric features of the structure and the transition region tapes.
For ease of analysis of the characteristics of a lengthy tape a full linear distribution of the critical current along the sample is presented in the Figure 4(a). It may be possible to select regions with high uniformity of current-carrying characteristics, but there are regions with significantly lower critical current value. Such areas with the presence of defects or damage of the superconducting layer can contribute significant limitation of the critical current along the tape. The spatial distribution of the magnetic field and the current components of the two regions with different current flow defects are shown more detail in Figures 4(b)-4(d). For clarity, a homogeneous area with small defect (x = 264,7 m) and sharply inhomogeneous section (x = 116,5 m) were selected (see Figure 4(a)). The results indicate the presence of redistribution of the current in the sample. The physical picture of redistribution of the current is more clearly observed on the image of level lines of the various components of the current in the tape (Figure 4(c), 4(d)).
|
|
|
|
a) |
|
|
|
|
|
b) On the left- homogeneous area with small defect; on the right - the heterogeneous portion of the tape.
|
|
|
|
|
|
c) On the left - a homogeneous area with small defect; on the right - inhomogeneous section |
|
|
|
|
|
d) On the left - a homogeneous area with small defect; on the right - inhomogeneous section |
|
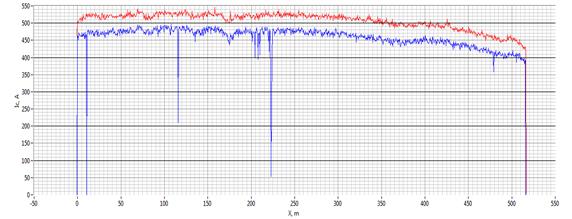
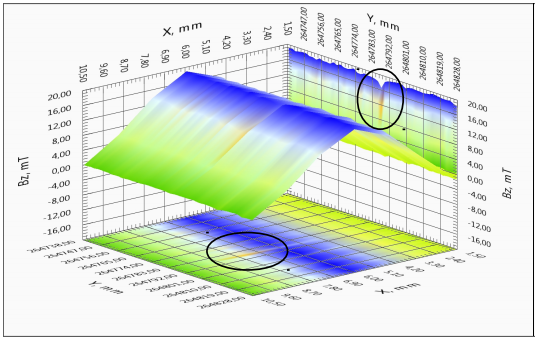
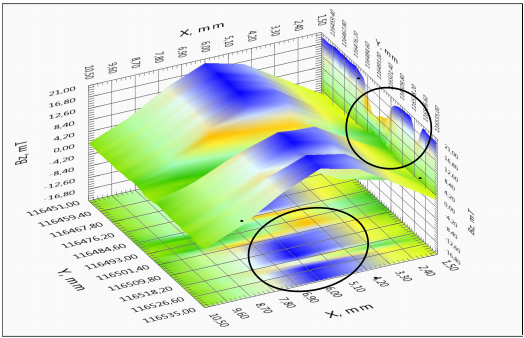
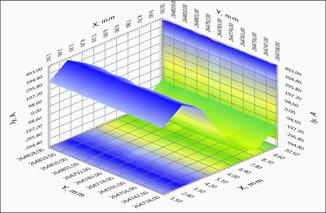
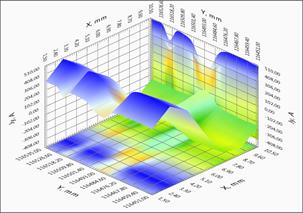
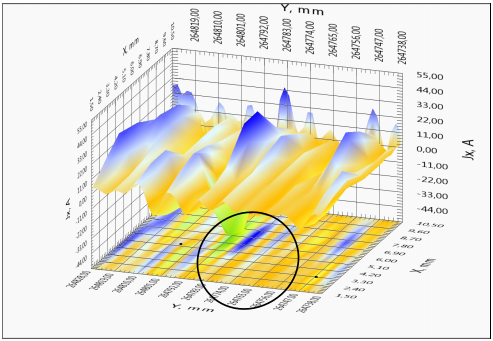
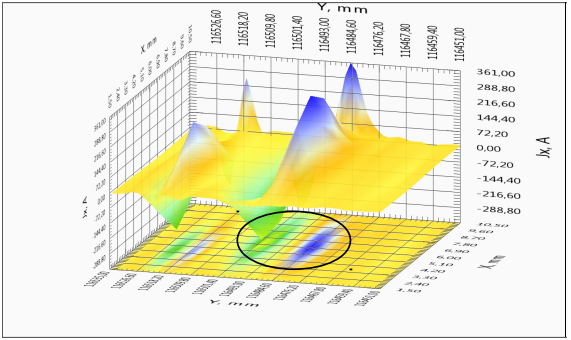
Fig. 4. The distribution of the magnetic field and the induced currents in the SC tape.
4(a) - Linear distribution of the critical current along the belt, red curve - the maximum value, the blue - the minimum value of current portion of the tape
4(b) – The dependence of the field component BZ (X, Y) on position for uniform and nonuniform portions of the tape. Isolated areas of inhomogeneous current flow.
4(c) - The dependence of JY(X,Y) component of the current along the tape for uniform and nonuniform parts of the tape
4(d) - The dependence of JX(X,Y) component of the current across the tape for uniform and nonuniform portions of the tape. Isolated areas of inhomogeneous current flow.
If the sample was perfectly homogeneous, the lines of induced currents are parallel to the longitudinal axis of the tape, and since the currents induced in the sample are closed, the current component JX(X,Y) is antisymmetric with respect to the central longitudinal line of the tape. Current flows in one direction on the right half of the tape and vice versa on the left half. Parallelism current lines are observed also in Figure 4(b) for a homogeneous area of the tape. For inhomogeneous region with defect of more than 50% in amplitude the antisymmetry exists as well (Figure 4(c)). The most informative indicator of heterogeneity is the current component JY(X, Y), which is zero for an extended homogeneous region of SC tape. The current component JY(X, Y) has an extremes near the local homogeneities (cracks, inclusions of non-superconducting, superconductor areas with low critical current value, etc.). It may be clearly seen on the transverse component of the current the appearance of small-amplitude flow of current, and the presence of extensive damage to the tape with a significant suppression of the critical current tape (Figure 4(d)). More detailed method of recognizing defects was presented in [5].
We have investigated the question of sustainability assessment procedure failure for one or more Hall sensors in the array. A large amount of measurement should be carried out with minimum delay and re-scan of lengthy tape in case of failure of multiple sensors in the measurement process requires a considerable time. The possibility of theoretically fill the information from the faulty sensor without loss of quality measurement significantly improves the reliability of the entire measuring system.
The method consists in performing the
interpolation/extrapolation of the damaged sensor on the based on the reading
values of the next working sensors. Such an interpolation/extrapolation is done
within the critical-state model of a superconductor. We should expect a
different sensitivity to the location techniques spoiled sensor. Indeed, on the
border of a thin strip with a current the vertical component of the magnetic
field becomes infinite (sharp maximum in a real experiment), and the
replacement value of the extrapolation of data neighboring sensors gives
serious deviation from the original data extrapolation. At the same time, the
derivative component ![]() in
the transverse direction in the center of the ideal tape SC is zero (dBZ(X,Y)/dY=0,
Y=a/2) and the interpolation value does not deviate substantially from
exact value. The influence of shutting down of the sensors on final results was
studied for the same sample, and data are presented in detailed in the Figure
4. There have been two series of measurements - one with a one broken sensor
disposed at various locations of sensors array, and with two broken sensors
adjacent to each other. In the first series the sensors with the numbers 2 and
3 were sequentially disconnected (numbering of the sensor shown in the Figure
2(a)). As a consequence there was a slight change in the results of calculation
of the current amplitude (less than 5%), and current location coordinates of
the defect and its size were coincided completely. Examples of the transverse
component of the current distribution for uniform and nonuniform section of
tape are shown in the Figure 5.
in
the transverse direction in the center of the ideal tape SC is zero (dBZ(X,Y)/dY=0,
Y=a/2) and the interpolation value does not deviate substantially from
exact value. The influence of shutting down of the sensors on final results was
studied for the same sample, and data are presented in detailed in the Figure
4. There have been two series of measurements - one with a one broken sensor
disposed at various locations of sensors array, and with two broken sensors
adjacent to each other. In the first series the sensors with the numbers 2 and
3 were sequentially disconnected (numbering of the sensor shown in the Figure
2(a)). As a consequence there was a slight change in the results of calculation
of the current amplitude (less than 5%), and current location coordinates of
the defect and its size were coincided completely. Examples of the transverse
component of the current distribution for uniform and nonuniform section of
tape are shown in the Figure 5.
|
|
|
|
a) Homogeneous region without one of the sensor (left) |
b) Inhomogeneous region without one sensor (right) |
Fig. 5. The distribution of the transverse component of current for uniform and nonuniform parts of the tape in case of damage of one sensor in the line
In the second series of experiments the pair of sensors (2 and 3) were disconnected (Figure 2(a)). Examples of the transverse component of the current distribution for uniform and nonuniform section of tape are shown in the Figure 6. Comparison of the results obtained with the full and partially damaged array of Hall sensors shows that even in case of failure of two adjacent sensors correctness of the results are maintained. Both single defect and extended defect are still uniquely fixed and the amplitude of the current is determined correctly. There are a distortions in the geometrical dimensions of the region of flow of a current (expansion across the tape) and slightly in the magnitude of the current in the region of current defect.
|
|
|
|
a) Homogeneous region without two sensors (left) |
b) Inhomogeneous region without two sensors (right) |
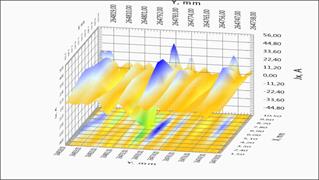
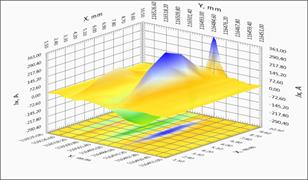
Fig. 6. The distribution of the transverse component of current for uniform and nonuniform parts of the tape in case of damage of two sensors in the line.
5. Conclusion
This paper presents new results of the development and application of science-based method of imaging of local current flow in the superconducting tape and Roebel cable with complex geometry. The possibility of using of an inversion algorithm for solving the equations of the Biot-Savart-Laplace involving critical state model are shown for the study of local superconductor current-carrying characteristics of superconductors. The results of using the experimental setup are presented and it is shown that such a setup allows provide continuous operation test of lengthy (over 100 m) HTS tapes on the basis of measurements of the magnetic field line by Hall sensors and carry out the visualization of current defects. The stability of a mathematical algorithm and the hardware and software implementation of the system of measurement and calculation to emergency situations in case of failure of one or two adjacent transducers Hall are investigated as well.
The work was done in NRNU MEPHI under financial support of the Ministry of Education and Science of the Russian Federation (Project #14.575.21.0050 (RFMEFI57514X0050))
References
1. Second-Generation HTC Conductors, by A. Goyal; ISBN 978-1-4020-8117-0.
2. Ch. Jooss, J. Albrecht, H. Kuhn et al, Rep. Prog. Phys., 65, 651(2002).
3. C. P. Bean, Rev. Mod. Phys., 36 , 31 (1964).
4. S.V.Pokrovskiy, I.A. Rudnev, A.I. Podlivaev, Physics Procedia, 36, 1558 (2012).
5. I.A. Rudnev, S.V. Pokrovskiy, A.I. Podlivaev, IEEE Trans. on Appl. Supercon., 22, 9001304(2012).