METHOD FOR VISUAL REPRESENTATION OF TECHNICAL DOCUMENTATION’S COMPLETENESS
Ya.B. Kalachev, E.S. Klyshinsky
Moscow Institute of Electronics and Mathematics of the National Research University “Higher School of Economics”
rusfund@gmail.com
eklyshinsky@hse.ru
Abstract
The article describes a new method for visual representation of report document’s completeness during their acceptance. Report document’s completeness is being checked according to its original technical documentation (or technical statement). The base of the method is searching of key words (markers), which determine the introduction of a term and define borders of an important fragment. Selected fragments are divided into collocations of fixed size and added to a special list. The report document is also divided into fragments, which are compared with important fragments of technical documentation using selected collocation list. Every fragment of the report gets measure of similarity during the comparison. The measure helps evaluating the amount of the useful data in each paragraph. The compared text is represented as a dot-diagram compiled from the whole document. Besides the dot-diagram, that shows presence or absence of collocations in the text, we used another type of diagram showing links between fragments of report document and technical documentation. Every fragment of the technical documentation is assigned to a unique color that sequentially changes along the technical documentation’s diagram. We used the same color to show the similar fragment of report documentation. Reinforced by this visual information, an expert can easily make decision on the report’s quality. Besides expert can get a required fragment of text for a closer examination. The described method of visualization allows the expert to determine, if the considered report can be either easily rejected because of lack of useful information, or can be used for closer examination. Note, the described method can be applied to documentations and reports written under specific format only. The technical documentation should include the requirements to the form and content of report document, but not to the main concepts that it will be described.
Key words: Document examination, automatic text processing, visualization results
- 1. Introduction
- 2. Method of analysis of the report documentation’s completeness
- 3. Experimental results
- 4. Conclusions
- References
1. Introduction
The process of technical documentation acceptance can be viewed as a process of visual analysis of text information: an expert has to check the documentation in hand and make a decision whether it applicable or not. However, the effectiveness of such visual analysis is rather low. The expert waste too much time for reading, analysis and comprehension of the text. This situation can be explained by the fact, that qualitative text analysis is possible only if the expert uses all of his analytic abilities such as verification report document fragments, comparison of different fragments, visual representation of significant pats of text of technical documentation and verification of results with given tasks in whole.
Note, that not any documentation needs such an attention. In some cases contractor tries to pass documentation with “method of successive approximations”. Applying this method, contractor corrects just these parts of documentation, which was marked by the expert. At the same time, the quality level of such changes can stay at the same low level not making dramatically changes of the situation. Overall signs of progress can be noticed (text of the report has been changed), but report still does not meets some important requirements, which were the reasons the report was created. The contractor hopes that after few iterations the client will gave up and decide that it is easier to improve documentation on his own, rather than waste his time on checking.
Note, that this situation is absolutely unacceptable in case of both contractor and developer are working according to CALS-technologies. CALS-technology (Continuous Acquisition and Lifecycle Support) [1, 2] is a modern approach towards engineering and design of production, which implies the usage of computers at every stage of the product lifecycle. Using of this technology leads to reduction of the time and decreasing a cost of production, since the descriptions of all elements, mechanisms, technological and any other processes are stored in digital format and can be easily found and reused in process of design of new products or the exploitation of old ones. That adds additional requirements to documentation, which should describe the object in the way it could be modified, created a new one or maintained without any consultations with designer. Thus, there is a big necessity to create an automatized system for helping an expert in early estimation of similarity between report and technical documentation. The system must divide document into fragments, evaluate their similarity, and visualize the results of such comparison. The expert evaluates the level of the likeness of report and requirements according to acquired visual representation and makes a decision on further analysis of selected document’s fragments. Thus, the expert will provide the visual analysis of results of processing of textual information.
The development of such system requires using of methods for natural language text analysis. Note, that methods of plagiarism [3] or fuzzy duplicates [4] detection cannot be used in this method directly. The plagiarism detection methods are based on searching of similar fragments for selected text fragment in other documents. Fragment comparison can be implemented as a simple or fuzzy strings comparison, which allows insertion, deletion or shuffle of words. Methods of fuzzy detection of duplicated documents are based on a calculation and a comparison of values of a function over the given text. At the same time the level of similarity determined using the probability of texts’ similarity. The searching method for fuzzy duplicates processes a document faster, however it doesn’t implies selection of text fragments. These methods can be used only for determination of self-quoting of previous reports or borrowing others text. It can be authorized method in some cases, as client can be interested in all available information with minimal changes.
Another area here is the development of formal text models [5]. Such models imply the using of different kinds of systems, which presents the information about domain knowledge. One of the papers, describing a method of formalization of the system specification, is the paper [6]. The model proposes constructing of domain knowledge in form of frames on the first stage. Then, these frames should be automatically filled using the text analysis results. Completeness of this frames characterizes completeness of description. The experience shows that using of such methods implies the presence of the variety of knowledge domain ontology, describing determination of knowledge domain and showing connections between them. Creation of such ontology by own forces is a long process (that is why developers often do not have access to domain ontology). The state of the art survey of automatic ontology creation is present in [7]. Such methods are based on clustering of similar terms in semantically connected groups or on analysis of the present explanatory dictionaries (e.g., on the currently biggest one– Wikipedia). But this researches can described as subsidiary.
Because of the lack of from-the-shelf solutions, we have developed a new method of evaluation of report document’s completeness, which helps an expert in making decisions.
2. Method of analysis of the report documentation’s completeness
The analysis of report documentation’s completeness is conducted in into three stages. On the first stage, the important fragments, which contain some basics terms of a knowledge domain, are selected from the text of technical documentation. On the second stage, the report’s text is divided into fragments, which are compared with the identified fragments of the technical documentation. If a fragment have the same terms as the text of technical documentation, then it can be assumed, that this fragment contains some aspects of problem definition. In the third step, the expert receives the results of calculation in a visual form for evaluation of the degree of similarity between the report and technical documentation.
Different methods are used for extraction of terms of the knowledge domain. One of them is the measure of weirdness [8] that is calculated as a ratio of frequency of appearance of a term in an analyzed document to its frequency of appearance in some collection of documents. The higher value of weirdness measure denotes the specifity of this word or collocation in the analyzed document and the higher probably that it is a term of the knowledge domain [9, 10]. The usage of such measure is very difficult, since it do not extract the terms only, but names of organization, departments, and proper names as well that cause some noise in results.
Another method is the usage of thesaurus [11], i.e. special dictionaries of domain terminology. However, that kind of dictionaries is not always available as well as ontology, and its development takes too much time.
Thus, we have decided to use syntax patterns for terms extraction. Such methods have already been used, for example, to extract the terms from Wikipedia [12]. The foundation of this method is searching of keywords and collocations (markers), that determines the introduction of a term. In our case, we find terms that are entailed to requirements formulation in the text of technical documentation.
Let us define a sentence that contains marker-words as important one. The important fragment is defined as a continuous block of sentences, with one or more important sentences. According to our experiments, the important fragment should consists of one additional sentence to left and one additional to the right of the sentences containing one or many key-words. If there is an enumeration after the found important sentence, than all objects of enumeration should be taken into consideration. Selected important fragments are divided into collocations of fixed size and added to the special list. Only the adjacent words which are not divided by punctuation marks can be added to this list. An example of sentence division onto collocation can be seen on Fig.1. The red color denotes stop words, which do not form collocations, and the green color shows important words, that formed collocations.
![]()
Fig. 1. Example of sentence division
An independent list of collocation is created for every fragment. All collocations having frequency of appearance more than 85% and less than 15% of frequency of most frequent collocation are deleted from the formed list. Such division helps to remove garbage and unnecessary data. The formed list is considered as a key list of technical documentation attributes which helps as to determine similarity with report documentation.
On the second stage, the considered report is divided into fragments, which are compared with important fragments of technical documentation using selected collocation list. After such division, the similarity is calculated for every selected fragment of the document. The similarity can help evaluating amount of useful data in every fragment. As a measure of similarity, we used the cosine metrics, which is well proven in automatic processing of natural language texts [13]. The cosine similarity is defined as following.
Let two documents have their vectors of word appearance frequencies figured out as a and b. These vectors are determined upon a set of all words of these two documents. In this case, the cosine similarity of two documents is determined as following
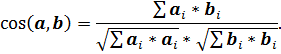
Using the calculated numbers, we can find number of the fragment of technical documentation that corresponds to maximum cosine similarity for the fragment of report documentation. Thus, every fragment of report documentation can be connected with the number of fragment of technical documentation. This information will be visually presented to the expert to make a decision about informational completeness of report document.
On the last step, the expert is provided by information about the coverage of report by technical documentation’s fragments. The method of similarity of fragments evaluation makes its evaluation with some uncertainty. Thus, in order to increase the quality of making of decision, the expert can be provided by more detailed information such as similarity of important (from the expert’s point of view) technical documentation fragments, list of their connections, list of collocations etc. The expert is also provided by overall estimation of similarity of two documents that is calculated as a number in scale from 0 to 1.
3. Experimental results
In order to check the efficiency of developed method, we used in our experiments six technical documentation and nine technical reports. The results of cross-check of technical documentations and reports can be seen in Table 1. These documents were grouped as following:
· Technical documentation 1, 2, 3 share the similar theme;
· Technical documentation 5 and 6 share similar theme, but not connected with 1, 2, 3;
· Report 0 has nothing in common with any theme of reports 1-6.
Reports 3+ and 6+ are revisited versions of reports 3 and 6 accordingly, which were modified because of the client request.
During our experiments, we used two words collocation and standard set of keywords. The gray color in Table 1 means more similarity of technical documentation and report. White background means absence of similarity.
Table 1. Results of cross-check
|
|
Technical documentation |
||||||
|
1 |
2 |
3 |
4 |
5 |
6 |
||
|
Reports |
1 |
0,521 |
0,157 |
0,192 |
0,032 |
0,025 |
0,072 |
|
2 |
0,394 |
0,592 |
0,543 |
0,056 |
0,054 |
0,062 |
|
|
3 |
0,37 |
0,39 |
0,158 |
0,05 |
0,049 |
0,05 |
|
|
3+ |
0,494 |
0,45 |
0,535 |
0,045 |
0,051 |
0,054 |
|
|
4 |
0,032 |
0,032 |
0,066 |
0,032 |
0,002 |
0,031 |
|
|
5 |
0,032 |
0,009 |
0,02 |
0,307 |
0,057 |
0,095 |
|
|
6 |
0,006 |
0,011 |
0,007 |
0,002 |
0,031 |
0,638 |
|
|
6+ |
0,006 |
0,009 |
0,006 |
0,002 |
0,016 |
0,725 |
|
|
0 |
0,011 |
0,043 |
0,035 |
0,006 |
0,006 |
0,017 |
|
As it seen in Table 1, the developed method determines high quality of report documents for technical documentations 1, 2, 3+ and 6. At the same time results for reports number 3 and 6 are coincide with client opinion. Report 0 shows no similarity with any technical documentation.
Technical documentation number 4 and 5 did not contain detailed description of the work results and requirements. The goal of technical documentation 5 was giving recommendations about product improvement (without any requirements to the result, but only to its quality), what made the similarity search more difficult. Report 4 contains information in the knowledge domain of technical documentation number 5, what results in their similarity.
However, the measure of similarity is just a number for the user. This number cannot give the detailed information about the completeness of report without any comparative characteristics. Given measure rather shows informational completeness of report, instead of the requirements description level. High measure of similarity may comply with the report which lacks a part of client requirements (e.g. because of the second half of requirements will be described in another document). The report with calculated measure about 0,5 may contain the description of all requirements but gives too many useless information. In this connection, it is important to develop a method of simple and clear visualization of technical report’s completeness. User should be able to understand whether he needs to check the report and find the information about all missing parts as far as possible.
A dot-diagram compiled from the whole text of document was selected as a form of visual representation. Every dot represents 100 symbols of a text. Every line contains 100 dots, which means that every line equals 10000 text symbols. Thereby large documents can be arranged in form of useful images. Example of such diagram represented on Fig. 2
The resulting algorithm calculates for a user three different diagrams:
· position of key words in technical documentation;
· important collocations in report by whole text;
· important collocations in report by fragments.
Fig. 2 and Fig. 3 represent two technical documentations analyzed by the introduced method. Green squares on these diagrams represent text fragments containing keywords.
Fig. 2 shows diagram for technical documentation that was made incorrectly from the point of view of expert who has read technical documentation. This report contains a lot of useless information and important fragments are located in different parts of text. This information became clear while analyzing the diagram: here is small amount of green dots, dispersed about all diagram calculated for a rather large text.
Document’s requirements represented on Fig. 3 are promptly written in the beginning of document. The final part of technical documentation refers to terms of development, requirements of workplace and interface. Dense amount of dots can be seen in the beginning of diagram. Although, the amount of important fragments in the first and second examples are almost the same; the second variant is more precise because of text compression and exactly expressed requirements.
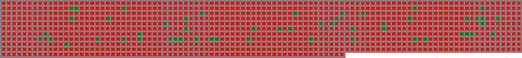
Fig. 2. Dot diagram of poorly written technical documentation
![]()
Fig. 3. Dot diagram of well written technical documentation
Fig. 4 represents a case of technical documentation that was written in a brief form (technical note) and containing the least of requirements only.
![]()
Fig. 4. Example of dense requirements in technical documentation
Figures 5 and 6 represents another reports analyzed by our method. These documents contains annual reports written by developers about development of an information system. Green dots on these diagrams are representing fragments containing important collocations. Compact blocks of green dots are describing requirements taken from the technical documentation. Single green squares are often representing an only collocation in the bounding text (for example, a title).
It can be seen on Fig. 5 that there are no any blocks larger than five dots. That means that report does not have paragraphs fully devoted to the realization of requirements stated in papers. There were only 470 collocations connected to the technical documentation found through 130 000 symbols of report (note, that this number includes single titles). The maximal length of a text on the same topic that was joined into one important fragment was just 700 symbols (i.e., less than half a page). An expert proving this report states, that this report does not contain a lot of useful information and should be improved. Therefore, examination of the given text by the expert brought us to the same results as our algorithm.
A well-written report is presented on Fig. 6. Important collocations are appearing everywhere except the beginning (introduction, authors, content). There were found more than 3500 collocations in the report of 130 000 symbols length. The maximal length of a text fragment containing important collocation was about 1500 symbols.
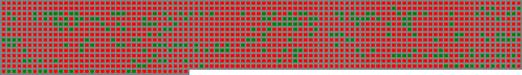
Fig. 5. Dot diagram of poorly written report
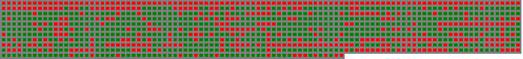
Fig. 6. Dot diagram of well written report
Besides the dot-diagram, that shows the presence or absence of collocations in text, we used another kind of diagram that shows connections between fragments of a report document and a technical documentation. Each text fragment of technical documentation assigned by its own unique color that appears in the report document’s diagram in corresponding fragments. Fig. 7 and Fig. 8 show new diagrams for reports described above. The color changes from blue to green depending on fragments number. As requirements are written sequentially and normally are logically connected, it can be assumed that the closer colors are related to logically closer text fragments.
There are noticeable big squares of similar color group on Fig. 8. That means that given text fragments was mentioned in compact placed requirements of original technical documentation. Assuming that sequential and neighbor requirements are similar, we can conclude that text about their realization should be close enough, as seen on a diagram on Fig. 8
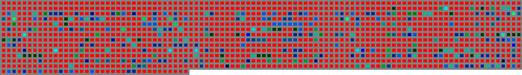
Fig. 7. Colored fragments
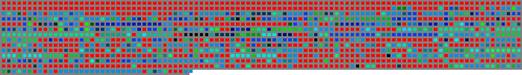
Fig. 8. Similarity of fragments of a well-written report
In case of developer tries to delude client intentionally by increasing the size of report’s text in hope that expert won’t be able to read the whole report paper, our algorithm shows a diagram like presented on Fig. 9.
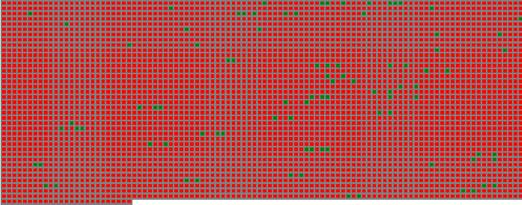
Fig .9. Blank report
Provided by such results visualization, the expert can easily find out, which report is worth of his attention. Besides that, the expert can get a required fragment of text for a closer examination. Combining this information and statistic about missing and found fragments of original technical documentation in the text of report document, the expert can easily find out requirements that were not completed or not described in a report.
4. Conclusions
Described method of visualization allows successfully determining whether the acquired report needs a close examination or just a brief inspection can detect some useless information.
Note that described method works only on documentations and reports written under specific format. Technical documentation should include a number of requirements to the form and content of report document. If content of the work differs from requirements (e.g., in case of development of recommendations about the improvement of object without given the real characteristics, as it was shown above) the method will be useless and will provide erroneous results. Additional problems would be caused by processing of numerical tables, pictures and other non-text information that frequently consist the main report information and project result.
The method show its efficiency during the work within described restrictions. Having such visual information, an expert has a possibility to take decisions on technical report’s completeness by studying several fragments of a text only. Note, that while working with good (from the point of view of our algorithm) reports there is still a necessity to examine attentively the contents of report document and an expert still bears responsibility for all his decisions.
References
1. Norenkov I.P. - Basics of CALS-technologies. Textbook. Bauman MSTU. - http://bigor.bmstu.ru
2. Yablochnikov E.I., Milkman V.I., Mironov A.A. - FDI technology in instrument: Textbook. - St. Petersburg: St. Petersburg State University of Information Technologies, 2008. 128 p.
3. M. Romanov, DA Zhitlukhin - Implementation of "Anti-plagiarism" in the Russian State Library / / Proc. works of the 11th All-Russian Scientific Conference RCDL'2009.
4. Zelenkov Y.G., Segalovich I.V. - Comparative analysis of methods for duplicate detection WEB-documents / / Proc. Transactions of the 9th All-Russian Scientific Conference RCDL'2007.
5. Tarasenko A.V. - Development and research methods and models of automatic check texts for compliance with technical documentation: the dissertation for the degree of doctor of technical sciences, specialty 05.13.17. Taganrog, 2009.
6. Volkova G.A. - Creation of "ontology of everything." Classification problems and solutions / / Proc. works of scientific and practical seminar "New information technologies in automated systems." - 2013. - Pp. 293-300.
7. Zaboleeva-Zotova A.V., Orlova Y. - Automation of semantic text analysis of technical specifications / / Proceedings of the Volgograd State. Technical University. 2007. T. 9. № 3. Pp. 52-55.
8. Ahmad, K.; Gillam, L.; and Tostevin, L. - University of surrey participation in trec8: Weirdness indexing for logical document extrapolation and retrieval (wilder). In The Eighth Text Retrieval Conference (TREC-8).
9. Braslavsky P., Sokolov E. - Comparison of four methods for automatic extraction of two-word terms from the text / / Computational Linguistics and Intellectual Technologies: Proceedings of the Intern. conf. Dialog'2006. Moscow: Russian State Humanitarian University in 2006. Pp. 88-94.
10. Klyshinsky E.S., N.A. Kochetkova - Extraction method of technical terms using a measure of strangeness / / Proceedings of the scientific-practical seminar "New information technologies in automated systems-17." Keldysh them. MV Keldysh, 2014. Pp. 365-370.
11. Lukashevich N.V., Logatchev Y.M. - Using machine learning techniques to extract words, terms / / In.: Eleventh National Conference on Artificial Intelligence with CAI 2010.
12. Bocharov V.V., Pivovarova L.M. - Wikipedia as a resource to supplement the ontology / / Proceedings of the scientific-practical seminar "New information technologies in automated systems-13." M. MIEM 2010. Pp. 60-61.
13. Manning K.D., P. Raghavan, H. Schutze, Introduction to Information Retrieval. - M. Williams, 2011 - 528 p.