VISUALIZATION OF SEMANTIC RELATIONS IN MULTI-AGENT SYSTEMS
A.A. ARTAMONOV, D.V. LEONOV, V.S. NIKOLAEV B.N. ONYKIY, L.V. PRONICHEVA, K.A. SOKOLINA, I.A. USHMAROV
National Research Nuclear University MEPhI (Moscow Engineering Physics Institute), Moscow, Russian Federation
AAArtamonov@mephi.ru, DVLeonov@mephi.ru, VSNikolayev@mephi.ru,BNOnykij@mephi.ru, LVPronicheva@mephi.ru, KASokolina@mephi.ru, i.ushmarov@gmail.com
Contents
· 2. Visualization of world cluster of subject-related information sources
· 3. Visualization in the form of semantic networks
Abstract
The paper reviews issues of data visualization in Multi-agent information analysis systems in scientific and technological areas. Two basic models of visualization – tabular and network – are reviewed in detail. The paper focuses on issues of visualizing database objects as well as different kinds of relations between them.
Keywords: information technologies, multi-agent systems, corporate networks, semantic networks, cloud structures.
Agent-based technologies are used more and more widely in modern information analysis systems of various designations [1],[2],[3].
Here an agent-based technology refers to a regular target-oriented automated search of information on a preset cluster of Internet websites. An agent is a network search engine driven by the following data:
· Agent owner’s name and address for regular delivery of news, theme-related information and applying for instructions in case of emergencies;
· Search prescriptions and keywords from the thesaurus of subject area in preset national languages;
· Websites in the cluster for scanning;
· Subject cluster scanning timetable.
These definitions of a search agent and agent-based technologies match the definition accepted by the Foundation for Intelligent Physical Agents Standards Committee (FIPA) [4]
A review of agent-based technology applications [5] states that most of known applications are related to solving problems of remote control and management, targeted aggregation and arrangement of data from various information sources, integration of data over time and space, marketing research and etc.
This paper is related to a different kind of software – Multi-agent information analysis systems (MIAS) in scientific and technological areas. As a result of development and experimental operation of such system in the National Research Nuclear University MEPhI (NRNU MEPhI – Moscow, Russia) the authors came to the following conclusion: the main purposes of MIAS are formation, modification and practical application of knowledge bases in preset subject-related directions. Therefore, MIAS must have advanced means of visualization – not only for objects, but also for different types of relations between them. On a certain abstraction level this problem can be regarded as a problem of graph model visualization, abstracting from physical sense of graph vertices and edges [6]. Such approach is fully justified only for developing instrumental programs for visualizing graphs or networks.
In subject-related MIAS databases one cannot abstract from physical sense of the network model. Semantic networks are considered as fragments of knowledge, to which all technological stages of data processing are applied: formation, storage, search, data modification within the network, operations on networks.
In this paper the authors describe how to solve problems of visualizing semantic relations in the form of tables and semantic networks.
2. Visualization of world cluster of
subject-related information sources
With the rapid development of the Internet, the number of open scientific and technological information sources has grown considerably. Conventional sources are now supplemented by websites of universities, scientific centers, laboratories, academic subdivisions, informal working groups and, finally, experts. These new sources of information turned out to be attractive to specialists in different subject areas, because news items appear on these websites several months earlier than in journals. Direct dialog with the authors is also available. However, along with the growth of potentially accessible data sources, information scattering takes place. As a consequence, time and labor input for information search also increases formidably.
Agent-based technologies relieve specialists from such efforts. World clusters of subject-related information sources are displayed in the respective databases, where websites for setting search robots on a particular subject are displayed as attributes.
Let us consider the problems of visualization of similar databases on the example of the database of the World Scientific-Exploratory and Technological organizations on Plasma Physics. This database was created by Department #21 of Plasma physics and Department #65 of Competitive systems analysis, National Research Nuclear University MEPhI, while working on a project under the Federal Program “Scientific and Educational Personnel of the Innovative Russia”. The database is registered in the Russian Federal Service for Intellectual Property, certificate of registration № 2014620346.
Everyone interested can access the full database via the official website of Department #65 “Competitive systems analysis” – http://kaf65.mephi.ru.
The above-mentioned database is a structured archive of information on scientific-research and technological organizations and their subdivisions taking part in plasma physics research all over the world. The database contains primary contact information and a list of sources to monitor organization websites in order to obtain relevant news items on current research.
Fig. 1 represents the macrostructure of the “World scientific-research and technological organizations on plasma physics” database.
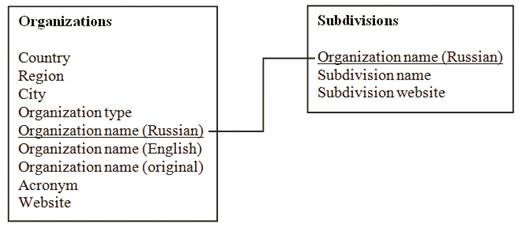
Fig. 1. Macrostructure of the “World scientific-exploratory and technological organizations on plasma physics” database
From fig. 1 one can see that the existing database can be naturally expanded by introducing other objects – specialists – and tabular visualization of their relations with the existing objects – organizations and subdivisions.
Tables 1 and 2 represent types of data describing objects of Organization and Subdivision type. These tables demonstrate the essential feature of the database – multilingualism.
Herefrom follows the evident rule for developing search prescriptions for robots – they must be composed in the language of the website being analyzed.
Table 1. Types of data for objects of Organization type
|
Field name |
Type of data |
Description |
|
Strana |
mediumtext |
Country |
|
Region |
mediumtext |
Region |
|
Gorod |
mediumtext |
City |
|
Tip |
mediumtext |
Organization type |
|
Rusname |
text |
Organization name (Russian) |
|
Engname |
text |
Organization name (English) |
|
Forname |
text |
Organization name (original) |
|
Shortname |
mediumtext |
Acronym |
|
Website |
longtext |
Website |
Table 2. Types of data for objects of Subdivision type
|
Field name |
Type of data |
Description |
|
Rusname |
text |
Organization name (Russian) |
|
Subdivision |
text |
Subdivision name |
|
Depwebsite |
text |
Subdivision website |
An example of tabular visualization of Organization-type objects is represented in figure 2.
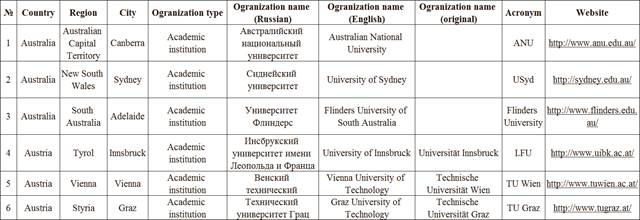
Fig. 2. Fragment from the table of Organization-type objects
Figure 3 represents a fragment from the second database – the table of Subdivision-type objects. Websites of subdivisions contain information on the subject of investigation (plasma physics) and are used to set up the agents.
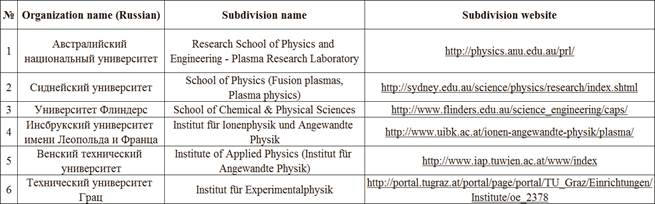
Fig. 3. Fragment of the table of Subdivision-type objects
Current database volume or, in other words, world cluster of websites of organizations doing research on plasma physics, is approximately 200. The result of agents addressing these websites while searching for news items is not always successful. Experiments conducted by the authors have shown that only 50% of websites accessed by robots provided relevant information.
Therefore agent scanning procedure optimization demands dynamic classification of scanned area and visualization of source classes, for example, following traffic light principle:
• Green light – successful regular automatic access to the website;
• Yellow light – fail to cooperate with agents for a certain reason, for example, fee-based access to the information, etc.;
• Red light – fail to cooperate with agents for an unknown reason.
It is evident, that in each of these cases system administrator has to make different decisions.
Fig. 4 shows a fragment of a modified Subdivisions table with addition of the Source availability column. The News feed link column represents web-addresses of the corresponding resources.
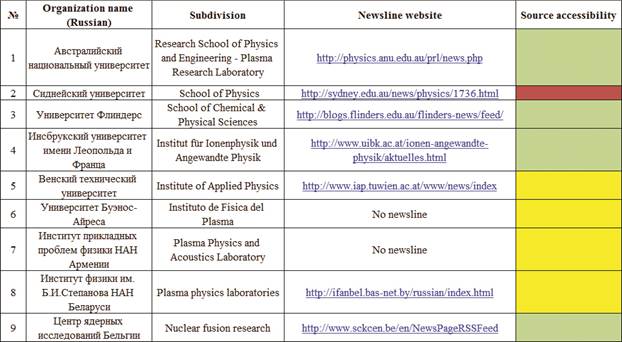
Fig. 4. Modification of the Subdivisions table with addition of the traffic light classification
The authors remind the reader that the problem of shortening the scanning routes is being solved now. For a rapid decision the operator requires only the last two columns of the table shown in fig. 5, the other columns are left for visual control of the scanning routes state.
Thus, using that sort of coloring scheme is a simple and convenient way to visualize such semantic relations as the state of the objects or its belonging to a certain class, etc.
When programming visual interfaces, there is always a question why something is represented one way and not the other. For example, why is the “traffic light” not laid upon the column of website addresses? These are the questions of computer design, which are not considered in the paper. In the example provided laying halftones decreases text readability and complicates perception.
3. Visualization
in the form of semantic networks
One of the ways to visualize knowledge is semantic networks. Such networks are directed graphs, vertices of which represent objects, and edges indicate relations between them. Any real or virtual concepts, notions, processes or properties can be the objects of the semantic network. Such networks are considered to be one of the most effective tools for data visualization and analysis due to their compactness and informational capacity.
Let us consider this type of data visualization on the example of the described above “World scientific-research and technological organizations on plasma physics“ database.
Relations between objects of the database are the following:
• Country – city (structural (general–specific) relationship);
• City – organization (geographic affiliation);
• Organization – subdivision (structural relationship).
The database can be further extended by introducing a Specialist-type object and Organization–Specialist relation.
The fragment of the semantic network on this database is presented in fig. 5.
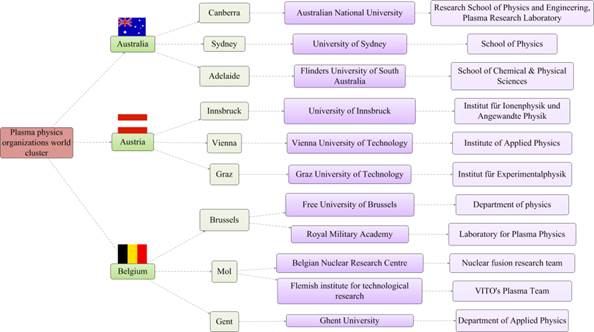
Fig. 5. Fragment of the “World scientific-research and technological organizations on plasma physics“ semantic network
While building semantic networks various colors can be used to highlight different object types. For the pictures provided the following colors were chosen:
• Red –topic/subject cluster;
• Green – country (shades of green – province, territory);
• Purple – organization (shades of purple – subdivision, structural devision);
• Blue – event;
• Grey – fact;
• Yellow – person.
The result of MIAS sources scanning is text documents, obtained from news feeds of organizations and their divisions.
As an example let us consider a news article from the ITER newsline (http://www.iter.org/newsline) presented in fig. 6.
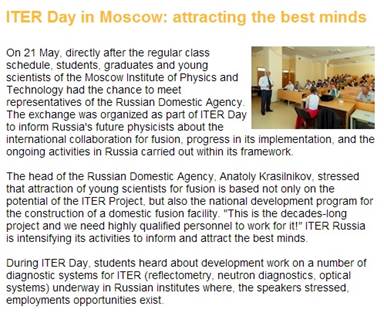
Fig. 6. An article called ITER Day in Moscow
Extracting knowledge from documents (objects, facts, relations between them) also allows building semantic networks. Thus, visualization of knowledge obtained from the article above is a graphic scheme shown in fig. 7.
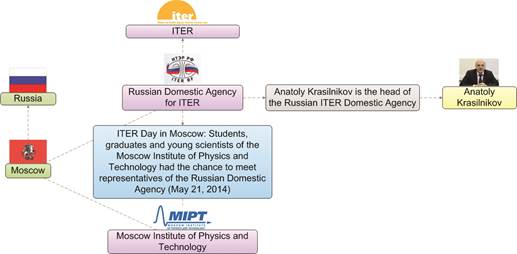
Fig. 7. Visualizing knowledge obtained from the news item.
It is evident that information presented in such a structured manner is vivid and easy to perceive.
The number of objects and relations grows
rapidly as regular processing of incoming articles takes place. It allows
accumulating diverse knowledge on the subject and trace tracing chains of relations between objects. Organizations/subdivisions
database and the agent search results are complementary.
The full network of relations in the subject area is an extensive and rapidly growing amount of data. For this reason there has to be filtering according to specific analytical tasks.
For instance, fig. 8 demonstrates a fragment of a potential network of ITER cooperation ties.
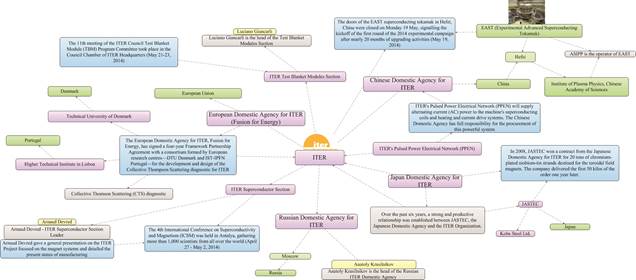
Fig. 8. Fragment of the “ITER project cooperation”
It is clear that there could be other objects and relations depicted in fig. 8, like project suppliers, received and paid invoices and etc. Thus the variety of semantic networks describing relations between objects is defined by user’s applied problems, while the software tools for developing semantic networks can remain the same.
It was mentioned above that the authors came to the problems of information visualization in intellectual agent technologies while developing and practically operating a MIAS – a Multi-agent information analysis system in scientific and technological areas.
Semantic Archive – the software solution of Analytical Business Solutions Ltd. – was used as the main tool in this paper [6].
The technical process of information analysis involves presentation of results to the user, regardless of the level of data processing procedures automation.
In this case it is equally important to rapidly look through a large volume of complex data collapsed into semantic networks and detailed analysis of database fragments represented in tables.
The authors tried to develop a system allowing to rationally combine these two approaches, preserving semantic and quantitative meanings of data in different models.
The authors would like to express their deepest gratitude to the physicists of the National Research Nuclear University MEPhI: professor Valery Kurnaev, head of the Plasma Physics department; professor Anatoly Petrukhin, head of the NEVOD centre; associate professor Victor Petrovsky, head of the Laser Technologies centre for advisory assistance in their scientific scope and providing necessary information for the initial search agents set-up.
1. Tim Berners-Lee, 2001, The Semantic Web (A new form of Web content that is meaningful to computers will unleash a revolution of new possibilities), Scientific American: May 2001
2. V.I. Budzko, D.V. Leonov, V.S. Nikolayev, B.N. Onykiy, K.A. Sokolina. Development of Information and Analytical Support for Scientific and Research Activities in the National Nuclear Research University «MEPHI» // Highly available systems. 2011. №4, vol.7, p. 4-17.
3. Lieberman H., Selker T. Agents for the user interface // Handbook of Agent Technology. – 2003. – P. 1-21.
4. IEEE Computer Society Foundation for Intelligent Physical Agents Standards Committee Policies & Procedures http://www.computer.org/portal/web/sab/foundation-intelligent-physical-agents
5. V. Kasyanov, E. Kasyanova. Information Visualization on the Base of Graph Models // Scientific Visualization. 2014. Quarter 1, №1, vol.6, p. 31-50
6. Analytical Business Solutions Ltd. official website http://www.anbr.ru/en