INFORMATION
VISUALIZATION IN INFORMATION SECURITY
MANAGEMENT FOR ENTERPRISE'S INFORMATION INFRASTRUCTURE
N. Miloslavskaya, A. Tolstoy, A. Birjukov
National Research Nuclear University MEPhI (Moscow Engineering Physics Institute), Moscow, Russian Federation
NGMiloslavskaya@mephi.ru, AITolstoj@mephi.ru
Contents
2. Main Purpose of IS Management
3. Enterprise’s II IS Information Visualization Subjects
4. Enterprise’s II IS Information Visualization Systems
5. Examples of Enterprise’s II IS Information Visualization Systems
Abstract
The necessity of visualization of information security (IS) events and incidents originating in an enterprise’s information infrastructure (II) is justified. The main IS management processes such as IS monitoring and incident management, for which information visualization is particularly useful, are highlighted. The visualization tasks and the requirements for visualization systems are listed. The examples of security information and event management systems (SIEM systems) that implement the requirements and solve the tasks are given. The relevance of the described solutions in light of the IS Intelligence emergence on the information protection systems’ market is emphasized.
Key words: Information Visualization, Information Security, Information Security Management, Information Infrastructure, Information Security Events, Information Security Incidents, SIEM systems,
Modern enterprises of different size, subordination and scope get huge amounts of data about the current state of their information infrastructure (II) and at first sight unrelated (scattered) events taking place in it. They require to be processed correctly and promptly to identify information security (IS) incidents and to define the most high-risk areas of II. This data is combined not only of the information that comes from the individual information protection tools (IPT), but also includes description of the current configuration of network devices, network traffic characteristics, running applications and network services, user-activity and specific actions of individual end-users, etc. Volumes and heterogeneity of the data to be carefully analyzed further is so large that the issue of its structured, combined (consolidated) and visualized presentation within a single intuitive interface to make timely and justified decisions in the field of IS management for enterprises’ assets rises very sharply. Properly designed to the needs of departments and IS administrators centralized real-time visualization systems of the consolidated information required for continuous monitoring of all the available II’s data sources and evaluation of the information collected in different specific contexts, acceleration of detection of the IS events affecting II, responses to them and ultimate improvement of the enterprise’s II protection can help in this matter.
Considering these needs, the IS maintenance market undergoes the transition from the simple tools of log management and SIEM systems to the systems that support the analytics in the field of IS. In English literature this area was named IS Intelligence [1]. It can be translated into Russian as “аналитика в области ИБ, разведка ИБ, интеллект ИБ”. There is no fixed Russian term yet. By parity of reasoning with the term Business Intelligence translated as «бизнес-аналитика», the term “ИБ-аналитика” seems to be most appropriate (considering άναλυτικά An.Greek — analysis skill).
The comprehensive IS Intelligence uses a variety of data describing the context of the entire II, including but not limited to the following: logs of network devices; vulnerability; configuration data; network traffic; application events and activity; user IDs and passwords; assets; geographical positioning; applied issues. Obviously, a tremendous amount of data to be analyzed and visualized is generated in this case. Therefore, the demand for developing the information visualization systems for the field of IS Intelligence is beyond doubt.
An enterprise’s II IS information visualization is designed to display the data on the II IS on the interactive screens (graphic displays) for its unambiguous interpretation, subsequent decision-making on the necessity for acute adjustment of II IS maintenance activities. Interactivity here refers to the availability of appropriate response mechanisms from the person to the data seen on the monitor screen. In order to provide effective reaction, input (response) devices should be convenient for IS administrator or analyst and have high throughput and low latency.
II IS Information Visualization, increasing possibility of its perception by a human, improves the quality of IS event detection and IS incident management intellectual processes, during which the relevant information is collected, converted, stored, retrieved and used. And, as a consequence, the II IS Information Visualization promotes the formulation of hypotheses and the accumulation of new knowledge about the event IS types, causes, relationships and consequences, which can then be used to improve the II IS and improvement of the enterprise’s IS management process in general.
A developer has to address the three major questions when designing Information Visualization Systems for an Enterprise’s II IS:
What (what information) is a subject to visualization?
How it should be presented on a monitor’s screen?
How to interpret the information displayed unambiguously?
Answers to these particular questions determine the structure of this article. The basic problems of IS management, which can be solved through II IS Information Visualization Systems, are considered to select the subjects to be visualized. Designing such systems is based on certain methods of information display and its unique interpretation. Examples of modern SIEM systems illustrate practically implemented opportunities.
2. Main Purpose of IS Management
IS is traditionally defined as a state of information protection, which is achieved by providing the following properties complex: availability, integrity, confidentiality, authenticity, accountability, non-repudiation and reliability [2]. Accordingly, an enterprise’s II IS is a state of its II protection in terms of IS threats (threats designed to violate the above mentioned information properties).
A sufficient IS level within an enterprise should be provided and maintained for a long time to counter IS threats, to reduce IS risks and to efficient IS events and incidents processing. Therefore, now IS maintenance as the process of maintaining the protected state of enterprise’s assets is one of the fundamental aspects of running a successful business. IS maintenance management, abbreviated IS management, is an integral part of any modern enterprise management in general and its II in particular.
In general, IS management of an enterprise is a cyclic process, consisting of a set of targeted actions taken to achieve the stated business goals of the enterprise by ensuring protection of its information sphere. It includes awareness of IS maintenance necessity, posing the IS maintenance problem, the current situation and the state of managed objects assessment, planning measures for IS risks processing, implementation, introduction and effective assessment of the appropriate protection measures and controls, distribution of roles and responsibilities in the IS maintenance sphere, employee training and motivation, selection of control and corrective impacts and their implementation [2]. Thereby, the set of targeted actions includes the current situation and the state of managed object assessment (for example, IS risk assessment), the choice of control impacts and their implementation (planning, implementation and maintenance of protection measures and tools) and many other. While the information sphere is a collection of information, II (consists of data and knowledge banks, communication systems, network devices, applications, etc.), subjects performing collection, forming, distribution, storage and use of information and the system that controls relationships arising [3].
As follows from the definition, an enterprise’s IS management is a complex ongoing process that faces the set goals and objectives and which divides into closely related sub-processes, which make a significant contribution to IS maintenance. IS management objects within these sub-processes are diverse. They can include assets, IS risks, IS incidents, business continuity, changes, improvements, and many others. The general efficiency and effectiveness of all IS maintenance activities in the enterprise depend on the efficiency and effectiveness of each of the sub-processes.
In modern conditions there is a lot or work done in the direction of IS maintenance, but little proposed for the management of the protection measures implemented in the enterprise. Enterprises often do not realize what assets are more critical, what IS risks are associated with these assets, what protection measures should be planned and why. These and many other questions can be answered as a result of different IS checks, including the IS monitoring and control of the used protection measures (collectively called IS monitoring). IS monitoring is understood as permanent (continuous) monitoring of registered events affecting enterprise’s IS maintenance in a particular environment (system, network, service), as well as the collection, analysis and generalization of the monitoring results. IS monitoring is implemented on the basis of monitoring compliance with the basic requirements to IS maintenance and appointed regulations (control over normal mode of the environment functioning) [4].
Timely and constant data observation, collection, analysis and processing for each of the IS maintenance activities in accordance with the intended purposes, as well as provision of the authorized parties with full, timely, reliable information for justified decision-making in the sphere of IS maintenance are the main objectives of the IS monitoring.
Analyzing IS monitoring data usually pursues the following purposes:
1) control over implementation of the provisions of internal and external IS maintenance documents in the enterprise in order to detect deviations from the accepted business and IS maintenance requirements (e.g., fixed in the logical access to information assets policy);2) quality control (by which the efficiency and effectiveness are meant) of the protection measures used; 3) recognition of the contingencies, including malicious, with the enterprise’s information assets and business processes;4) detection of IS events, partly further classified as IS incidents;5) detection of the assets vulnerabilities that intruders can use to implement attacks on the enterprise’s systems, networks and services, its business partners and users of public networks such as the Internet alike;6) providing evidence in case of computer crimes investigation.
IS monitoring provides transparency of the main, auxiliary and management automated business processes and ensures their observability at all times during their operation. As a result, the level of business trust in them increases. IS monitoring also promotes the sense of responsibility in enterprise's employees for the actions affecting the IS, helps in detecting misuse of resources and acts as a deterrent for people who can try to harm the enterprise. Finally, during the IS monitoring bugs in the processing of information and its results are detected. They can be related both to failures in the II operation and the human factor. This allows further optimizing the operation process (in terms of compliance with the established regulations) and systems, networks and services functioning.
IS monitoring is closely associated with the IS incidents management. The latter is a process consisting of a series of sub-processes, the input of which is the data resulting from the collection and logging of the IS events affecting the information systems, and output is the information about the causes of the IS incident, damage caused to the enterprise and measures to be taken to avoid repetition of the IS incident [5]. Thus:
· IS event is an identified appearance of a certain assets (system, service or network) state, pointing at a possible violation of IS policy or irregularities in the IPT, or appearance of a previously unknown situation that may be relevant to IS;
· IS incident is an appearance of one or more unwanted or unexpected IS events having a significant probability of compromising business operations and pointing at the accomplished, undertaken or probable implementation of the IS threat to the enterprise’s assets.
IS events may be considered as a part of the IS incident, while the IS incident as a set of IS events.
IS incidents may be deliberate or accidental (e.g., be due to a human error, hardware malfunction or natural phenomena) and can be caused by various sources of IS threats – people, faulty information processing facilities, natural disasters, etc. A denial of service attack, unauthorized information modification, a legitimate user substitution, etc. are the examples of IS incidents. Unauthorized changes to the information, its destruction or other events that make it inaccessible, as well as damage to the enterprise’s assets or their theft are possible effects of IS incidents.
The main sources of IS events are technical, software and hardware tools of IS monitoring and operation control of the used protection measures. Information sources about the IS events are:
· log files of IS management, control and monitoring systems;
· system log files of the operating systems (OS) and database management systems (DBMS);
· log files of the application software, active network equipment and the used IPT, including integrity check software, the IPT from unauthorized access, protection against malicious code, specialized tools such as firewalls, intrusion detection and prevention systems (IDS or IPS), security scanners (SS) and IS incidents management systems (SIEM from the Security Information and Event Management);
· information from specific physical access control devices, including television surveillance systems, access control systems and alarm system.
IS events processing and attributing it to IS incidents schematically represented in Figure 1 [6]. After detecting an IS event the enterprise’s Operation Assurance Group conducts its first assessment. If it shows that this event is an IS incident, the IS Incident Response Team (ISIRT) conducts a second, more detailed assessment. It is also detected, whether the IS incident is under control. If not and the consequences of the IS incident are serious, anti-crisis measures may be required.
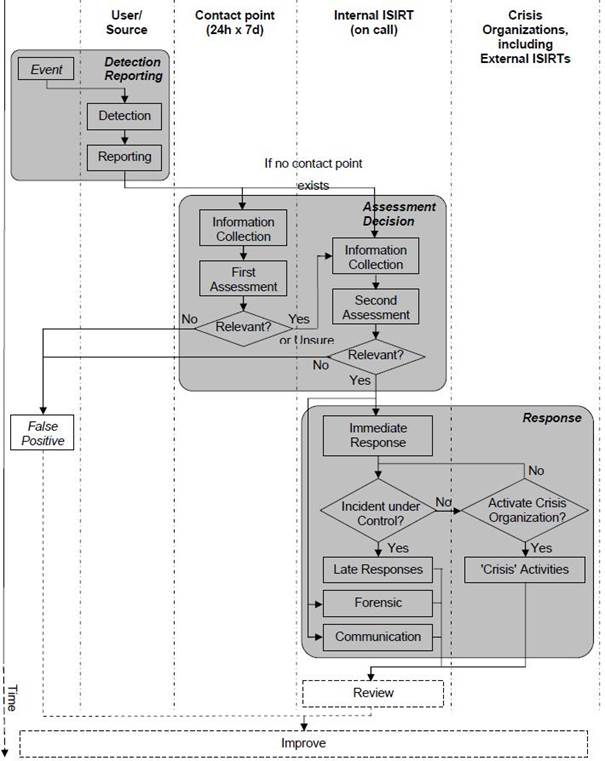
Fig. 1. IS event processing
Preparing to collect the necessary data, data collection itself, filtering and analysis of the collected data, data management, database management of the collected information, etc. are the IS monitoring processes associated with the IS incident management (Fig. 2) [7]. IS monitoring data is used directly for the IS incident management, when IS events are distinguished from all the information observed after primary treatment according to the established criteria. Further, a part of these events will be classified as IS incidents requiring mandatory registration, determination of their causes, detailed study of the essence of what has happened and implementation of an appropriate reaction and elimination of their consequences.
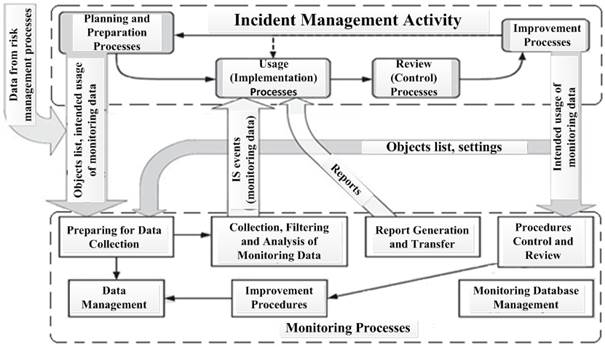
– management flow; ![]() – data flow
– data flow
Fig. 2. IS monitoring and IS incident management processes interrelation
Effective IS incident management provides rapid restoration of normal II functioning, minimizes their adverse impact on the enterprise’s business and, most importantly, prevents their possible occurrence in the future by selecting and implementing adequate protection measures to the problems identified (IS threats and vulnerabilities).
3. Enterprise’s II IS Information Visualization Subjects
Visualization has long been a popular and effective means to identify and resolve IS management problems. To answer the first question posed in the introduction (what II IS information to visualize) is the most difficult. Unlike visualization of physically existing phenomena or data (e.g., human body, maps, earthquake, hurricane funnel, tsunamis, etc.), II IS information visualization should represent some abstract state of II protection data. It requires creativity on the part of the developers of such visualization systems, as in reality the structures conventionally displayed on the monitor screen do not exist. For example, how to present the low-level network information or information obtained from a separate network device to identify IS events as accomplished attacks or an attempt of attack on enterprise’s II developing before the eyes of IS administrator or analyst.
Information about the enterprise’s II IS subjected to visualization can be used for direct analysis, IS event detection in a stream of all collected events, decision-making in the field of IS management, and the information communication to a certain circle of authorized persons. Therefore, many potential applications of the II IS information visualization systems can be identified for the sake of IS. It can solve, for example, the following important tasks crucial to protect corporate networks from the external networks attacks such as the Internet or misuse by insiders:
· network attacks detection;
· analysis of information flows and unauthorized (fraud) operations with information identification;
· abnormal activity detection;
· detection of worms of the so-called botnets propagation paths; those are usually used for malicious actions like spam and viruses distribution, distributed password attacks on remote computers, launching attacks such as "denial of service" , etc.;
· malware or virus code examination;
· tracing network packets moving through the communication channels between hosts (devices with unique addresses) within the corporate network;
· access control over all II resources (including hardware, applications, databases, servers, files, etc.);
· control over system configurations in II;
· IS events «cut» to select a communication channel, network device, network protocol, service, application, etc.;
· II vulnerabilities detection;
· showing notifications/warnings and recommendations to address the IS maintenance problems of separate II elements automatically generated by IPT;
· correlation of detected IS events;
· particular trends, attributes (e.g., attack signatures) detection;
· model-making and the development of IS maintenance rules (e.g., firewalls settings);
· computer crimes’ evidence visualization for further investigation;
· control over unreliable employees;
· effectiveness analysis of the IPT settings;
· interaction study of the various IS maintenance technologies and separate IPT;
· training on IS and increasing awareness in the field of IS, etc.
II IS Information Visualization is possible in two ways: generally across the whole II and by individual IS events. In the first case it is a summary of the following information related to II IS:
· indicators of II IS in general and of its individual parts, including IS risks (by type, consequences, implementation likelihood) and vulnerabilities localization points;
· indicators of the IPT efficiency by types and locations of their use;
· statistics on the number of IS events and incidents by type, severity, location, etc.;
· status and current state of IS events and incidents;
· detection of priority areas requiring immediate attention, etc.
Considering a separate IS event, the information describing it from the following angles must be visualized [8]:
1) who: access subject;
2) why: for example, due to an accident, involuntary or unintentional action (error), ignorance, negligence or irresponsibility, malicious actions (internal or external);
3) what: unauthorized access to the system and/or information, unauthorized impact on the of information system and/or against the enterprise, installing unauthorized programs (without consent of the owner), remote causing malfunction in the information system, stressful situation creation, physical intrusion or illegal act, illegal activities on the Internet (harmful to the enterprise), a variety of human errors (in the administration, processing, programming, sharing), breakdown or failure of equipment, problems in the environment (causing inaccessibility of information system components due to natural disaster);
4) how: possibility, a list of methods and tools for each of the above "what", especially, for attacks;
5) status of the IS event: an attempt being implemented, a successful or failed hacking;
6) which vulnerability was exploited: behavioral, software, hardware or software configuration, general protection, system architecture or processes, physical material;
7) on which type of assets (basic and related): databases and applications (located on the periphery of the enterprise’s II, inside it, in common cloud, outsource), systems (located on the periphery of the enterprise’s II, inside it, in common cloud, outsource), networks and telecommunications (low-level devices, high-level communication devices, middleware, wireless devices, IPT), offline storage device (paper, electronic, magnetic and optical devices), end-user devices (local application software owned by the user or enterprise, multipurpose workstations owned by the user or enterprise), people (employee, business partner, service providers with or without own equipment), facilities and environment (property, physical means or protection system, buildings and premises, office furniture);
8) what are the consequences to the properties of information (confidentiality, integrity, availability, etc.);
9) what are the consequences for business in general: direct or indirect.
Log files were mentioned above as one of the sources of information about IS events. They usually contain important information about these events in terms of IS maintenance, which can be visualized:
· user’s (access subject) identifier (ID);
· dates and times of his log-ins and log-outs, details of the key events;
· name of the host that initiated the event to be registered and/or its location;
· records of successful and rejected attempts to access the objects;
· changes in the system configuration;
· modifying the lists of access subjects and objects;
· changes in access subjects authorities and access objects (protected information resources) status;
· all privileged actions (using the supervisor account, running and stopping the system, connecting/disconnecting to the input/output devices);
· starting programs and processes that access to protected information resources;
· system utilities and applications usage;
· all established sessions;
· files that have been accessed, and the type of access;
· network addresses and protocols;
· changes in the intensity and volume of incoming/outgoing traffic (including the Internet traffic);
· printing materials containing sensitive information;
· access to critical systems and services (e.g., web server, DBMS, mail server, synchronization services, etc.);
· system warnings and failures;
· alarm raised by the access control system and IDS;
· changes or attempts to change settings and tools for system protection management;
· activation and deactivation of protection systems, such as anti-virus systems and IDS;
· appearance of new devices with uncontrolled access (wireless access points, USB-connected devices, etc.), etc.
4. Enterprise’s II IS Information Visualization Systems
Designing II IS information visualization systems is a complex process that requires expertise in many fields such as mathematics, statistics, cognitive psychology, visual interface design, computer graphics and, of course, II IS maintenance subject field. This process currently is not formalized yet, as noted in papers by Nort and Kraft [9-10].
In general, methods of designing such systems consist of four basic steps [9]:
1) input data is read and stored in a standard form;
2) data is converted into some graphic images – glyphs, and the data components may have a different appearance of the glyphs in different design methods;
3) glyphs are displayed on the screen in separate windows (parts of the screen) using different visualization tools;
4) images read by a human from a monitor screen are converted into meaningful for him/her data, afterwards he/she can interact with a visualized image changing it.
Here, the two main problems of any visualization arise. Those are complexity, meaning the possibility to visualize data in various forms, and scalability, which means the possibility to visualize large amounts of data both in terms of algorithmic complexity, and the possibility to display large amounts of information understandably for humans [10].
The following answers the second and the third questions posed in the introduction: how to represent data on the screen and how to interpret the information displayed clearly.
The second question is much easier to answer, because today there are many interesting approaches and solutions in this field – from simple graphs, charts, and histograms of different types, plans, drawings, hierarchical structures, graphs, tables with color gradation information, geographical and topographical maps, scanning and enlargements of the selected image to the dynamically changing complex animated images. Obviously, the choice of a particular method of visualization, size, shape and color of the images will be determined by the kind of information displayed, and often in order to create a complex image, at the same information should rather visualized in several ways complementary to each other. All these approaches are applicable to visualize II IS information.
The second important issue is connected to the direct user of the visualized information. Similarly to the visualization tasks gradation in control and safety systems in nuclear power plants in crisis and situational centers, etc., that operate at different levels of authority and responsibility of users, the following gradation of II IS information visualization tasks is considered:
1) information visualization for dynamic situation monitoring of the current II IS maintenance state based on the most simple methods of data visualization, providing user’s (operator’s) quick response; for example, data on a single IS event or incident (as described above in Section 3);
2) information visualization for the analysis of the gathered statistic data, strategic planning and II IS management strategy and tactics correction decision-making, which requires the use of more sophisticated methods of data analysis and visualization for the user – the analyst; for example, it is summarized data in terms of II protection in general and of its separate parts, including IS risks, IPT efficiency indicators by type and place of use, statistics on the number of IS incidents and events, etc.
Some generalized indicators with conditional gradation of the data observed are undoubtedly very useful for both types of users identified above. For example, highlighting areas with the green (acceptable), yellow (showing a tendency for increase in the IS risk level), orange (substantially exceeds a certain threshold level of IS risk) and red (the most critical area of an unacceptable level of risk and requiring urgent intervention) color. The main requirement is that information must be displayed in the most visual, clear, understandable way for a human allowing an unambiguous interpretation.
Usually, a possibility of obtaining more detailed picture (the so-called scanning) on an individual IS event and indicators or a group of them is provided on request, as the visualization system display on the screen already somewhat filtered, more human-readable information.
The search for required detailed information is faster in case of clear structure and grouping of information (e.g., types/classes of IS events).
The user may wish to read the original data on which visualization is based on.
Also visualization systems usually provide features such as the choice, filtering, transposition, transformation, match making (binding) for logically related information of different types.
The answer to the third question (how to interpret the information that are displayed on the screen uniquely) is that visualization should allow monitoring of basic parameters (attributes, properties) for IS events and II IS maintenance in general and to track changes in the whole image or a part of it, indicating the appearance of unwanted IS maintenance problems in a particular area of II. For comparison, the basic parameters must be visualized in the same manner for the entire time of monitoring. Thus, as a rule, the above-mentioned color gradation of the IS event parameters is used.
In addition, the standard requirements to the II IS information visualization should be implemented in the system:
· simple use, allowing the user to concentrate on solving IS event monitoring problems;
· possibility to save screenshots and videos of the displayed on the screen;
· flexibility by allowing expansion of the supported methods of information visualization;
· forming of a variety of reports on the information displayed on different criteria, with varying degrees of detail and for different target groups;
· provision of recommendations to address the IS maintenance problems identified in parts of II and in II in general, etc.
Like most automated systems, II IS information visualization systems require vigilant oversight by the IS administrator or analyst, often with better analytical ability and willing to bind seemingly unrelated information. Automation is especially useful for increasing amount of data to be analyzed, while people can adequately assess exceptional situations and identify previously unknown (new) IS threats. Although currently IPT developers are trying to fully computerize the intrusion detection, an approach implying the possibility of attributing a human for such purposes seems more realistic. Computers can handle large amounts of data, but still cannot be compared with a human in the analytical abilities. For example, people more successfully identify signs of new attacks and understand the unpredictable for a computer attacker's behavior, who wants to go unnoticed.
Therefore, sophisticated IS management tools have to integrate capabilities of human intelligence to nontrivial reasoning with its ability to handle huge amounts of data presented in various formats.
To develop an enterprise’s II IS information visualization system and to effective assist to the analyst in the diagnosis of abnormal or unexpected events and their proper correlation in the field of IS, it is necessary to fully understand all the details of his/her work – how and what he/she does and how IS event management processes can be improved by integrating the benefits of the human approach and automated management systems.
5. Examples of Enterprise’s II IS Information Visualization Systems
IPT can register millions of IS events of different origins and consequences in the intranets of large corporations during one day only. The amount of work required to identify the truly important data from the viewpoint of IS events and to obtain information on IS incidents can be extremely large. Automated systems for IS event management – SIEM class systems [5] – are used to solve the problem of flow control of the IS events coming from IPT and to computerize a range of IS incident management processes.
SIEM evolutionary replaced the two types of systems that have historically emerged before them in the IPT market – Security Information Management (SIM) and Security Event Management (SEM) systems. SEM systems monitored events in real time, their correlation, sending notifications and representation of information at operator’s console. SIM systems provided long-term storage, analysis and reporting based on their log lists [1].
SIEM systems of two generations are specified. The first generation systems detect IS events through set rules and information correlation techniques, the latter perform behavioral and contextual analysis and implement the following basic functions:
· real-time detection and centralized collection of information about IS events from all distributed heterogeneous sources installed in II: IPT (software and hardware), network devices, applications, databases, configuration files, etc.;
· collected information processing (filtering, aggregation, normalization and correlation) in a particular context, given previous and current user’s and application’s activity and accumulated statistics;
· tracking the entire lifecycle of each IS incident – analysis and automatic execution of certain actions in response to IS events classified as IS incidents;
· automated generation of reports and recommendations to address IS incidents and events (including tracking of their solution status) and summary reports on the enterprise’s IS state.
SIEM systems help to achieve the following objectives in II IS managing:
· to obtain information about the real state of the level of protection throughout the II and certain assets of the enterprise;
· to conduct a reasonable assessment of IS risks in the enterprise and timely eliminate or reduce IS risks based on this assessment;
· to detect differences and bring the assets and business processes in accordance with internal IS policies, requirements of regulators and auditors;
· formalize and implement effective decision-making in the field of IS.
In everyday life of an enterprise using SIEM systems gives the following results:
· accelerates reaction to emerging of IS events and incidents and provides II protection around the clock via automated reaction to IS events in accordance with predetermined processing and correlation rules;
· reduces the cost of training IS personnel as it becomes necessary to study only the interface of such a system instead of all the heterogeneous IPT used in II;
· eliminates the necessity to increase IS personnel in accordance with increase in the number of IPT, providing information on IS events;
· computerizes activities for an enterprise’s II IS analysis and reporting in accordance with industry and international standards and regulations.
To perform these functions a typical SIEM system’s architecture usually consists of three levels:
1) a kernel that interacts with distributed agents collecting data in II (collectors) and processes events;
2) database responsible for storing the accumulated IS events data both raw and processed;
3) control interface with management center console.
It is the central console of the SIEM system where II IS information is visualized.
Research and consulting company Gartner, specializing in the IT market, in May 2013 held a regular SIEM systems supplier assessment and identified the leaders in this segment of the market [11]:
· IBM–Q1 Labs [http://www.ibm.com/software/products/ru/qradar-siem];
· HP–ArcSight [http://www8.hp.com/us/en/software-solutions/software.html?compURI=1340712];
· McAfee [http://www.mcafee.com/us/about/mcafee-nitrosecurity.aspx];
· Splunk Inc. [http://www.splunk.com].
The screenshots presented below show how diverse can be the information about IS visualized in these SIEM systems. Thus, for example:
· IS events chart (in this example, the establishment of network connections) with brief descriptions of the specific IP addresses for some time in the QRadar SIEM of IBM-Q1 Labs (Fig. 3);
· detailed information about the specific IS incident (type, how many assets were damaged as a result, who is responsible for the consequences, etc.) in QRadar (Fig. 4);
· summary statistics for different types and dates of IS events (an incorrect password log-in attempts, the most attacked ports and IP addresses, IS threats change dynamics, etc.) in HP ArcSight Enterprise Security Manager (ESM) SIEM (Fig. 5);
· summary statistics on the most attacked ports and users' computers provided on the main management console of HP ArcSight ESM (Fig. 6);
· summary statistics on the IS events, including the total number of IS events, how many of them were correlated (combined as the stages of a single IS event), the average severity of correlated events, from what and to what IP addresses the network connections were made, events distribution by time of day etc. in McAfee Enterprise Security Manager SIEM (old name NitroView ESM) (Fig. 7);
· summary statistics for a particular type of IS events (namely, calls – their duration, call type, used types of data transmitted, specific activity, etc.) in the Splunk Enterprise SIEM (Fig. 8).
As seen from the screenshots, not very complex, standard methods are currently used in the SIEM systems for II IS information visualization: graphs, charts, bar graphs and tables with different types of color gradation, scanning (especially, of tables).
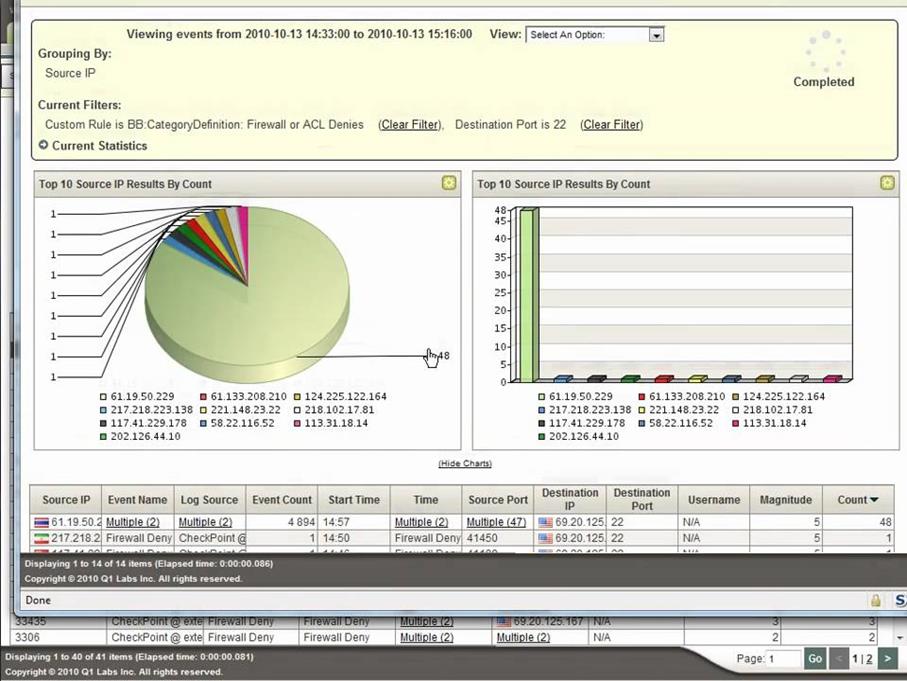
Fig. 3. IS events information visualization by QRadar SIEM of IBM-Q1 Labs company
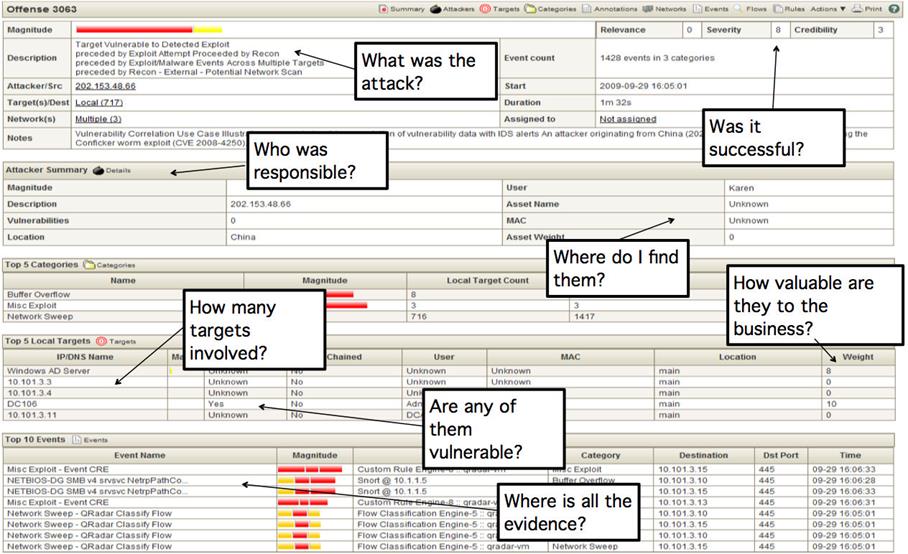
Fig. 4. Information visualization about a particular IS incident by QRadar SIEM of IBM-Q1 Labs company
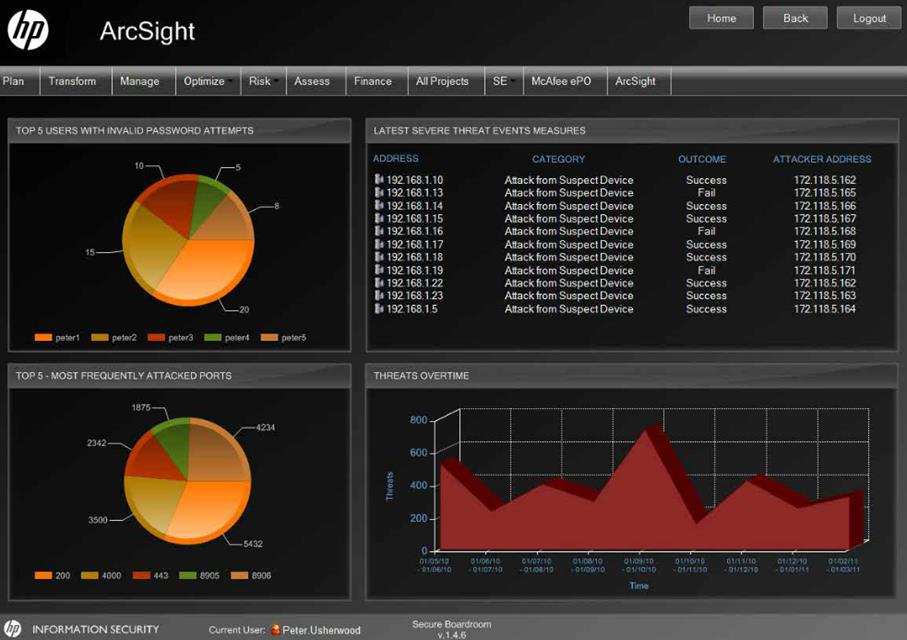
Fig. 5. Summary statistics visualization
for different types and dates of IS events (an incorrect password log-in attempts,
the most attacked ports and IP addresses, IS threats change dynamics, etc.) by HP
ArcSight Enterprise Security Manager (ESM) SIEM
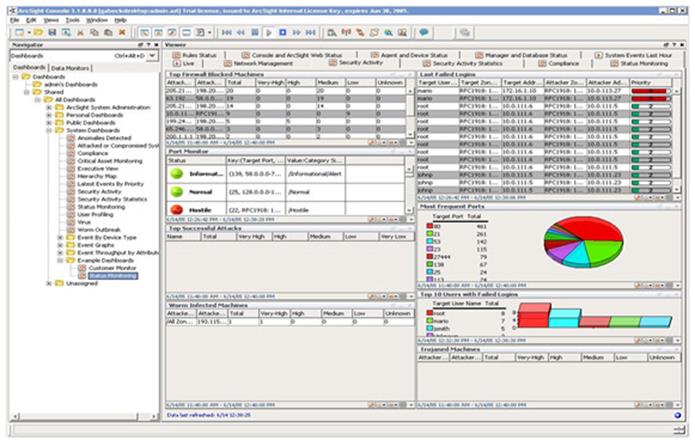
Fig. 6. The main console of HP ArcSight ESM
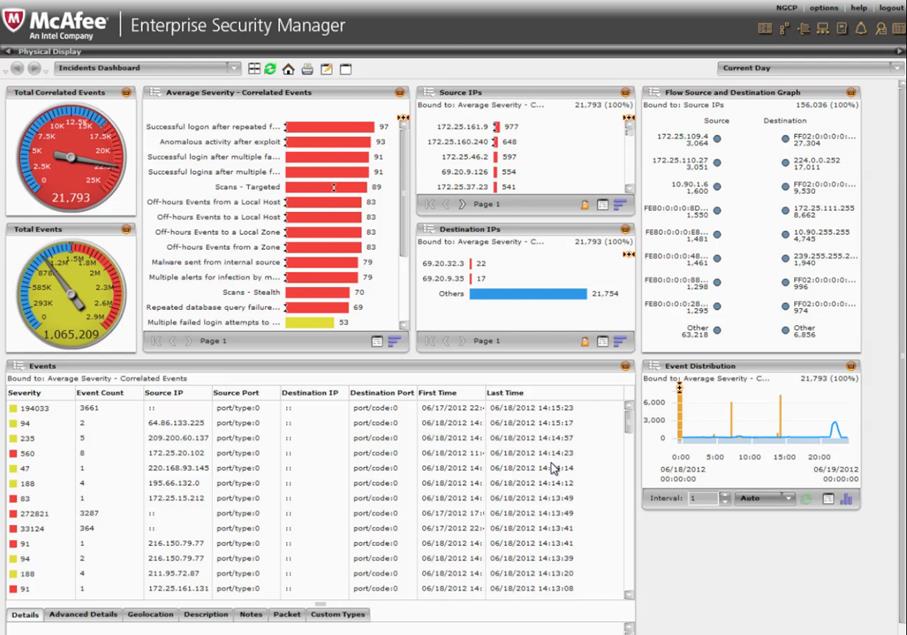
Fig. 7. Visualization of summary statistics on the IS events by McAfee Enterprise Security Manager SIEM
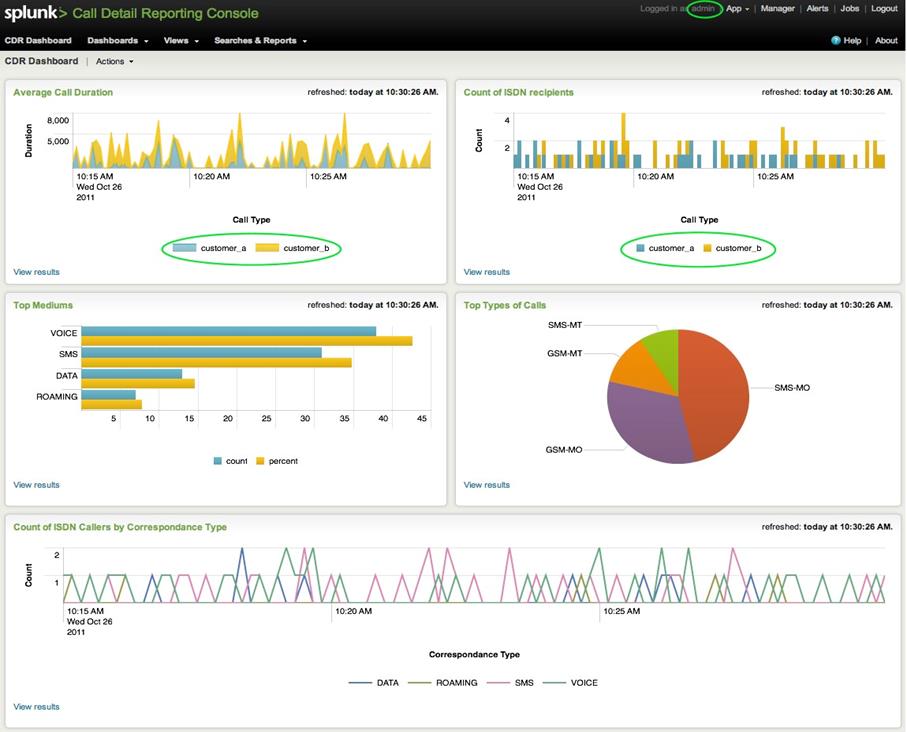
Fig. 8. Summary statistics visualization for a particular type of IS events (calls) by Splunk Enterprise SIEM
The following more sophisticated visualizing techniques are used in IS management systems and services other than SIEM systems:
· hierarchical structures and graphs (aimed, for example, at visualizing source program code by modules to identify vulnerabilities in them, to monitor the disk space usage of computers, to parse the contents of network packets to search for attack signatures or computer viruses, etc.);
· a detailed conduct analysis of a single host of the network to identify abnormal activity and users abuse on it (with visualization of the running processes, used data, requested services, memory state and disk space, etc.);
· network maps clearly showing the interrelations of protected network elements, network packets routes between local and remote hosts (for example, on the website http://traceroute.monitis.com or by using Tnv – The Network Visualizer or Time-based Network Visualizer [http://tnv.sourceforge.net]) and network attack routes (as in case of attacks such as "distributed denial of service" using botnets);
· scatterplots and Hilbert Curve Mapping, showing traffic between hosts in subnets and its change over time (for example, NvisionIP, FlowTag or Axence Nvision [http://www.axencesoftware.com/en/nvision/network]);
· mapping the dynamics of changes in the state of IS maintenance in time and underlining situations where the threshold control indicator is exceeded;
· scanning of the selected image part, etc.
As the article study affects only SIEM systems, the conclusions concerns them as well: today possible functions of SIEM systems to visualize II IS information are far from being perfect and reflecting the needs of users – both operators and analysts. In accordance with development more efficient technologies, parallel computing, data centers and "big data" technologies these functions will be complemented by a function to visualize particular information on particular solutions that were proven to be effective in narrow application areas listed above, such as mapping of large-scale network addresses space, network streams, simultaneous content correlation of network packets unrelated from the first glance, etc.
IS Intelligence makes the problem of analysis and visualization of II IS information in modern enterprises conducting their business using IT, and therefore vulnerable to various attacks from intruders particularly acute.
The SIEM systems analysis shows that the information visualization made by them is clear and easy for understanding and decision-making, but nowadays has one major drawback – it only reflects information concerning what has already occurred, i.e. the past, whereas it is necessary to make decisions about the future for rapid adjustment activities to maintain or even strengthen II IS. Therefore, it is required not to develop the classic SIEM systems (there is a sufficient number of them already on the market), that can display nice summary reports on any referral assessment II IS source, but the systems that can predict the impact on the most critical parameters relating to II IS maintenance.
With the improvement of modern II IS information visualization systems, they should turn into intelligent predictive systems to efficiently and cost-effectively solve the problem of IS management and maintenance supporting the core business by properly executed and clearly displayed analytical development forecasts in the field II IS for relevant professionals. New intelligent methods of IS data analytical processing should promote the development of new knowledge about IS events and incidents, identification of influencing interrelations and trends in large volumes of information, as well as the successful solution of problems of modeling various processes and events in the field of IS management and prediction of their development. A set of recommendations on what actions might be taken in this situation and comparative (visual) analysis of the results if the selected recommendations are implemented will be especially valuable in these systems.
[1] Burnham J. What is Security Intelligence and Why Does It Matter Today? Available at: http://securityintelligence.com/what-is-security-intelligence-and-why-does-it-matter-today/# (access date 16.02.2014)
[2] Kurilo A.P., Miloslavskaya N.G., Senatorov M.Y., Tolstoy A.I. Osnovy upravleniya informatsionnoy bezopasnostyu. Uchebnoe posobie dlya vuzov [Information Security Management Fundamentals. Textbook for high schools]. Moscow, Hotline-Telecom, 2014, p. 244.
[3] The Standard of the Bank of Russia STO BR IBBS-1.0-2010 «Information Security Maintenance for Organizations of the Banking System of the Russian Federation. General Conditions».
[4] Miloslavskaya N.G., Senatorov M.Y., Tolstoy A.I. Proverka i otsenka deyatelnosti po upravleniyu informatsionnoy bezopasnostyu. Uchebnoe posobie dlya vuzov [Testing and Assessment of Information Security Management. Textbook for high schools]. Moscow, Hotline-Telecom, 2014, p. 166.
[5] Miloslavskaya N.G., Senatorov M.Y., Tolstoy A.I. Upravlenie intsidentami informatsionnoy bezopasnosti i nepreryvnostyu biznesa. Uchebnoe posobie dlya vuzov [Information Security Incidents and Business Continuity Management. Textbook for high schools]. Moscow, Hotline-Telecom, 2014, p. 170.
[6] GOST R ISO/MEK 18044–2007 «Informatsionnaya tekhnologiya. Metody i sredstva obespecheniya bezopasnosti. Menedzhment intsidentov informatsionnoy bezopasnosti». [GOST R ISO/MEC 18044–2007 «Information Technology. Methods and Tools of Security Maintenance. Information Security Incidents Management»].
[7] Obespechenie informatsionnoy bezopasnosti biznesa [Information Security Maintenance for Business]. Edited by Kurilo A.P. Moscow, Alpina Publishers, 2011.
[8] ETSI GS ISI 002 V1.1.1 «Information Security Indicators (ISI); Event Model. A security event classification model and taxonomy».
[9] Craft, B. and Cairns P. Directions for Methodological Research in Information Visualization. In Conference on Information Visualization, 2008.
[10] North, C., Kerren, A., Stasko, J., and Fekete J. Information Visualization: Human-Centered Issues in Visual Representation, Interaction, and Evaluation. Springer-Verlag. 2008.
[11] Burnham J. Gartner Publishes 2013 Magic Quadrant for SIEM. Available at: http://securityintelligence.com/gartner-publishes-2013-magic-quadrant-for-siem/# (access date 16.02.2014)