MATHEMATICAL MODELING AND VISUALIZATION
OF MATTER FLOWS IN ACCRETION STELLAR DISKS
A. Lugovsky1,2,
M. Abakumov3, V. Chechetkin1,2,4
1 Keldysh
Institute for Applied Mathematics RAS, Moscow, Russian Federation
2 National Research
Centre “Kurchatov Institute”, Moscow, Russian
Federation
3 Lomonosov
Moscow State University, Moscow, Russian Federation
4 National Research Nuclear
University MEPhI (Moscow Engineering Physics Institute), Moscow, Russian
Federation
alex_lugovsky@mail.ru, vmabk@yandex.ru, chechetv@gmail.com
Contents
2. Formulation of the problem and methods of solution
3. The results of numerical simulation and visualization
3.1 Small perturbations in the accretion disk with non-Keplerian velocity distribution
3.3 Perturbations in the Keplerian accretion disk
Abstract
In recent years large amount of
observational data on stellar accretion disks is obtained. Numerical
simulations are virtually the only way to a comprehensive study of such
astrophysical objects. The calculations produced vast amounts of information,
so their visualization is not only a way to look, but also research. The
results of the simulation and study by using a visual representation of the
structure of gasdynamic flows in these disks with gravity are shown. A new
mechanism that defines and characterizes the accretion (fall) of the matter to
the central body is proposed. The problem of the emergence and development of
large-scale vortex motion in shear flow of the accretion disk is considered in
the article. The mechanism of angular momentum transfer by large vortex
structures arising from the initial development of small perturbations is
investigated. Considered problems involve a huge amount of computational work
so they are carried out on multiprocessor computer systems. Visualization of
the calculations in these problems is the method of research and study of the
flows structure. Animation of the calculations allows to trace the evolution of
flows. Comparison of flow patterns for different characteristics in the form of
contour lines gives a visual representation of the vortex flow structure.
Allocation of investigated subdomains and use of special palettes as well as
narrowing of the considered variation range of the flow characteristics provide
an opportunity to study small-scale features of the flow.
Key words: visualization in astrophysics, accretion stellar disks, angular momentum, ClcView.
The accretion disk is a gas disk around
a massive (compared to disk) compact object (accretor
star). Theoretical research on the accretion disks forming around gravitating
compact objects has been conducted over many years. Accretion disks manifest themselves
by radiation as a defining feature of the accretion disk is the transition of
the gravitational energy of the accreting (falling) matter to the compact
object in heat followed by radiation. Observations of accretion disks show a
significant flow of matter determined by radiation to the accretor
(central body). The fall of matter is possible only if transferring a larger
share of the angular momentum of the accreting gas to the outside area of the
disk. Thus, one of the key problems in the physics of accretion disks is the
question about the mechanisms of angular momentum transfer to the outer parts
of the disk providing the matter falling to gravitating center. Some physical processes
have been considered as mechanisms of angular momentum removal but analyses
show that all these mechanisms meet with some difficulties in attempts to
explain the properties of accretion.
In this article the problem of the
emergence and development of large-scale vortex motion in shear flow of the
accretion disk is considered. The new mechanism of angular momentum transfer by
large vortex structures arising from the initial development of small perturbations
is investigated. Possibilities of analytical evaluations of multiscale vortex flows arising in these astrophysical
problems in the general multivariate case is very limited so the main
method of studying the properties of such flows is a numerical experiment. Physical
sizes of modeled astrophysical objects are several orders larger than the specific
sizes of studied structures of vortex flow so the used grid must be
sufficiently detailed. Due to the scheme monotonicity the time step is proportional
to space step and accordingly too small.
Calculations are performed on large
intervals of physical time with the time step of four or five orders smaller
than the characteristic time of one revolution of the disk (the number of time
steps in different calculations is from 30,000 to 300,000). Thus, considered
problems involve a huge amount of computational work so their
full simulation on a personal computer is virtually impossible. In this case,
numerical simulations on multiprocessor computer systems are virtually the only
way to a comprehensive study of such astrophysical objects.
Huge amounts of the results of
calculations require special approaches to their study, because in such flow of
information any minor detail may be important. Visualization of the
calculations in these problems is not only a way to look at the results, but
also the method of research and study of the flows structure [1]. Animation of
the calculations allows to trace the evolution of
flows. Comparison of flow patterns for different characteristics in the form of
contour lines gives a visual representation of the vortex flow structure. Allocation
of investigated subdomains and use of special palettes as well as narrowing of the
considered variation range of the flow characteristics provide an opportunity
to study small-scale features of the flow. All these ways and methods of presenting
the calculations information do visualization an integral part of the
scientific study of astrophysical problems of accretion disks. As a
visualization tool the program ClcView [2] allowing to use all these approaches to visualization is chosen.
2. Formulation of the problem and methods of solution
In the hydrodynamic approach an
accretion disk in the gravitational field of central body with mass M is
considered. Assuming that the thickness of the disk is much smaller than its
radius we consider the problem in two-dimensional geometry. Self-gravitation of
disk matter is not considered.
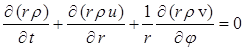
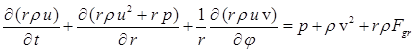
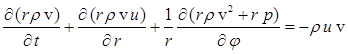
The gas is ideal, compressible and its behavior is described by the two-dimensional Euler gas dynamics equations in cylindrical coordinates:
 ,
,
 ,
,
 ,
,
![]() ,
,
![]() ,
, ![]() .
.
The ideal gas law is used in the following form
![]() .
.
Here r - radius, j - polar angle, t - time, r - density, p - pressure, e - specific
internal energy, e - full specific energy, g - ratio of specific heats, h – specific enthalpy, ![]() - gas velocity, u – radial component of
the gas velocity, v – azimuthal component of the gas velocity,
- gas velocity, u – radial component of
the gas velocity, v – azimuthal component of the gas velocity, ![]() – radial component of the specific
gravitational force, G – gravitational constant, M – mass of
gravitating body.
– radial component of the specific
gravitational force, G – gravitational constant, M – mass of
gravitating body.
For
convenience we use dimensionless variables. As the scale factors we choose R,
M, G, where R - characteristic spatial dimension of the problem, and we
introduce the dimensionless variables marked with stroke according to the
formulas
![]()
The
numbers ![]() are expressed as follows:
are expressed as follows:
![]() .
.
In what follows we will omit the stroke.
The system of equations in dimensionless variables remains
the same. Expression for specific gravitational force in dimensionless
variables takes the form:
![]()
Let
us consider the flow of gas in the assumed area ![]() .
.
For the boundaries of the assumed region
we set free-flow boundary conditions: 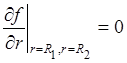 , where
 ![]() .
.
To approximate the differential
equations we use the third order Roe-Einfeldt-Osher TVD scheme [3]. The scheme ![]() is used to minimize numerical dissipation. Due to the large amount of
computational work the algorithm was parallelized and the calculations were
performed on multiprocessor computer systems. The Roe-Einfeldt-Osher scheme due to its explicitness is convenient for
implementation on multiprocessor computer systems.
is used to minimize numerical dissipation. Due to the large amount of
computational work the algorithm was parallelized and the calculations were
performed on multiprocessor computer systems. The Roe-Einfeldt-Osher scheme due to its explicitness is convenient for
implementation on multiprocessor computer systems.
3. The results of numerical simulation and visualization
3.1 Small perturbations in the accretion disk with non-Keplerian velocity distribution
The computational domain and the
disk configuration are shown in Fig. 1. For the initial state of the accretion
disk we select the analytical solution ![]() widely used in
the modeling of accretion disks (e.g. [4]) and being the equilibrium state
obtained in [5] in the case of two-dimensional model. Here we choose the
equilibrium state in the shape of a torus with the azimuthal velocity
distribution close to Keplerian.
widely used in
the modeling of accretion disks (e.g. [4]) and being the equilibrium state
obtained in [5] in the case of two-dimensional model. Here we choose the
equilibrium state in the shape of a torus with the azimuthal velocity
distribution close to Keplerian.
Note that the assumed region is
selected so that its radius is about twice the typical radius of an accretion
disk, i.e. the region where most of the mass of a disk is concentrated (Fig.
1). Note also that the density at the boundaries is several orders smaller than
the density in the center. All this exclude any impact of boundary conditions
and this is confirmed by the calculations, so the boundary conditions for this problem
can be any.
The revolution of the disk here
represents the time required for the disk matter in the maximum density area (r
= 0.8) to rotate fully around the gravitating object. As an example, we note
that for an accretion disk with a characteristic spatial radius R = 7×10¹¹
cm located in the gravitational field of the central body with mass M =
2×1033 g the physical time of one revolution is t = 2×10⁵
s.
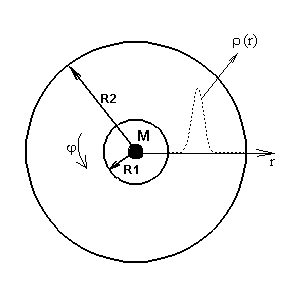
Fig. 1. Assumed area with
an equilibrium disk configuration.
In order to investigate the
stability of the disk we insert small perturbations in the equilibrium state of
the accretion disk. Note that without small perturbations disk saves its state
for a long time.
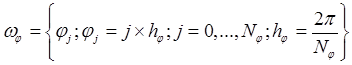
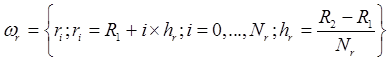
The computations are carried out on
a uniform grid ![]() :
:
 ,
,
 .
.
The assumed area and the number of
points on r (![]() ) remain the same in all the
variants of the task:
) remain the same in all the
variants of the task: ![]() .
.
Here, small sinusoidal perturbations
of the azimuthal velocity are specified against the background of the initial
equilibrium state of the disk: ![]() ,
, ![]() - azimuthal velocity in the initial
equilibrium state, А is the perturbation amplitude, n is the number of periods in the interval 0
≤ j < 2p. The width of the disturbance band with respect to r is two grid cells in
the maximum density region. The disturbance with А = 0.2 and n = 10 is introduced for 0≤j<2p. A grid w is used, where
- azimuthal velocity in the initial
equilibrium state, А is the perturbation amplitude, n is the number of periods in the interval 0
≤ j < 2p. The width of the disturbance band with respect to r is two grid cells in
the maximum density region. The disturbance with А = 0.2 and n = 10 is introduced for 0≤j<2p. A grid w is used, where ![]() . The grid is chosen so that in the disturbed
region the difference cells form is close to the square. This is done in order
to the grid resolution is similar in both variables.
. The grid is chosen so that in the disturbed
region the difference cells form is close to the square. This is done in order
to the grid resolution is similar in both variables.
For visualization of the first obtained
results using ClcView [2] flow patterns in the form
of density contours (Fig. 2) and vorticity contours ½rotV½ (Fig.
3) were constructed.
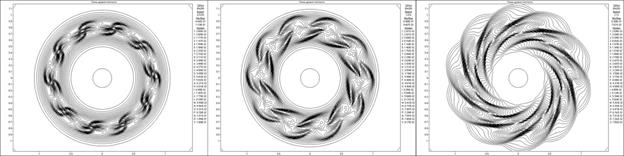
Fig. 2. Flow patterns in the form of density
contours in the maximum density
area till the time corresponding to half of the disk revolution (from left to
right).
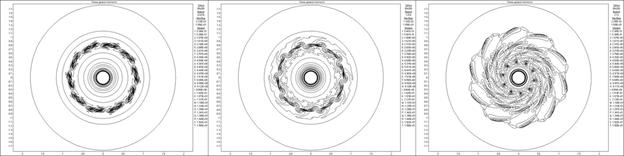
Fig. 3. Flow
patterns in the form of vorticity contours in the computational
domain till the time corresponding to half of the disk revolution (from left to
right).
The results show that small
perturbations specified in a narrow band develop into large-scale structures covering
the whole disk. A large number of calculated data required to accelerate the
visualization to analyze the results. The animation with color fill was used
for this (Fig. 4).
Fig. 4. The
animation with color fill of density (left) and vorticity
(right) to the time corresponding to two revolutions of the disk.
Expected
attenuation of the growing vortex motion at the initial stage as well as a huge
range of variation of the parameters show that the
visualization in the form of contour lines or animation with color fill
throughout the range of the parameter is not enough to investigate and
understand the structure of the developing flow. Consider in more details the
behavior of vorticity. Fig. 5 shows the animations of
the vorticity in the part of the area in a more narrow
range of vorticity change with indents from the
maximum and minimum. We see that large structures are formed and displaced
towards the outer boundary of the area, but since the density is small at the
outer boundary (here the density is five orders smaller than in the area of
maximum density) the outflow of the matter substantially does not
occur. It is also shown the formation of vortex streets resulting from matter
flow of formed vortex structures. Besides in the inner part of the area the
resulting structures can be seen. Note that at the density patterns to discern
any structure in the inner and outer parts of the computational domain is quite
difficult because of the low density.
Fig. 5.
Animations of the vorticity with color fill in the part of the area in
the range of vorticity change from 0.1 to 100 (left) and from 0.1 to 1000
(right) to the time corresponding to two revolutions of the disk.
Consider also the animation of
specific vorticity (½rotV½/r) in the part
of the area in the narrow range of vorticity change (Fig. 6) illustrating
the onset of instability and the formation and development of vortex streets as
well as the formation of spiral structures easily distinguishable in Fig. 2, 3,
4.
Fig. 6.
Animation of the specific vorticity with color fill in the part of the area
in the narrow
range of specific vorticity change to the time corresponding to two
revolutions of the disk.
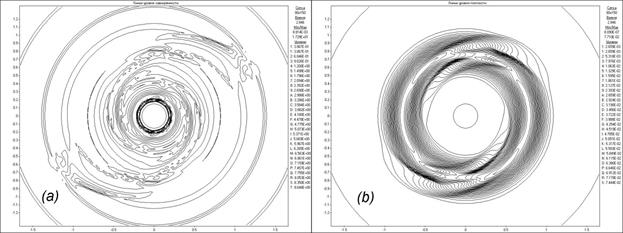
Fig. 7. Flow patterns in the form of (a) vorticity contours and (b) density contours when specifying
two local symmetric initial perturbations at the time corresponding to 2/3 of the disk revolution.
In [6, 7] it is shown that regardless
of the choice of perturbation parameter, the amount of perturbations in the
initial data, the amplitude A in the range of 0.01 to 0.2, disturbances introduced
in one- or two-cell bands, different numbers of local disturbances (ranging from
1 to 10 at n = 10 and from 1 to 20 at n = 20) and various grids (from 40
× 130 to 320 × 1040) the calculation results show that the flows
generated by these perturbations are qualitatively similar. Small disturbances
introduced into a stable disc evolve resulting over time in large-scale
turbulence structures which persist for a considerable period of time. This process cause a rearrangement of the flow in almost the
entire region, although the disturbance was introduced into only a small part
of the area. Moreover, in [7] it is shown that the kinetic energy of turbulent flow
(kinetic energy of the radial motion of disk matter, which is absent in the
equilibrium state) regardless of the initial amplitude A eventually goes to a
quasi-stationary mode in which it changes little over time fluctuating near an
almost constant value. Thus, it can be argued that the kinetic energy of
turbulence in the quasi-stationary regime determined by the initial kinetic
energy and does not depend on the energy of the perturbation. This confirms the
assumption about the development of large-scale turbulent motion in shear flow of
accretion disks and confirms that after the perturbation development peak vortex
structures do not disappear, flow remains vortex and as seen in Fig. 5, 6 large
structures transfer the angular momentum to the outer part of the disk.
Let us now analyse
the change and redistribution of the angular momentum in the flow. Fig. 8 shows
the distribution of the angular momentum along the radius at the initial instant
of time and at two full turns. Charting software Advanced Grapher
(http://www.alentum.com/agrapher/) is used. It is evident that angular
momentum is redistributed, the maximum of the angular momentum decreases
compared with the initial value and the region where the angular momentum is
mainly concentrated widens.
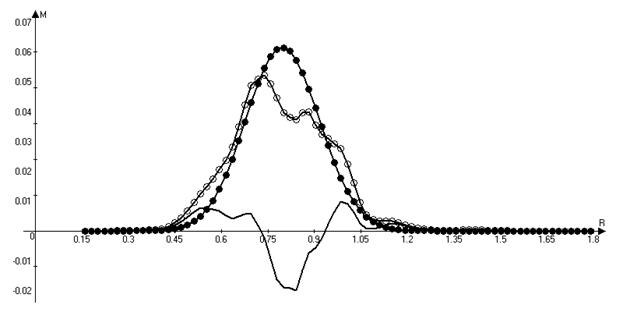
Fig. 8. Redistribution of the angular
momentum along the radius (j = 0°) at times t1
= 0 (●●●)and
t2 = 2 revolutions (○○○) and the difference
between the angular momenta M(t2) - M(t1) (▬▬).
Throughout the entire calculation
angular momentum is thrown out of the zone where most of the matter is
concentrated on both sides of the radius. The gas inside the internal boundary
of this region at time zero and particularly outside the external boundary
acquires considerable angular momentum. To illustrate the described processes
we use animation of distribution of the angular momentum along the radius and
the ratio of the current moment to the initial moment in time (Fig. 9).
Fig.
9. Distribution of
the angular momentum along the radius (ρvr ) and the ratio of the current moment
to the initial moment (right) during two revolutions of the disk (blue color - j = 0°, red color - j = 90°).
In [7] it is shown that the entropy
in the system is constant and total angular momentum and mass of the disk matter
in the system remain virtually unchanged which means that the redistribution of
angular momentum occurs by formed large vortex structures (and not due to the
flow of matter through the border) without appreciable heating of the disk matter
which is consistent with observations.
3.2 Local perturbation in the outer part of the accretion disk with non-Keplerian velocity distribution
In addition to studying the
development of small perturbations of various parameters in the maximum density
area of the disk the process of evolution of a small perturbation introduced
locally near the outer boundary of the accretion disk where the density of
matter is small (several orders less than the average density of the disk matter)
is very interesting. Perturbation of velocity and density at the edge of the
disk may be associated with different physical processes such as accretion of
matter with another angular momentum at the outer edge of the accretion disk,
tidal interaction in binary systems, span of heavy
body through an accretion disk. In this case the problem is considered in the
formulation similar to that described above but in the outer part of the
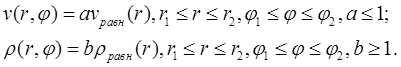
accretion disk the area simulating perturbation with density ![]() , velocity
, velocity ![]() and volume
and volume ![]() is given. Perturbation in the outer area of the disk
is given as:
is given. Perturbation in the outer area of the disk
is given as:
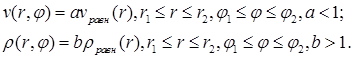
Perturbation parameters for the represented
calculation are selected by the following: ![]() Perturbation area contains two cells
in r and five cells in φ.
Perturbation area contains two cells
in r and five cells in φ.
Fig. 10 shows the calculation results as an animation of the flow pattern in the form of density and vorticity contours. Small perturbation in the outer area of the disk inserted to the equilibrium state in a small region develops and eventually several large structures that exist throughout the calculation are formed. Note that due to the low density at the outer part of the disk the animation representing the density show only portion of structures located in the area of the disk. The largest structure is outside the area of the disk and is only visible in the picture of the vorticity. It shows at the initial stage of development of the perturbation the dual vortex street behind this large structure resembling a Karman vortex street formed as a result of matter flow around developed large structure.
Fig. 10. Flow patterns in the form of density
contours (left) and vorticity contours (right) with
perturbation in the outer area of the disk to the time
corresponding to seven revolutions.
Perturbation introduced at the edge
of the disk goes into the high-density area and eventually captures a
significant area of the disk. Formation of structures in the center of the
computational domain speaks about the increased inner accretion. Flow in the disk undergone substantial restructuring remaining
vortex, large spiral vortex structures are formed in it, and there is a
significant redistribution of the density [8].
Redistribution of the angular momentum
along the radius at the initial time and the time corresponding to the five revolutions
represented in Fig. 11 illustrates a substantial redistribution of the angular
momentum in the disk. It can be seen that the removal of the angular momentum
in a certain angular direction is asymmetric because of intensive loss of
angular momentum by matter in the area with large structures in the outer region
of the disk resulting in compression of the outer part and increase of the maximum
of the angular momentum profile.
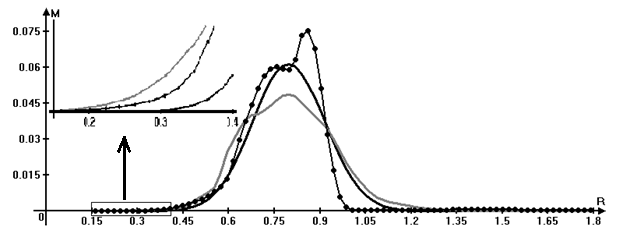
Fig. 11. Redistribution of the angular
momentum along the radius at times
t1 = 0 (▬▬) and t2 = 5 revolutions (▬▬ -
j=0°, ●●● - j=180°).
3.3 Perturbations in the Keplerian accretion disk
Here, we change the
initial state, choosing an azimuthal-velocity distribution that is close to the
observed one; i.e., we will assume an equilibrium state with a Keplerian velocity distribution the analytical solution for
which is given in [5].
In dimensionless variables, a Keplerian azimuthal-velocity distribution is specified by
the formula ![]() . The given analytical solution describes an
inner part of the disk (approximately the inner half), because there are no
equilibrium states in the form of a torus for Keplerian
disk. Therefore, the boundary conditions at the outer boundary of the region of
the accretion disk considered will exert a considerable influence on the flow
evolution, since there will be a flux of mass and angular momentum at the outer
boundary. Fig. 12 presents the computational domain and a profile of the
initial equilibrium density.
. The given analytical solution describes an
inner part of the disk (approximately the inner half), because there are no
equilibrium states in the form of a torus for Keplerian
disk. Therefore, the boundary conditions at the outer boundary of the region of
the accretion disk considered will exert a considerable influence on the flow
evolution, since there will be a flux of mass and angular momentum at the outer
boundary. Fig. 12 presents the computational domain and a profile of the
initial equilibrium density.
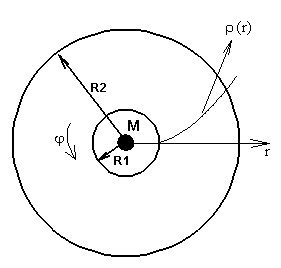
Fig. 12. The
computational domain and the configuration
of the disk with the Keplerian velocity distribution.
Here similar to paragraph 3.1, small
sinusoidal perturbations of the azimuthal velocity are specified against the
background of the initial equilibrium state of the disk. The problem is solved
in the ![]() , where
, where ![]() The computations were carried
out on a grid w, where
The computations were carried
out on a grid w, where ![]() . The perturbations are specified in
a band with a width of one cell in r at
. The perturbations are specified in
a band with a width of one cell in r at ![]() , 0≤j<2p, i.e., near the outer boundary of
the disk region considered, which approximately fits the central part of the
whole disk. Let us consider the behavior of the system with time. We take a
disk revolution to correspond to the dimensionless time t ≈ 30 over which
the matter near the outer boundary of the computational domain undergoes one
revolution around the central gravitating body.
, 0≤j<2p, i.e., near the outer boundary of
the disk region considered, which approximately fits the central part of the
whole disk. Let us consider the behavior of the system with time. We take a
disk revolution to correspond to the dimensionless time t ≈ 30 over which
the matter near the outer boundary of the computational domain undergoes one
revolution around the central gravitating body.
Let us consider the behavior of the
system with time. Fig. 13 shows the animation of the density with color fill to
the time corresponding to eight revolutions of the disk.
Fig. 13.The
animation of the density with color fill for the Keplerian
disk to the time corresponding to eight revolutions of the disk.
There is the formation of spiral vortical structures in the entire disk, i.e. small
perturbations specified in a narrow band develop into large-scale structures covering
the whole disk and persisting for a considerable period of time. These results
qualitatively repeat the results for a non-Keplerian
disk in paragraph 3.1.
In [9] it is shown that at the
initial stage, during the formation of the vortices, mass and momentum are
ejected through the outer boundary, as a result of which the system makes a
transition to another state that is close to stationary, with the flow in the disk
remaining vortical. The flow of disk material tends
to some equilibrium stationary state, but the presence of large vortical structures prevents this, so that the system is in
a quasi-stationary state for a long time; this quasi-stationary state is
characterized by periodic pulsations of the flow parameters, induced by the
periodic outflow and inflow of mass and angular momentum through the outer
boundary. Fig. 14 presents flow patterns in the form of density contours with velocity
vectors corresponding to the beginning and end of one period of the
quasi-stationary pulsation state. Fig. 14a shows that the main outflow of
matter is between large structures, since these structures decelerate the matter
flux and are themselves pushed towards the outer boundary by the total mass
flux (angular momentum outflow). In Fig. 14b, the main matter inflow is in the
region of large structures, since these structures are shifted towards the center,
and the matter between these structures is decelerated by the inward flux in
the disk through theouter boundary (accretion).
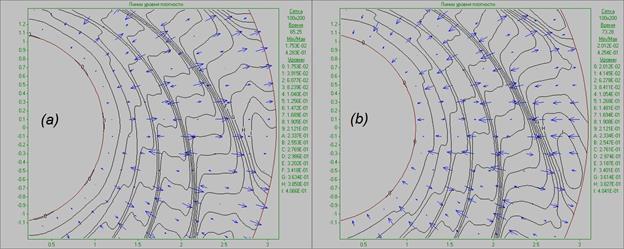
Fig. 14. Flow pattern in the form of density
contours for the Keplerian
disk at time t = 2 revolutions
(а) и t = 2.5 revolutions (b).
In [9] it is shown that a
considerable redistribution of the angular momentum has occurred with time, compared
to the initial distribution, in agreement with the results for a non-Keplerian disk in paragraph 3.1.
These studies show that large vortical structures forming in the disk lead to a
redistribution of angular momentum in the disk and removal of matter and
angular momentum through the outer boundary, but the accretion arising as a
result of the angular momentum loss leads to an inflow of the matter and, hence,
an increase of the angular momentum.
Further study of the system’s
evolution shows that, with time, the flow starts to lose its symmetry (Fig. 15а), leading to a qualitative change
of the flow pattern—the joining and enlargement of the vortices (Fig. 15b). Fig.
15 presents flow patterns in the form of density contours at time t = 550 (∼ 18 revolutions), when the flow begins to lose its symmetry (Fig. 15a),
and at time t = 700 (∼ 23 revolutions), by which time the
flow has undergone considerable reconstruction and separate asymmetrical larger
vertical structures have formed. Note that the arising two-spiral structure is
qualitatively similar to the structure in paragraph 3.2, which arises due to
the development of local perturbation in the outer region of the non-Keplerian accretion disk.
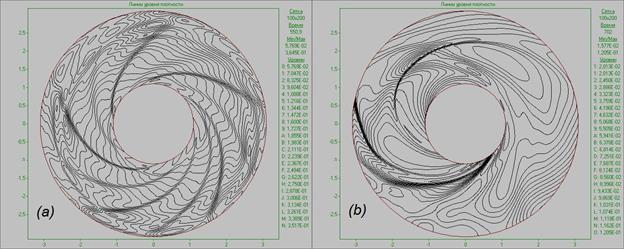
Fig. 15. Flow pattern in
the form of density contours
for the Keplerian
disk at time
t = 18 revolutions (а) и t = 23 revolutions
(b).
From the time of the symmetry loss
by the flow (t ≈ 550, 18 revolutions) and the onset of the growth of the vortical structures, the removal of angular momentum and
disk matter through the outer boundary begins to occur. As a result, the rate
of inward accretion increases strongly, and matter begins to flow out actively
through the inner boundary. Thus, large vortical
structures provide a mechanism for the outward transport of the angular
momentum of the disk matter, leading to matter accretion through the inner
boundary of the computational domain towards the central gravitating body.
We also consider the problem of the origin of the local perturbation in the accretion disk with Keplerian velocity distribution. Such a perturbation can be written as:
Perturbation parameters for the represented
calculation are selected by the following: ![]() Perturbation area contains two cells
in r and five cells in φ.
Perturbation area contains two cells
in r and five cells in φ.
Fig. 16 shows the animation of the density
with color fill to the time corresponding to eleven revolutions of the disk.
Calculations show that small perturbation emulated the falling of a heavy body
in the area of disk inserted to the equilibrium state develops
and eventually several large structures that cover significant part of the computational
domain and exist throughout the calculation are formed. Perturbation leads to
the restructuring of the flow throughout the computational domain, thus formed
flow qualitatively resembles the flow arising in the previous task after losing
the symmetry by flow (Fig. 15b), but here such flow was formed earlier as
originally did not have symmetry.
Fig. 16. The animation of the density with color
fill for the Keplerian disk with
local perturbation to the time corresponding to eleven revolutions of the disk.
Behavior of the angular momentum qualitatively reproduces the behavior
of the angular momentum for the above problem, so we will not give here the
analysis of the behavior of the angular momentum. Note that the large vortex structures lead to removal of angular momentum through the outer boundary and increasing of inner accretion.
Thus, studies and visual analysis confirm
that for Keplerian disk results obtained for the non-Keplerian accretion disk are qualitatively correct.
Using modern methods of
visualizing the results of scientific
calculations allowed us to study the
properties of vortex flows arising
in accretion stellar disks as a result of the instability development. This,
in turn, allowed to propose a new mechanism of angular momentum transfer to the outer parts of the disk by large vortex structures formed as a result of the
instability development. Removal of angular momentum
leads to the accretion of matter onto
a central gravitating body and causes the observed radiation.
This work has been
supported by the Russian Foundation for Basic Research (project codes 12-01-00606
and 12-02-00687), the Basic Research Programs 15 and 21
of the Presidium of the Russian Academy of Sciences and the Program of State
Support of Leading Scientific Schools of the Russian Federation (grant NSh-6061.2014.2).
1. A. E. Bondarev, V. A. Galaktionov, V. M. Chechetkin. Scientific Visualization for Computational Fluid Dynamics. Scientific Visualization. vol. 2, no 4, 2010, pp. 1 - 26. Available at: http://sv-journal.com/2010-4/01.php
2. M. V. Abakumov, A. Yu. Lugovsky. About Visualization Methods of Grid Data and their Implementation in the Application Program ClcView. Scientific Visualization. vol. 6, no 1, 2014, pp. 68 - 105. Available at: http://sv-journal.com/2014-1/05.php
3. A. Yu. Lugovskii, S. I. Mukhin, Yu. P. Popov, V. M. Chechetkin. Chislennye metody dlya modelirovaniya razvitiya turbulentnosti v akkretsionnykh diskakh [Numerical Methods for Turbulence Modelling in Accretion Disks]. MAKS Press, Мoscow, 2003.
4. M. V. Abakumov, S. I. Mukhin, Yu. P. Popov, V. M. Chechetkin. Comparison B etween Two-and Three-Dimensional Modeling of the Structure of an Accretion Disk in a Binary System. Astronomy Reports, vol. 47, no 1, 2003, pp. 11-19.
5. M. V. Abakumov, S. I. Mukhin, Yu. P. Popov, V. M. Chechetkin. Studies of Equilibrium Configurations for a Gaseous Cloud Near a Gravitating Center. Astronomy Reports, vol. 40, no 3, 1996, pp. 366-377.
6. A. Yu. Lugovskii, S. I. Mukhin, Yu. P. Popov, V. M. Chechetkin. Evolyutsiya melkomasshtabnykh vozmuscheniy v akkretsionnykh diskakh [The Evolution of Small-Scale Perturbations in Accretion Disks], MAKS Press, Мoscow, 2005.
7. E. P. Velikhov, A. Yu. Lugovskii, S. I. Mukhin, et al. The Impact of Large-Scale Turbulence on the Redistribution of Angular Momentum in Stellar Accretion Disks. Astronomy Reports, vol. 51, no 2, 2007, pp. 154-160.
8. A. Yu. Lugovskii, S. I. Mukhin, Yu. P. Popov, V. M. Chechetkin. The Development of Large-Scale Instability in Stellar Accretion Disks and its Influence on the Redistribution of Angular Momentum. Astronomy Reports, vol. 52, no 10, 2008, pp. 811-814.
9. A. Yu. Lugovskii, V. M. Chechetkin. The Development of Large-Scale Instability in Keplerian Stellar Accretion Disks. Astronomy Reports, vol. 56, no 2, 2012, pp. 96-103.