Content
Comparison of two visualisation methods
ABSTRACT
Behavior of wake vortex systems and their
interaction with shock waves is one of the fundamental problems of
aerogasdynamics. This problem has been studied most thoroughly for subsonic
flow regimes, because it is of great interest to civil aviation, in particular
in terms of airport traffic capacity. The same problem at supersonic velocity
represents a separate interest with its own specificity. This has become
particularly important against increased interest for development of high-speed
transport systems. In this paper we consider a different visualization methods
of dataset obtained for the case of wingtip vortex that interact with a bow
shock generated by cylinder obstacle mounted downstream of the wing edge.The
dataset have been obtained by numerical simulation of the flow in the framework
of URANS and LES with different turbulence models.
Key words:
wingtip vortex, turbulent flow, visualization methods
NOMENCLATURE
ui components
of velocity vector
S strain-rate tensor
Ω spin tensor
r density
λi eigenvalues
Behavior of wake vortex systems and their
interaction with shock waves is one of the fundamental problems of
aerogasdynamics.
Vortices generated by upstream located
aerodynamic surfaces of an aircraft can interfere with shock waves generated by aircraft
elements located downstream or with the shock waves at the inlet entrance. In
many cases this leads to vortex breakdown, which can worsen the lifting
properties of aerodynamic surfaces or be the reason for critical regimes of
engine operation.
This problem has been studied most
thoroughly for subsonic flow regimes, because it is of great interest to civil
aviation, in particular in terms of airport traffic capacity. Indeed, vortices
generated by an aircraft survive long enough, and this turbulence represents
potential danger in a zone of landing / launching (taking off) of the airports,
especially if they are loaded enough when time between launching / landing of
airplanes is less than time of turbulence attenuation. Thus, wake vortices are
a potential hazard to other aircraft encountering them.
The same problem at supersonic velocity
represents a separate interest with its own specificity. This has become
particularly important against increased interest for development of high-speed
transport systems.
Along with the negative aspects, the
shock-vortex interaction phenomenon is considered as one of the methods for
increasing the mixing coefficient in the scramjet combustor.
However such type of systems has not been
yet adequately studied neither theoretically nor experimentally.
Nevertheless, during exploration of
aerodynamic challenges it is not sufficient simply to find a correct algorithm
and to realize accurately its numerical version. Indeed, it is also necessary
to visualize the obtained results in manner that allows better understand the
process. Hence, another important problem that appears is a visualization of
calculated dataset that often is enormous thereby it is difficult to work with
it.
The overview of basic vortices detection
and visualization algorithms from computational dataset are described in the
paper of Jiang et al. (2005).
The purpose of this work is to find an
adequate visualization of numerical dataset that can helps to understand
processes which take a place.
Definition and visualization of vortical structures is an important problem, in particular such of them as wingtip vortices.
Despite lacking a strict formal definition of a vortex, there are various algorithms which can be applied to determination and visualization of vortices from the majority of dataset files.
Except a method of density distribution it is possible to allocate nine basic methods (Jiang et al., 2005): 1) Helicity Method 2) Swirl Parameter Method 3) Lambda-2 Method 4) Predictor-Corrector Method 5) Eigenvector Method 6) Parallel Vectors Method 7) Maximum Vorticity Method 8) Streamline Methods 9) Combinatorial Method.
In this paper we focus on comparison of visualization results obtained by two most widely used methods: density distribution method and Lambda-2 method. We will demonstrate their application on dataset obtained from the numerical simulation of interaction between wingtip vortex and head shock wave.
Vortex visualization method through density distribution is based on physical reasons. A gradient of density with a minimum value in the center of vortex is produced by a centripetal force of the rotation motion. Namely, a density minimum is reached in the vortex centre, i.e. isosurfaces of stream density are drawn for vortex visualization by this method. Besides, a pressure reaches its minimum on the vortex axis also. However, this condition isn't sufficient (Jiang et al., 2005).
Lambda-2 method has been initially proposed in Jeong and Hussain (1995) and consists in the following. The condition of a pressure minimum is not sufficient for vortex identification. The pressure minimum out of vortex core may be caused by unsteady irrotational straining. There are may be the situations when the pressure doesn’t reach its minimum inside of vortex due to viscous effects. To avoid these effects, one can decompose the velocity gradient matrix on symmetric part (the rate of deformation or strain-rate tensor S) and antisymmetric part (spin tensor Ω):
![]() (1)
(1)
By authors of the method, the vortex is defined as a
connected region where the matrix ![]() has two
negative eigenvalues. Since this matrix is real and symmetric, it has only real
eigenvalues
has two
negative eigenvalues. Since this matrix is real and symmetric, it has only real
eigenvalues ![]() , such that
, such that ![]() . If value
. If value ![]() is negative at a
point therefore this point belongs to a vortex core.
is negative at a
point therefore this point belongs to a vortex core.
In this
paper we present the results of application of two mentioned vortex definition
methods (density distribution and lambda-2) in 3D domain to the data set
obtained from numerical simulation of interaction of a wingtip vortex generated
by wing with a head shock wave generated by cylinder located downstream of wing
edge. The Mach number is equal to 3. The wing angle of attack makes 10°. During
calculation of the data set 3D multi blocks grid is used, the area is devised
into 128 blocks, total quantity of cells is 18 134 400. Therefore, a data set
is voluminous and thus one multiprocessor system was used. As a result, in each
cell coordinates of its center, velocity vector and hydrodynamics are
specified, thus result data file volume is about 1 Gb, depending on its format.
Consequently, it is difficult to work with it. Setup for experimental and numerical
simulation of the data set is representing on the figure
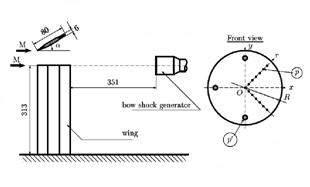
Fig.1. Setup for experimental and numerical simulation
On the figure 2 the density isosurfaces are displayed in 3D space. On this figure a shock wave from the front edge of the wing is properly recognizable. Also, one can distinguish an approximate boundary of interaction zone between a wingtip vortex and a head shock wave.
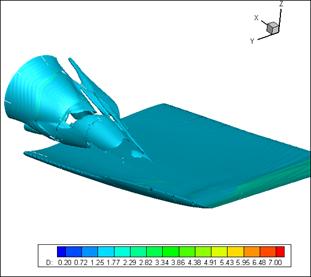
Fig.2. Density isosurfaces, ρ = 1.45 and ρ=1.917.
The
isosurfaces of second eigenvalue ![]() of tensor
of tensor ![]() in 3D space are
represented on the figure 3. On this figure, in contrast to the previous one,
one can perfectly recognize a wingtip vortex and a vortical structures within
interaction zone between a wingtip vortex and a head shock wave. At the same
time, a shock wave from the wing can't be seen on this figure.
in 3D space are
represented on the figure 3. On this figure, in contrast to the previous one,
one can perfectly recognize a wingtip vortex and a vortical structures within
interaction zone between a wingtip vortex and a head shock wave. At the same
time, a shock wave from the wing can't be seen on this figure.
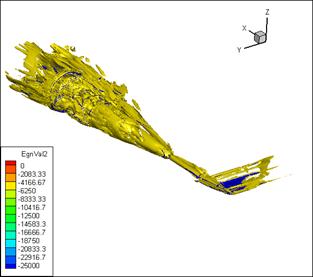
Fig.3. Second eigenvalue isosufraces, λ2 =
-25000 and λ2 = -5000.
COMPARISON OF TWO
VISUALISATION METHODS
To achieve a purpose of this work we employ and compare two methods of vortex visualization: density distribution method and lambda-2 method.
For more detailed comparison of application results of these two vortex visualization methods various slice have been made from longitudinal (along a stream) and transversal directions.
Firstly we will consider results on wing tip, in cross-section at x= 0.0075 (on the wing at approximately 60 % of wing chord) (fig.4).
As it is easy to see (fig. 4), the density distribution doesn't display an appearance of wing-tip vortex formation on a wing edge, however the results of lambda-2 method employment clearly show occurrence of the vortex failing from a wing tip.
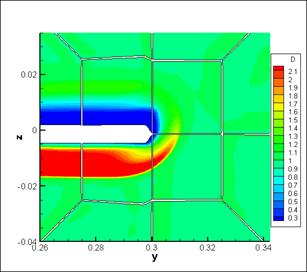
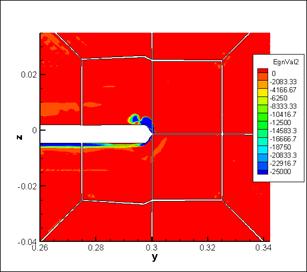
Fig.4. Cross-section at
x=0.0075 (wing), left - density distribution, right - eigenvalue λ2
distribution.
The similar situation occurs in cross-section at х=0.1 (approximately 1,5 chord length behind a trailing edge of the wing). Lambda-2 method yields more accurate results concerning a vortex core (boarders and position), than density distribution (fig. 5). On the image of density distribution the vortex merges together with wake from the wing (fig.5, left).
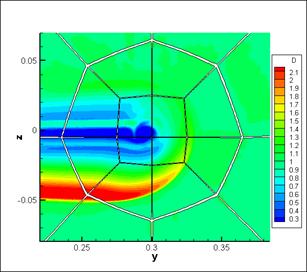
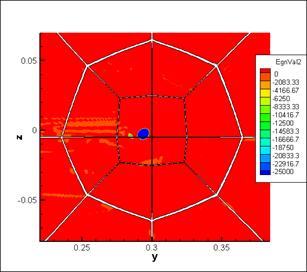
Fig.5. Cross-section at x=0.1 (below the wing), left - density
distribution, right - eigenvalue λ2
distribution.
Now we consider a streamwise section at y = 0.285. With regard to geometry, this slice approximately coincides with the wing edge and with the cylinder center.
On the fig. 6
and fig. 7 we can see that having used a density distribution it is possible to
distinguish a boundary of vortex core and a boundary of domain of its
interaction with a conic bow shock wave.
However, smaller internal vortical structures within the interaction
domain aren't visible. By contrast, results of lambda-2 method application show
very well a vortical structures appearing during an interaction of a wingtip
vortex and a head shock wave including a turbulence inside of the interaction
domain. And by this method in this case it is impossible to determine exactly
the boundary of the interaction domain.
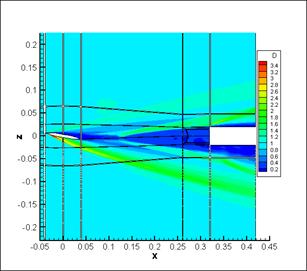
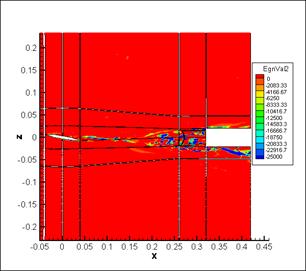
Fig.6. Cross-section at y=0.285, left - density
distribution, right - eigenvalue λ2
distribution.
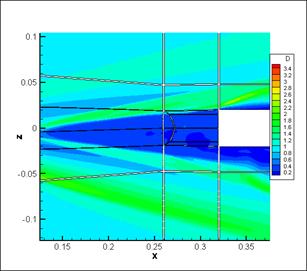
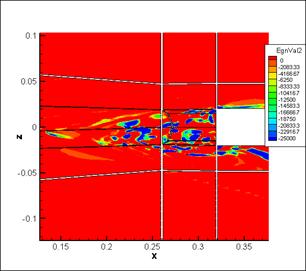
Fig.7. Cross-section at y=0.285 (zoom on interaction
domain), left - density distribution, right - eigenvalue λ2 distribution.
Another one slice at x=0.29 of the interaction domain is presented on the fig. 8 for more details. This cross-section passes through the thick of the interaction domain (of a wingtip vortex with a head shock wave). By means of density distribution we can see only a boundary of interaction domain and not enough details. Through lambda-2 method we can't see exactly a boundary of the interaction domain, but we can see details inside.
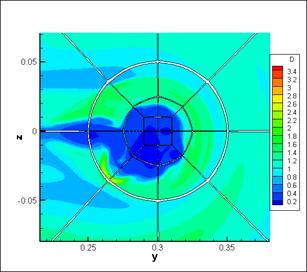
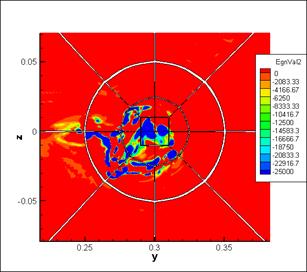
Fig.8. Cross-section at x=0.29 (zoom on interaction
domain), left - density distribution, right - eigenvalue λ2 distribution.
From the presented results we can see that the lambda-2 visualization method gives more accurate presentation about position and structure of a wingtip vortex, than density distribution gives, particularly in the vicinity of the wing. Moreover, it gives more detailed idea about vortical structures inside of domain of interaction between a wingtip vortex and a head shock wave. However, it is noteworthy that the borders of the interaction domain are no longer visible using a lambda-2 method and they are visible using a density distribution method. At the same time, a lambda-2 method is quite illustrative by itself. The essential conclusion is: don't be confined to use any one method of visualization, use two or even more methods for the same data, because each method is good for their goals.
ACKNOWLEDGMENTS
This work was supported by RFBR projects numbers 11-01-12043
and 11-08-00269.
REFERENCES
Jeong,
J. and Hussain, F (1995). On the Identification of a Vortex. J. Fluid Mechanics, 285: pp. 69-94.
Jiang, M., Machiraju, R. and Thompson, D. (2005)
Detection and visualization of vortices.
Visualization Handbook. Elsevier, pp. 295-309.
Kharitonov,
A.M., Lutsky, A.E. and Shevchenko, A.M. (2007) Investigations of supersonic
vortex cores above and behind of a wing. Proc.
of 2nd European Conference for Aerospace Sciences,
Shevchenko, A.M., Lutsky, A.E., Chernoguzov, A.S. and Polkova,
K.Yu. (2007) Exp. Fluids Techniques and results for investigations of
supersonic wing-tip vortices. Proc. of
XIII International Conference on the Methods of Aerophysical Research,